Pater Tenebrarum
My articles My siteAbout meMy videosMy books
Follow on:TwitterSeeking AlphaFacebook
Anecdotal Skepticism vs. Actual DataAbout one month ago we read that risk parity and volatility targeting funds had record exposure to US equities. It seems unlikely that this has changed – what is likely though is that the exposure of CTAs has in the meantime increased as well, as the recent breakout in the SPX and the Dow Jones Industrial Average to new highs should be delivering the required technical signals. All these strategies are more or less automated (they may be tweaked from time to time, but essentially they are simply quantitative and/or technical strategies relying on inter-market correlations, volatility measures, and/or momentum). Active fund managers by contrast are said to be skeptical of the market rally, but it should be stressed that the evidence for this is purely anecdotal. |
 About one month ago we read that risk parity and volatility targeting funds had record exposure to US equities. It seems unlikely that this has changed – what is likely though is that the exposure of CTAs has in the meantime increased as well, as the recent breakout in the SPX and the Dow Jones Industrial Average to new highs should be delivering the required technical signals. - Click to enlarge |
| The vast bulk of trading is nowadays automated. We recently read that in 2015, 23% of the entire year’s equity trading volume was accounted for by the top 100 ETFs (h/t to Brent Johnson of Santiago Capital). These are passive investments – in other words, they are brainless.
In addition to this, some 50% of volume is probably attributable to high frequency trading, and the above mentioned black box strategies presumably account for a good chunk of trading volume as well. This raises an interesting question: how many trades are still made by someone who actually thinks about what he is doing? Does it even matter whether active fund managers are skeptical or not? |
 About one month ago we read that risk parity and volatility targeting funds had record exposure to US equities. It seems unlikely that this has changed – what is likely though is that the exposure of CTAs has in the meantime increased as well, as the recent breakout in the SPX and the Dow Jones Industrial Average to new highs should be delivering the required technical signals. - Click to enlarge |
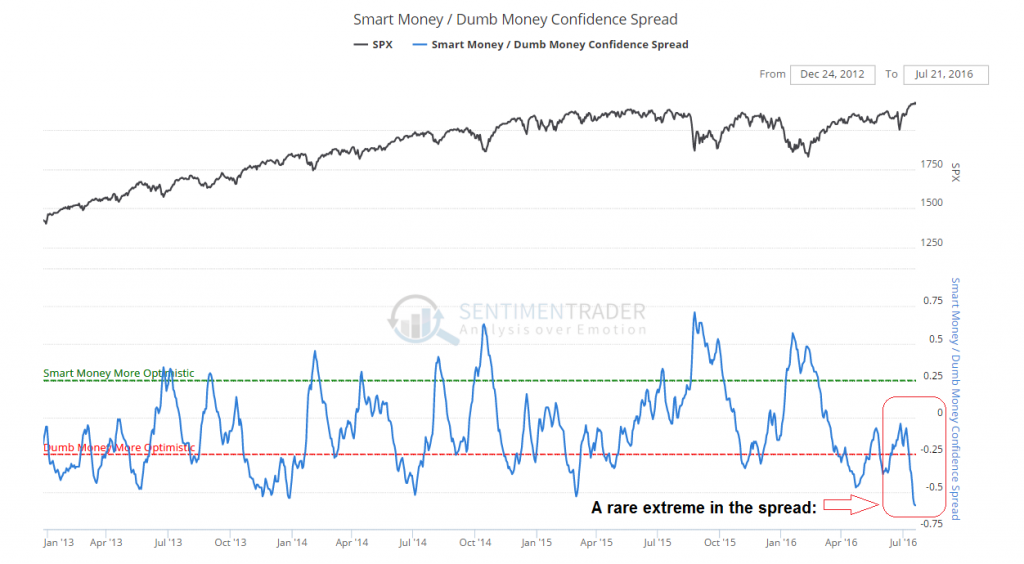
| What prompts us to wonder about this is the following chart. It shows the so-called “smart-dumb money confidence spread” calculated by sentimentrader, which tries to show what historically good and bad market timers are doing with their money. Its construction involves mainly real money gauges (for instance options and futures positioning data, short selling data, odd lot purchases, etc.) rather than “opinions”.
Admittedly, in bull markets the spread appears to be better at catching lows than highs, but when it reaches a rare extreme, it is probably worth paying attention to it. Based on this chart (and the next one), one could easily get doubts about the “anecdotal skepticism” mentioned above. We know though that such skepticism exists, because “tail risk premiums” remain quite high. For instance, the SKEW index still stands at approx. 128 after spiking to a record 155 in June and the CSFB fear barometer remains at an elevated level as well – this indicates that far ootm SPX put option protection remains fairly expensive on a relative basis, in spite of the sharp decline in the VIX. |
 About one month ago we read that risk parity and volatility targeting funds had record exposure to US equities. It seems unlikely that this has changed – what is likely though is that the exposure of CTAs has in the meantime increased as well, as the recent breakout in the SPX and the Dow Jones Industrial Average to new highs should be delivering the required technical signals. - Click to enlarge |
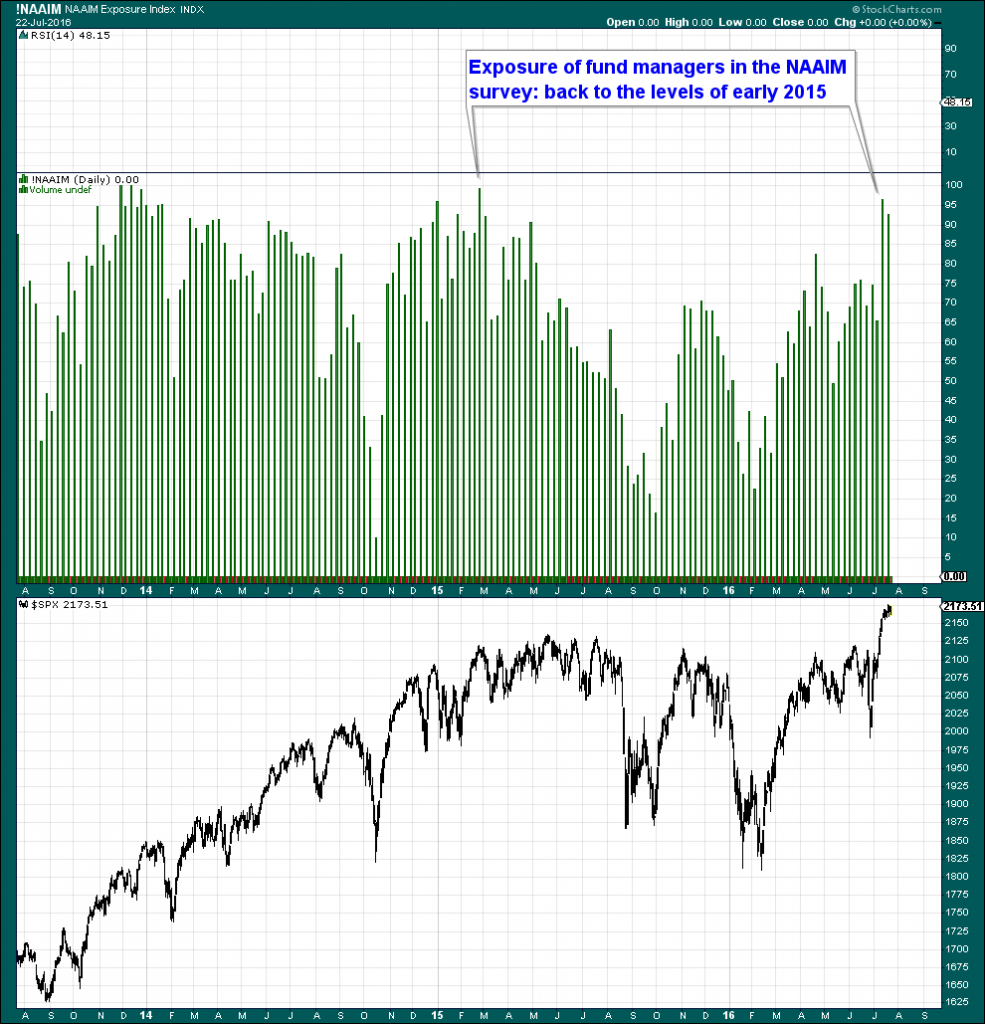
| The next chart shows the aggregate market exposure reported by fund managers taking part in the NAAIM survey. It currently stands almost at 95% net long, a level last seen in early 2015.
So if you want to find skepticism on the part of fund managers, it seems to depend on whom you actually ask. The NAAIM survey definitely indicates unbridled enthusiasm rather than skepticism. Algos have yet to answer to survey questions, but we suppose they simply don’t care. |
 About one month ago we read that risk parity and volatility targeting funds had record exposure to US equities. It seems unlikely that this has changed – what is likely though is that the exposure of CTAs has in the meantime increased as well, as the recent breakout in the SPX and the Dow Jones Industrial Average to new highs should be delivering the required technical signals. - Click to enlarge |
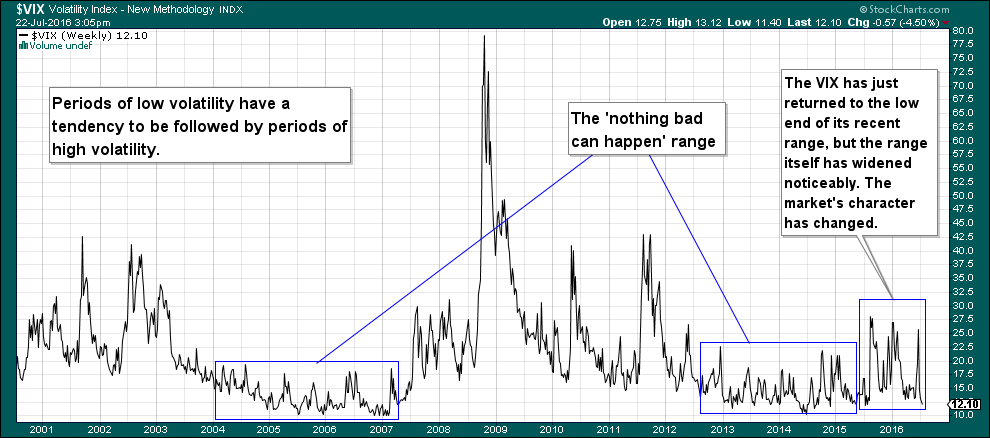
| The VIX is at a very low level again these days (volatility targeting funds should be even more exposed to stocks as a result), but its recently much wider range shows that the market’s character has changed compared to the mid 2012- mid 2015 time period: |
 About one month ago we read that risk parity and volatility targeting funds had record exposure to US equities. It seems unlikely that this has changed – what is likely though is that the exposure of CTAs has in the meantime increased as well, as the recent breakout in the SPX and the Dow Jones Industrial Average to new highs should be delivering the required technical signals. - Click to enlarge |
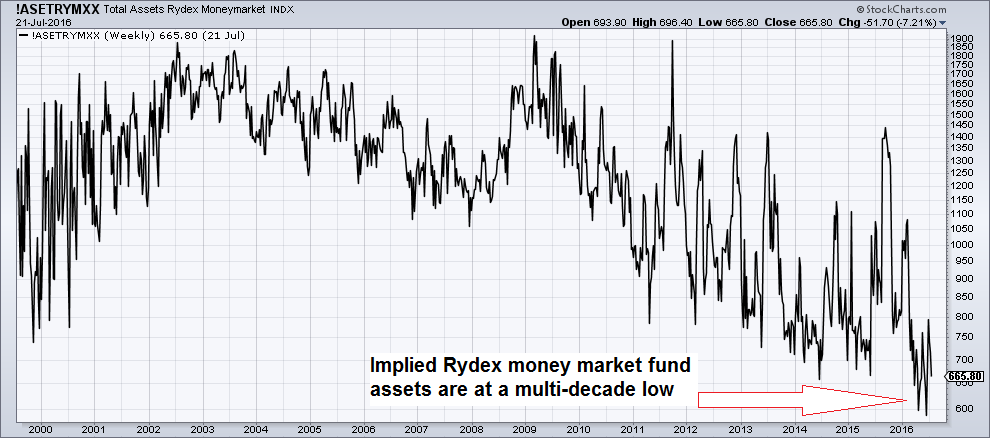
| The next chart shows implied Rydex money market assets, which are actually well aligned with the ratio between retail money market fund assets and the stock market’s total capitalization, which has been stuck close to all time lows for several years now. It sure seems as if retail investors continue to think cash is trash.
Positioning data clearly belie the often heard assertion that this is the “most hated bull market ever”. If it were, people would try to hold larger cash balances and we wouldn’t see extreme confidence reflected in the positioning of small traders and fund managers alike. The mood of the general public with respect to the economy is certainly not overly optimistic, but the same cannot be said of most stock market participants. |
 About one month ago we read that risk parity and volatility targeting funds had record exposure to US equities. It seems unlikely that this has changed – what is likely though is that the exposure of CTAs has in the meantime increased as well, as the recent breakout in the SPX and the Dow Jones Industrial Average to new highs should be delivering the required technical signals. - Click to enlarge |
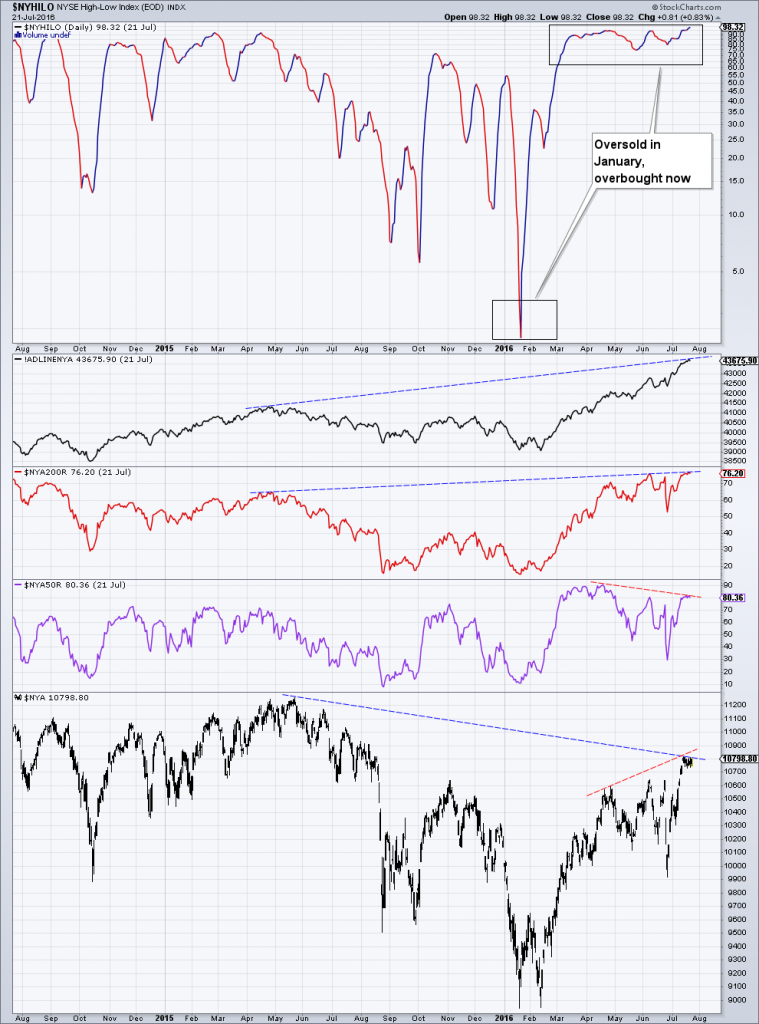
Strong Internals and a Plethora of DivergencesPrior to the increase in volatility that started in the summer of last year, market internals had weakened for a very long time – in fact, they began to weaken as soon as the Fed initiated the “tapering” of QE3 (we believe this is no coincidence). Since the February 2016 low, market internals have improved considerably though. Once again, this is probably no coincidence. Concurrently with the improvement in internals, commodities and emerging market currencies have strengthened noticeably. All of this hinges on the notion that Fed rate hikes are no longer on the table, all protestations by Fed officials to the contrary. The idea isn’t too far-fetched. Ms. Yellen seems to be looking for excuses to avoid tightening policy at every opportunity. One day it’s China, the next day it’s the Brexit… and who knows what rationale will be cited next. With the ECB and the BoJ pumping all out and the USD strengthening again, we would guess she probably remains uncomfortable with the idea of hiking rates. Strong market internals are of course regarded as a positive factor, and usually rightly so. However, one could argue that they occasionally simply work as “oversold/ overbought” indicators, especially if they diverge from prices. After all, the very same indicators that look so bullish now, looked abysmally bearish right at the point when buying would actually have been a good idea, at least from a tactical short term perspective. This is demonstrated by the NYSE Index and several measures of its internals shown below. We have picked the NYA rather than the S&P 500 because it is a much broader index. |
 About one month ago we read that risk parity and volatility targeting funds had record exposure to US equities. It seems unlikely that this has changed – what is likely though is that the exposure of CTAs has in the meantime increased as well, as the recent breakout in the SPX and the Dow Jones Industrial Average to new highs should be delivering the required technical signals. - Click to enlarge |
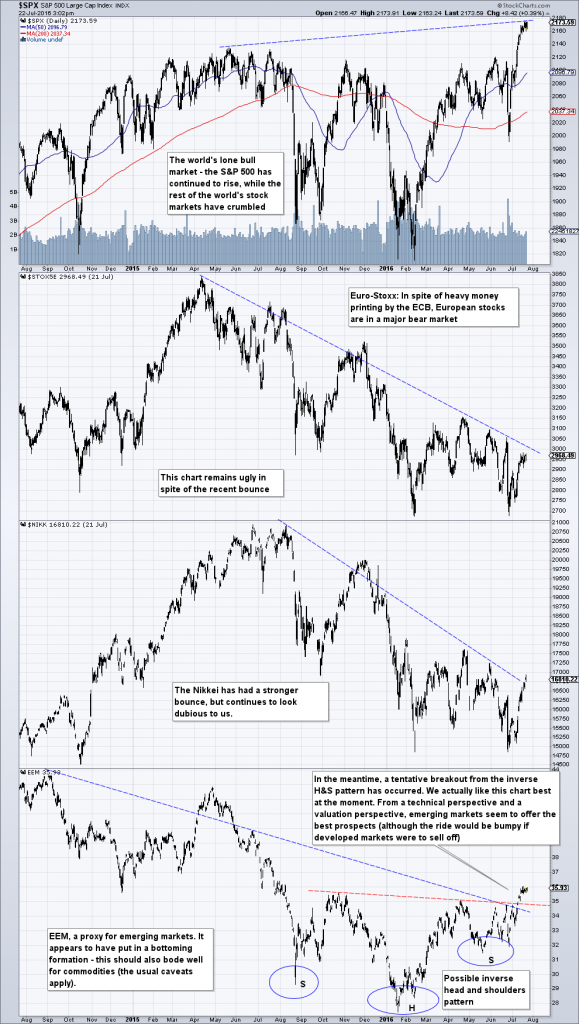
| The much more widely watched S&P 500 Index as well as the DJIA have of course broken into new high territory after a very long time of going sideways in a widening range. Such breakouts can at times lead to very strong moves in the direction of the trend (see for instance the Nasdaq’s blow-off in late 1999/ early 2000 for an extreme example). One should therefore have some respect for them – especially considering the current backdrop of global monetary policy insanity.
However, if one looks at a comparison chart that shows the SPX relative to other major markets, its breakout remains widely unconfirmed – and the gap is widening rather than shrinking: |
 About one month ago we read that risk parity and volatility targeting funds had record exposure to US equities. It seems unlikely that this has changed – what is likely though is that the exposure of CTAs has in the meantime increased as well, as the recent breakout in the SPX and the Dow Jones Industrial Average to new highs should be delivering the required technical signals. - Click to enlarge |
| SPX vs. Euro-Stoxx, the Nikkei and EEM. Of these we continue to like the chart of EEM best, but the main point is actually the extremely wide performance gap between the SPX and other major stock markets. This is highly unusual.
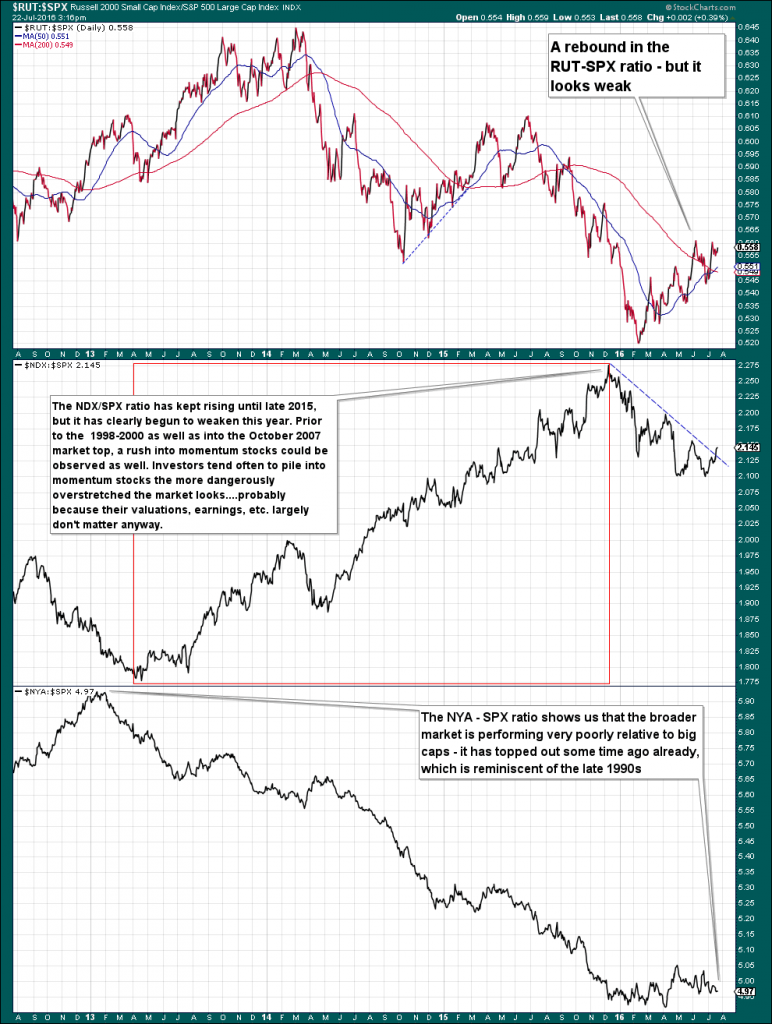
A comparison of different US stock market indexes doesn’t look much better actually. In this case we are using ratio charts, dividing RUT (small caps), NDX (big cap tech) and NYA (broad market) by the SPX: |
 About one month ago we read that risk parity and volatility targeting funds had record exposure to US equities. It seems unlikely that this has changed – what is likely though is that the exposure of CTAs has in the meantime increased as well, as the recent breakout in the SPX and the Dow Jones Industrial Average to new highs should be delivering the required technical signals. - Click to enlarge |
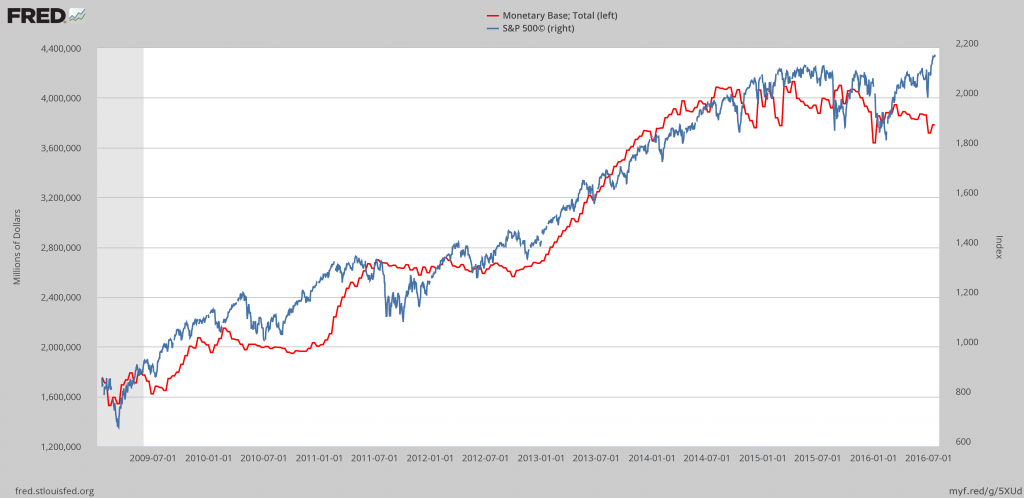
| Here is another chart we have shown before – this one compares the monetary base (which is largely driven by the level of excess reserves these days) to the SPX. The two data series have tracked each other very closely since the 2009 market low, but recently they have drifted apart rather noticeably. We don’t want to overstate the importance of this correlation – we actually think money supply growth is far more important – but it is worth noting that it is beginning to fray: |
 About one month ago we read that risk parity and volatility targeting funds had record exposure to US equities. It seems unlikely that this has changed – what is likely though is that the exposure of CTAs has in the meantime increased as well, as the recent breakout in the SPX and the Dow Jones Industrial Average to new highs should be delivering the required technical signals. - Click to enlarge |
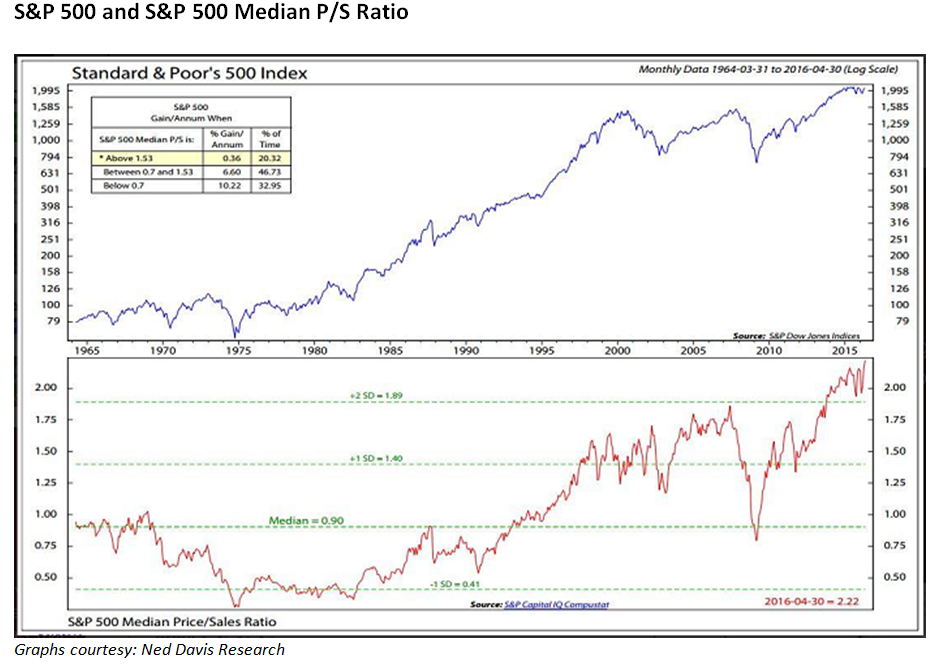
ConclusionMarket internals have strongly improved since the end of last year and the breakout in big-cap stocks after a lengthy sideways move has clearly increased the probability of a blow-off (we think it is still a very low probability, but it is definitely greater than previously). The current time period is in many ways unique, with the amount of outstanding negative yielding sovereign bonds recently rising to more than $13 trillion and numerous central banks pursuing extremely loose monetary policies. We believe this is an inherently very dangerous situation. It should be clear that this cannot really end well for bond markets – the unnatural negative interest rate environment is simply not sustainable. Bond buyers are essentially loading up on interest-free risk – and one of these days, this risk will materialize and leave them nursing vast losses. The strong showing of US big cap stock indexes and the recent strength in market internals meanwhile are contradicted by numerous negative divergences. Moreover, positioning data indicate that the rally has by now induced a great deal of complacency. Our conclusion from this is that the breakout is not really trustworthy and one should remain very cautious. The caveat to this is that a very similar backdrop was in evidence shortly before and during the final blow-off of the late 90s tech mania – incidentally also a time when the market was highly overvalued. Currently the US stock market is at one of its most overvalued levels in history – depending on the metric one uses (trailing P/E, Shiller P/E, Tobin’s Q, price/book, price/sales, etc.), it is either the third or second-most overvalued market ever. In terms of the median price-sales ratio it has in fact never been as overvalued as today. Of course, valuations don’t matter until they do – they are certainly not relevant for timing purposes. |
 About one month ago we read that risk parity and volatility targeting funds had record exposure to US equities. It seems unlikely that this has changed – what is likely though is that the exposure of CTAs has in the meantime increased as well, as the recent breakout in the SPX and the Dow Jones Industrial Average to new highs should be delivering the required technical signals. - Click to enlarge |
| The fact that the percentage of trades made by thinking humans has shrunk to a tiny fraction of total trading volume introduces an entirely new set of potential problems. We continue to believe that the increase in volatility since last summer represents a warning sign in this respect. The sharp decline in August 2015 was greatly exacerbated by the activities of funds employing quantitative strategies and we already know since May 2010 that the liquidity provided by high frequency traders can prove ephemeral when push comes to shove.
Lastly, the rationalization for buying into this overvalued market is probably one of the most ridiculous ones we have ever heard (similar to the “new era” myth of the late 1990s). It goes by the acronym “TINA”, meaning “there is no alternative”. Whoever has come up with this notion has the imagination of a plasmodial slime mold. There are always alternatives. |
 About one month ago we read that risk parity and volatility targeting funds had record exposure to US equities. It seems unlikely that this has changed – what is likely though is that the exposure of CTAs has in the meantime increased as well, as the recent breakout in the SPX and the Dow Jones Industrial Average to new highs should be delivering the required technical signals. - Click to enlarge |
Charts by: SentimenTrader, StockCharts, St. Louis Federal Reserve Research, Ned Davis
Full story here Are you the author?
Tags: Chart Update,Dow Jones Industrial Average,newslettersent,The Stock Market