Swiss Franc Currency IndexThe Swiss Franc continued its bad performance against the dollar index that started with Brexit until the middle of the week. From the mid of the week the two indices converged again, because the U.S. had two bad data releases:
|
|
Swiss Franc Currency Index (3 years)The Swiss Franc index is the trade-weighted currency performance (see the currency basket)On a three years interval, the Swiss Franc had a weak performance. The dollar index was far stronger. The dollar makes up 33% of the SNB portfolio and 25% of Swiss exports (incl. countries like China or Arab countries that use the dollar for exchanges). Contrary to popular believe, the CHF index gained only 1.73% in 2015. It lost 9.52% in 2014, when the dollar (and yuan) strongly improved.
|
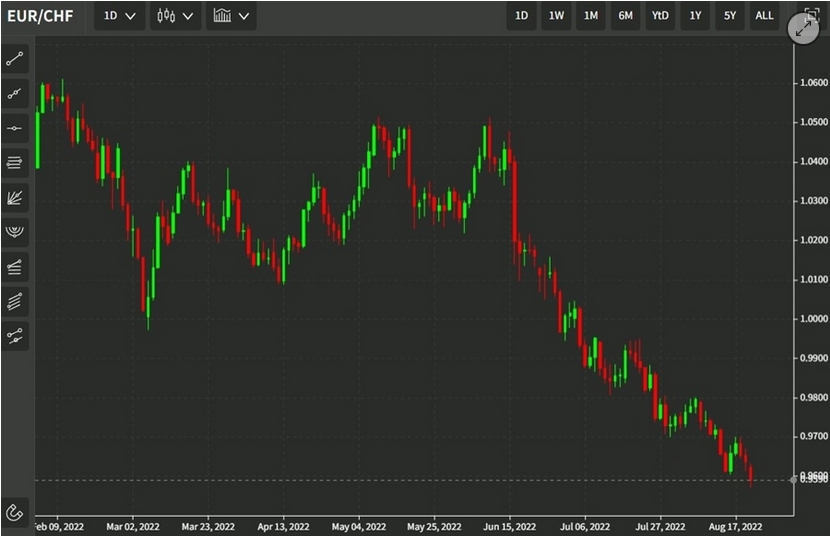
EUR/CHFThe Euro had a sudden rise at the in the mid of the week but after week U.S. data (Durable Goods Orders and U.S. GDP) it fell to levels under 1.0820.
|
FX Rates July 25 to July 29, 2016 |
US DollarThe US dollar advance was stopped in its tracks by the The FOMC statement earlier in the week did not leave the impression that a September hike was likely, and with the poor growth numbers, the odds were downgraded further. Now given the reduced contingent risk of a However, if you think that there is no chance of a September hike (doubts about the economic strength) or a November hike (too close to the election), then the odds of a December hike is still close to 60%. The Dollar Index had rallied from 93.00, the low from the day of the UK referendum to a high near 97.60 that it had tried several times over the past week or so to overcome.
The sell-off on the disappointing GDP news sent to near 95.30, which is a 50% retracement of the move and the lows after the June jobs data in early July. The next immediate target is 94.75, which corresponds to the 61.8% retracement and also the 50% retracement of the larger move that began in early-May from near 92.00.
Below there is 94.00, which is the 61.8% retracement of the bigger move and is near where a trendline drawn off the May and June lows intersects end the end of next week.
The technical condition has deteriorated. The five-day moving average will move below the 20-day average early next week for the first time in a month. The MACDs have turned down. A note of caution comes from the lower Bollinger Band, which the Dollar Index traded through after the GDP report, but managed to close inside it (~95.55).
|
FX Rates July 25 to July 29, 2016 |
EUR/USDThe euro had found bids near $1.0950 and with the downside momentum easing, the late shorts were vulnerable, and the short squeeze carried the euro to almost $1.12. The five-day moving average is set to cross above the 20-day average at the start of August. The MACDs are crossing higher, and the RSI is trending lower.
Like the Dollar Index, the euro is near its upper Bollinger Band (~$1.1160). Unlike the Dollar Index, it closed above the Bollinger Band, which may inject some caution at the start of the new week.
The $1.1170-$1.1180 houses the 38.2% retracement of the decline from the early-May high near $1.1615 and the 50% retracement of the fall since the UK referendum (that began close to $1.1430).
The next target is found in the $1.1230-$1.1260 band, where the 50% retracement of the bigger move and 61.8% of the smaller move are found. Support is seen near $1.1060.
|
|
USD/JPYThe dollar could not sustain even modest
upticks against the yen. The strength of the yen was a function of two disappointments: the US GDP and the failure of the BOJ to provide the kind of additional monetary support that is seen consistent with the deterioration of data (and likely stagnant economy in Q2) and the fiscal measures Abe teased the market with last week (details remain sketchy, and spending appears to account for only a quarter of the package). The five- and 20-day moving averages are poised to cross against the dollar at the start of the new week. The MACDs are turning lower, and the RSI is trending lower. Chart-based support is seen near JPY101.40, but it may not be particularly strong. There is scope for the dollar to return to the JPY100-JPY100.25 in the near-term. Initial resistance is pegged in the JPY102.70-JPY103.00 area.
|
|
GBP/USD
|
|
AUD/USDThe technical condition of the Australian
dollar had looked decidedly negative to us last week, but when it bounced off the $0.7420 area after the FOMC statement, the negativity was neutralized. Indeed the Australian dollar posted its highest weekly close in three months before the weekend. The Aussie was up a little more than half a percent on the week before the poor US GDP figures, after which it proceeded to rally about 1.3%.
The five-day moving average will most likely cross above the 20-day average over the next few sessions, perhaps even
ahead of the Reserve Bank of Australia meeting. The market is split on the outlook. We lean in favor of it on continued soft price pressures, slowing credit growth, and renewed strength of the currency, and the likelihood that the Federal Reserve is on hold at least until December. A rate cut may not discourage the Aussie bulls as interest rate differentials remain slanted in Australia’s favor. The next target is the $0.7650-$0.7680 area. Initial support is seen near $0.7550 and then $0.7500.
|
|
USD/CADThe Canadian dollar was the weakest of the
|
|
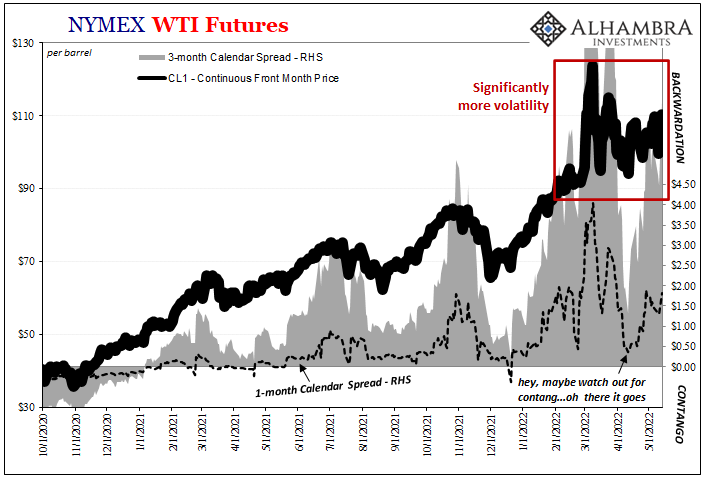
Crude OilThe broadly weaker US dollar managed to arrest the slide in oil prices. The dollar-driver appeared to offset the demand implications of continued below trend growth in the North America. In the month of July, oil collapsed 14.2%, which is the largest monthly fall since last July’s 20.8% plunge. Although US stocks are still at or near record levels for the season, the rig count is rising, and output is creeping
|
 Click to enlarge. Source Bloomberg.com |
US TreasuriesUS 10-year Treasury yields hit a record The drop in yields before the weekend (to ~1.45%) was clearly due to the disappointment with Q2 growth. A move back to the record low cannot be ruled out, especially if next week’s jobs data is at all disappointing. The September note future posted a outside up day before the weekend. The contract closed on its highs. A move above 133-10 next weekwill likely signal a test on the contract high of 134-07.
|
 Click to enlarge. Source Bloomberg.com |
S&P 500The S&P 500 edged to a new record high
|
Charts and CHF data added by George Dorgan and the snbchf team, Text Posted by Marc Chandler on Marc to Markets,
Are you the author? Previous post See more for Next postTags: Canadian Dollar,Crude Oil,Dollar Index,EUR/CHF,EUR/USD,FX Weekly Review,MACDs Moving Average,newslettersent,Safe-haven,Swiss Franc Index,U.S. Treasuries,USD/CHF,USD/JPY


