Pater Tenebrarum
My articles My siteAbout meMy videosMy books
Follow on:TwitterSeeking AlphaFacebook
The Cracks in the Economy’s Foundation Become Bigger

The Cracks in the Economy’s Foundation Become Bigger Last week the Bureau of Economic Analysis has updated its gross output data for US industries until the end of Q4 2015. Unfortunately these data are only available with a considerable lag, but th... - Click to enlarge
Last week the Bureau of Economic Analysis has updated its gross output data for US industries until the end of Q4 2015. Unfortunately these data are only available with a considerable lag, but they used to be published only once every few years in the past, so the current situation represents a significant improvement.
As Ned Piplovic summarizes in his update on the situation on Dr. Mark Skousen’s site:
“US economic activity continued to slow dramatically in the 4th quarter 2015, threatening recession. As a whole, the growth rate of the economy was anemic, almost flat, for 2015.
Gross output (GO), the new measure of total U. S. economic activity published by the Bureau of Economic Analysis, showed that spending throughout the economy declined slightly in the 4th quarter of 2015. And the Skousen B2B Index — a measure of business spending throughout the supply chain — has now fallen two quarters in a row. Both data suggest a mild business recession as we entered 2016.
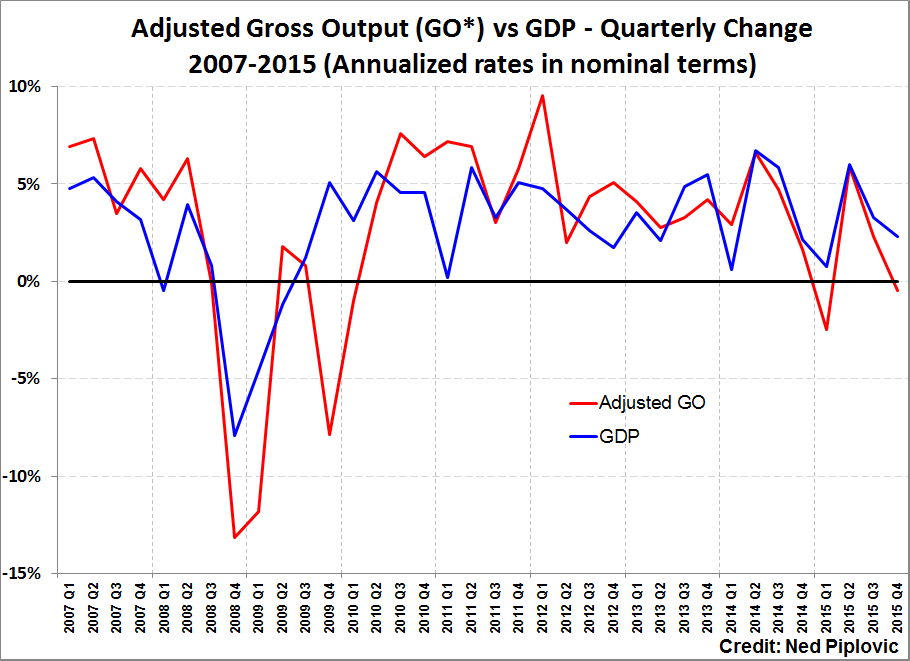
Based on data released today by the BEA and adjusted to include all sales throughout the production process, nominal GO fell 0.6% in the 4th quarter of 2015, compared to an increase in the 3rd quarter (+2.3%). Adjusted GO was $39.0 trillion in the 4th quarter, more than double the size of GDP ($18.2 trillion), which measures final output only. Nominal GDP actually rose 2.3% in the 4th quarter. When GO declines relatively to GDP, it’s usually a sign of recession.”
(emphasis added)
This is in keeping with the Fed district manufacturing surveys in Q4, and while it looked for a while as if things might be getting a little better in Q1 2016, there has been renewed deterioration in the meantime (see e.g. Mish’s recent updates on the Philly Fed, durable goods orders and services). Here is a chart of Dr. Skousen’s nominal adjusted gross output vs. GDP (quarterly annualized growth rates):
Adjusted Gross Output vs. GDPAdjusted nominal GO (red line) vs. GDP (black line), quarterly change rate annualized. |
 The Cracks in the Economy’s Foundation Become Bigger Last week the Bureau of Economic Analysis has updated its gross output data for US industries until the end of Q4 2015. Unfortunately these data are only available with a considerable lag, but th... - Click to enlarge |
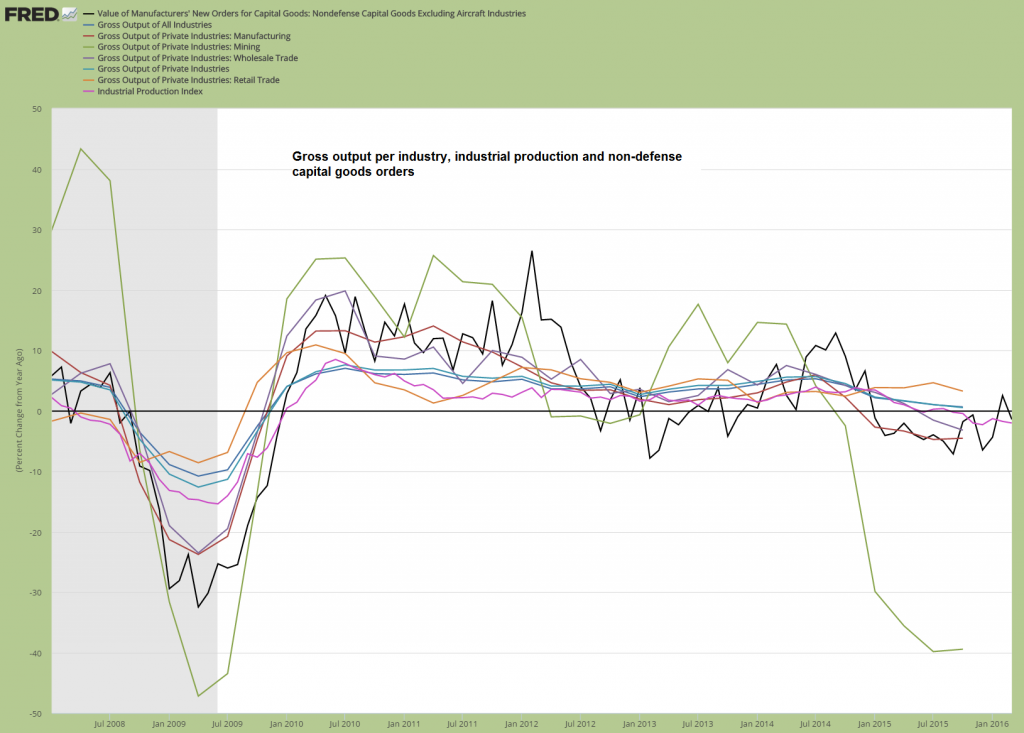
The next chart shows gross output data of selected industries compared to the industrial production index and non-defense capital goods orders (y/y change rates):
Gross output per industry, industrial production and non-defense capital goods orders.Annual change rates of: Gross output of all industries as well as manufacturing, mining, wholesale trade, private industries and the retail trade. Also included: the y/y change rate of the industrial production index (purple line) and the value of non-defense capital goods orders (black line). |
 The Cracks in the Economy’s Foundation Become Bigger Last week the Bureau of Economic Analysis has updated its gross output data for US industries until the end of Q4 2015. Unfortunately these data are only available with a considerable lag, but th... - Click to enlarge |
As can be seen, the slump in mining output has decelerated somewhat (it has shrunk by 39.45% in Q4, vs. 39.84% in Q3), but the decline in output has accelerated in manufacturing (minus 4.55% in Q4), the wholesale trade (minus 3.21%), while gross output of all industries combined has slowed from 1.00% to 0.63%, that of private industries from 1.03% to 0.52%, while retail trade output has slowed from 4.63% to 3.24%. These are obviously quite significant changes.
Readers may recall our recent article on the distortions in the economy’s capital structure due to the Fed’s heavy monetary pumping in recent years (see: US Economy – Ongoing Distortions for details). As we have mentioned on that occasion, while the growth in demand for consumer goods remains quite strong on a relative basis, investment has mainly been drawn toward the higher stages of the production structure (mining, oil drilling, capital goods production, erection of commercial buildings, etc.).
As you can see above, the growth in gross output of the retail trade (distribution of lower order goods) is far stronger than the growth in the output of industries that are active in the higher stages. And yet, more investment has been drawn toward these longer term processes. This disparity will inevitably be resolved by an economic bust at some point, as it won’t be possible to fund both relatively high current consumption and growing investment in the higher stages. Something will have to give.
We can also conclude from this disparity that capital maintenance in some industries (very likely in the intermediate stages) has begun to be neglected, and that current consumption is increasingly funded by capital consumption. Many of the accounting profits reported by companies in recent years are likely to turn out to be a mirage, as prices have been falsified by the ultra-easy monetary policy adopted by central banks.
It is possible that the bust is about to begin, but money supply growth remains relatively strong. The main question is whether this will suffice to keep the party going. This in turn depends mainly on the state of the economy’s pool of real savings, which is bound to worsen the longer the echo boom lasts. Unfortunately we cannot really “measure” the economy’s subsistence fund, so we have to approach the problem indirectly, by watching market prices and various data.
U.S Business Spending (Skousen B2B Index) vs. Consumer Spending, 2007-2015 (Nominal Value in $ Billions)Via Dr. Skousen: B2B spending plus gross private investment (excl. IP and residential property) vs. consumption spending – the trends between the two are beginning to diverge. |
 The Cracks in the Economy’s Foundation Become Bigger Last week the Bureau of Economic Analysis has updated its gross output data for US industries until the end of Q4 2015. Unfortunately these data are only available with a considerable lag, but th... - Click to enlarge |
Additional Data Points
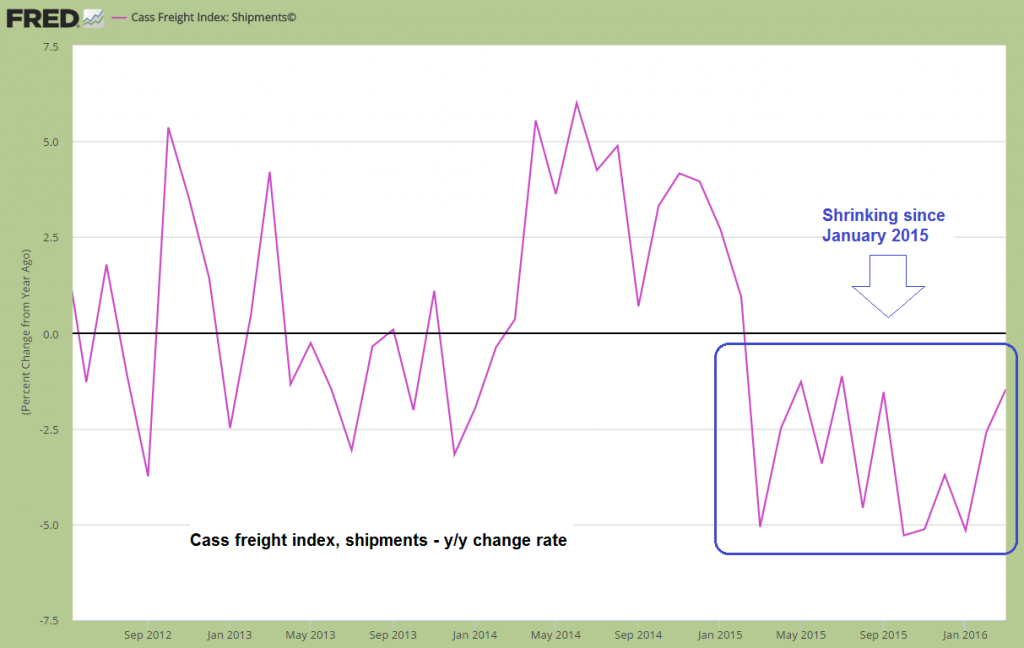
Here are a few additional data points we are keeping an eye on in this context. This is by no means a complete list, we are only showing a small selection. First of all, growth in the Cass freight index of shipments continues to wallow in negative territory, where it has been since early 2015. A recent improvement in the pace of the decline notwithstanding, this doesn’t look very good and confirms the message from gross output.
Cass freight index, shipments, y/y growth rate– negative since early 2015. |
 The Cracks in the Economy’s Foundation Become Bigger Last week the Bureau of Economic Analysis has updated its gross output data for US industries until the end of Q4 2015. Unfortunately these data are only available with a considerable lag, but th... - Click to enlarge |
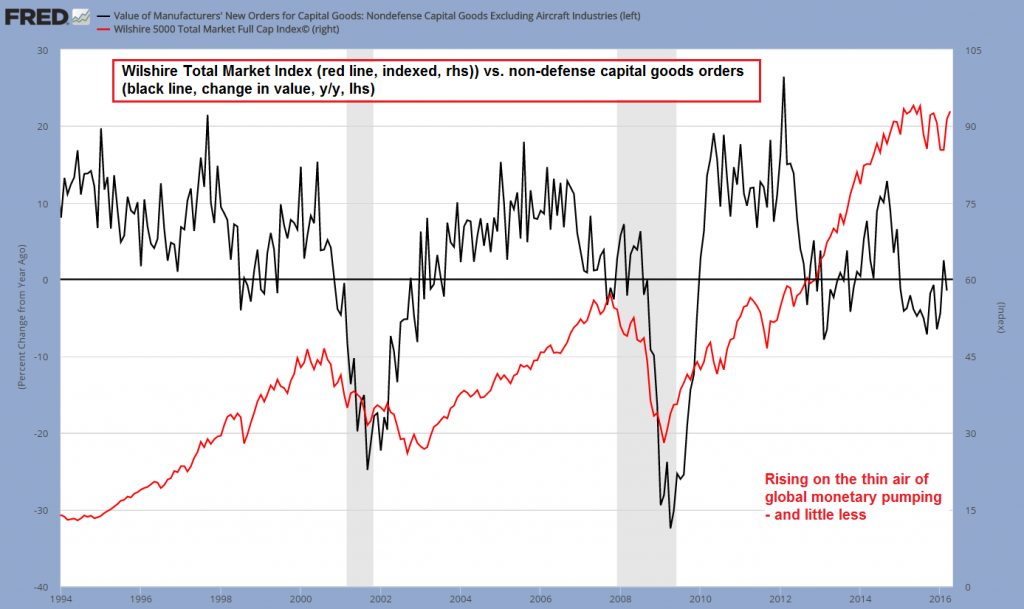
Next we want to show an update of our comparison chart of the Wilshire Total Market Index and the rate of change in the value of non-defense capital goods orders (h/t to Michael Pollaro for inspiring this comparison). As we have already pointed out on previous occasions, something rather strange has happened lately.
Normally such weakness in capital goods orders is not accompanied by stock market strength – although there are of course variable leads and lags. So either capital goods orders are about to vastly improve, or the stock market will have to adjust to a lower growth outlook. Currently this is of course offset to a very large degree by ongoing heavy monetary inflation around the world, which affects asset prices with a lag as well.
Note that when economic activity is subdued, there is more free liquidity available that can be deployed for investment in various assets such as stocks, bonds, gold, etc. However, which types of assets will actually benefit the most will depend on economic perceptions and inflation expectations. There is certainly no guarantee that the stock market will remain the major beneficiary of the flood of liquidity central banks have unleashed.
Wishhire Total Market Index vs. non-defense capital goods ordersThe Wilshire Total Market Index (red line) vs. the annual rate of change in the value of non-defense capital goods orders (black line). The disconnect continues – for now. |
 The Cracks in the Economy’s Foundation Become Bigger Last week the Bureau of Economic Analysis has updated its gross output data for US industries until the end of Q4 2015. Unfortunately these data are only available with a considerable lag, but th... - Click to enlarge |
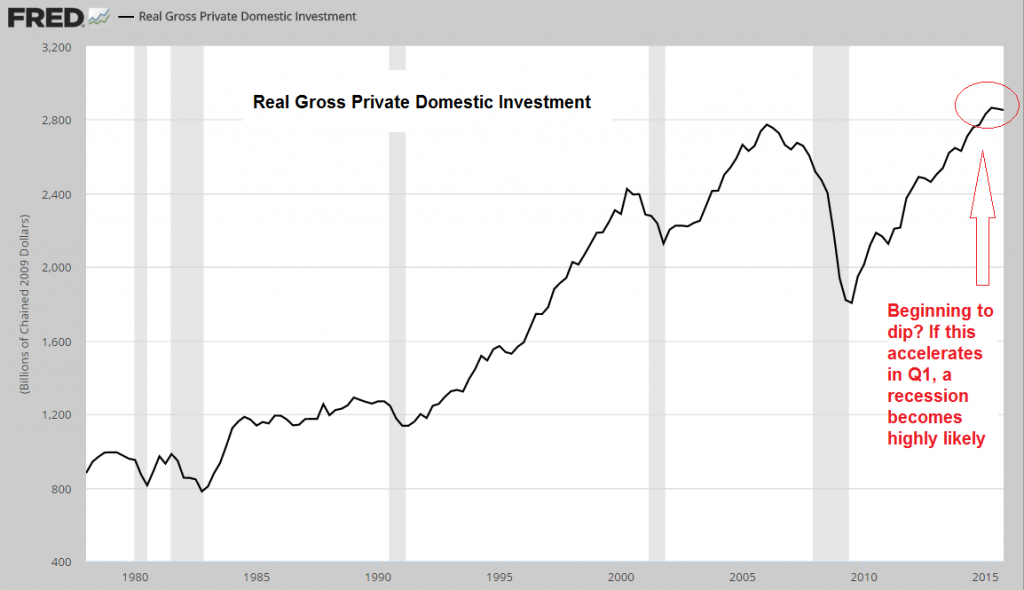
An important data point is also Real Gross Private Domestic Investment. As Steve Saville of the Speculative Investor newsletter has pointed out, it always turns down ahead of the beginning of officially designated recession periods. Recently there has been a dip, but it is probably not yet large enough to be called definitive – however, it is definitely a warning sign:
Real gross private domestic investmentbegins to dip – a steeper decline would be a strong recession warning. |
 The Cracks in the Economy’s Foundation Become Bigger Last week the Bureau of Economic Analysis has updated its gross output data for US industries until the end of Q4 2015. Unfortunately these data are only available with a considerable lag, but th... - Click to enlarge |
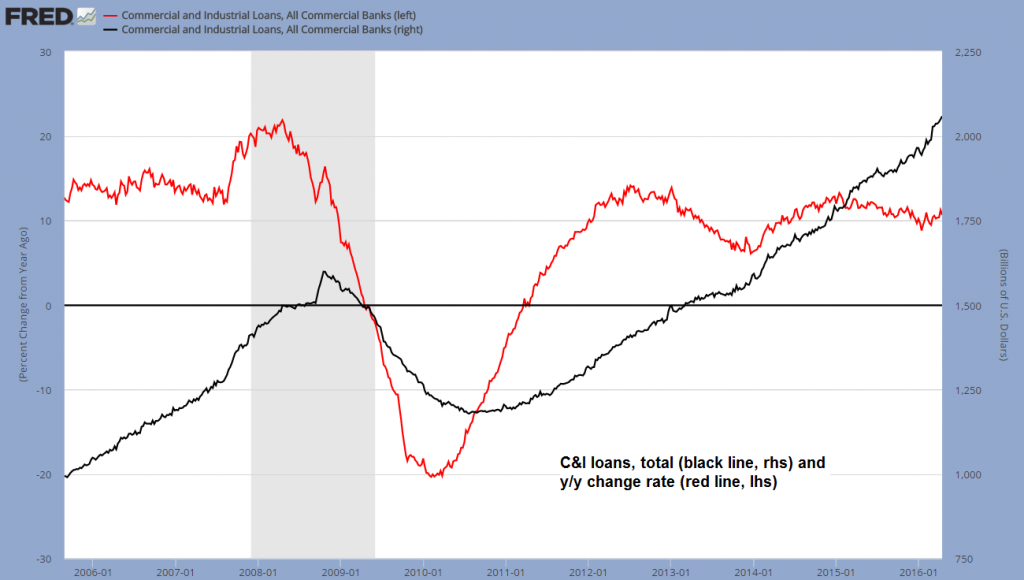
Next we are looking at a few business-related credit metrics. First industrial and commercial loans and their annual growth rate – which remains surprisingly robust, although it is actually weakening relative to the earlier phase of the post-crisis recovery.
C&I loans, total and the y/y change rateC&I loans total (black line) and the y/y growth rate (red line) – growth in commercial bank lending remains robust, but is a far cry from what has been seen in previous booms. It is also weakening relative to the earlier phase of the Bernanke echo boom. |
 The Cracks in the Economy’s Foundation Become Bigger Last week the Bureau of Economic Analysis has updated its gross output data for US industries until the end of Q4 2015. Unfortunately these data are only available with a considerable lag, but th... - Click to enlarge |
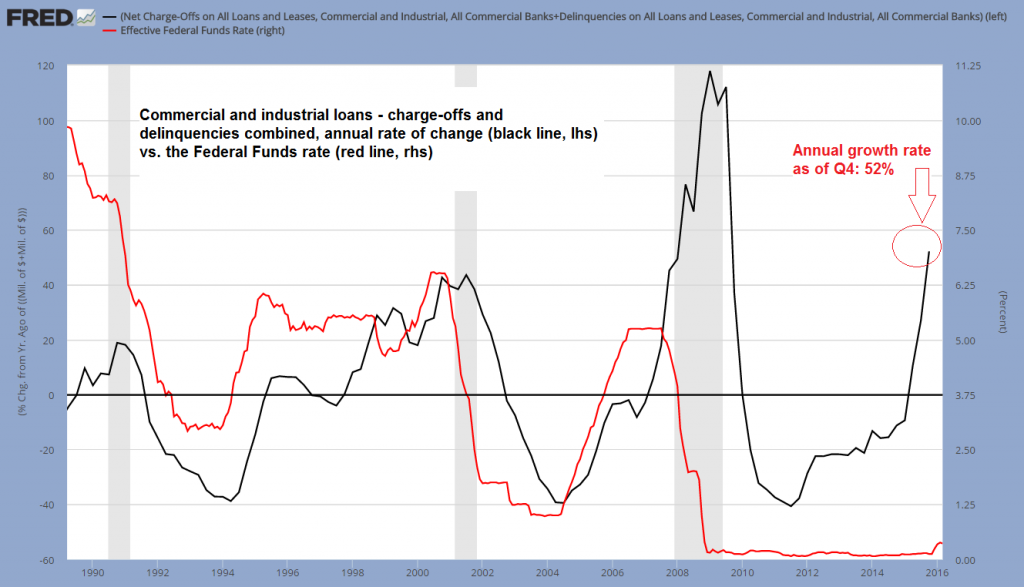
The next chart is a reminder of why this growth rate is “surprising” at this stage – it shows the annualized quarterly growth rate of the sum of charge-offs and delinquencies of commercial loans:
Commercial and industrial loans – charge-offs and delinquencies combined, annual rate of change vs. Federal Funds rate.As of Q4, y/y growth (quarterly) in combined charge-offs and delinquencies of C&I loans stood at 52%. Normally this only happens when the Fed actually tightens policy, not when it keeps rates close to zero (of course, the end of “QE” represents a significant tightening as well). |
 The Cracks in the Economy’s Foundation Become Bigger Last week the Bureau of Economic Analysis has updated its gross output data for US industries until the end of Q4 2015. Unfortunately these data are only available with a considerable lag, but th... - Click to enlarge |
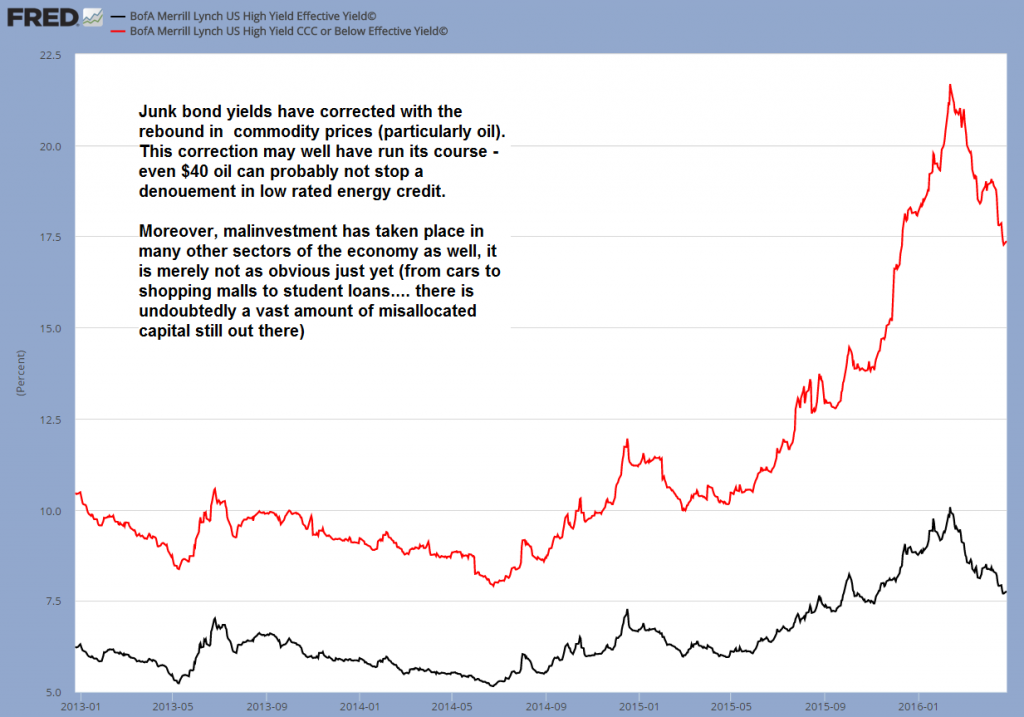
Lastly, here is a chart of junk bond yields – junk bonds have recovered strongly in concert with stocks and commodity prices. This seems to have been driven by further easing measures adopted by the ECB and BoJ, as well as the Fed’s decision to tone down its previously slightly hawkish bias. Not to forget, narrow money supply growth in China has “gone off the charts” in recent months as well (more on this in an upcoming update on commodities).
Junk bond yieldshave corrected (the red line shows yields on bonds rated CCC and below, the black line the effective yield on the Merrill Lynch/BofA Master II High Yield Index). This correction in yields could soon give way to another surge if the economy continues to weaken. |
 The Cracks in the Economy’s Foundation Become Bigger Last week the Bureau of Economic Analysis has updated its gross output data for US industries until the end of Q4 2015. Unfortunately these data are only available with a considerable lag, but th... - Click to enlarge |
Conclusion

The Cracks in the Economy’s Foundation Become Bigger Last week the Bureau of Economic Analysis has updated its gross output data for US industries until the end of Q4 2015. Unfortunately these data are only available with a considerable lag, but th... - Click to enlarge
As has been the case previously, we do not yet see decisive economic weakness – in short, we believe it is still too early to call for a recession. However, it is undeniable that the economy remains under pressure. Gross output is twice as large as GDP, which demonstrates how important this datum is if one wants to assess where the economy is going. Manufacturing remains in fact the biggest sector of the US economy in terms of total spending.
We see numerous signs that the economy continues to deteriorate and it has to be assumed that it is mainly the historically still strong level of money supply growth that keeps the echo boom muddling along. However, the longer this lasts, the greater the economic distortions that will have to be corrected will become. Investors buying into the stock market at valuation levels (trailing P/E of 25) close to those seen at previous major market peaks will need a lot of things to go right to come out ahead.
Charts by: St. Louis Federal Reserve Research, Ned Piplovic
Full story here Are you the author?
Tags: Chart Update,newslettersent,On Economy