


Read More »


 On Swiss National Bank Main SNB Background Info


 Ukraine and the Next Wave of Inflation, Part II, Can Russia Enact a Gold Standard?
13 Mar 2022
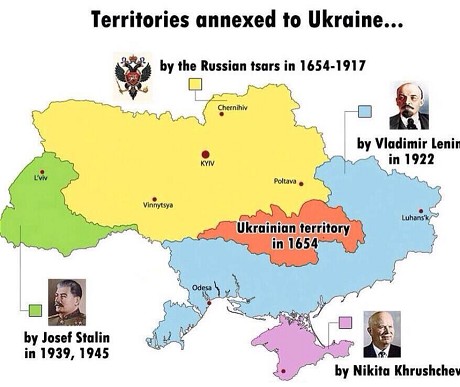 Mapping the Conflict in the Ukraine
12 Mar 2022
 What’s In Your Loan?
29 Nov 2021
17 Aug 2021
 Post-Covid China
5 Jul 2021
 COVID in India
26 May 2021
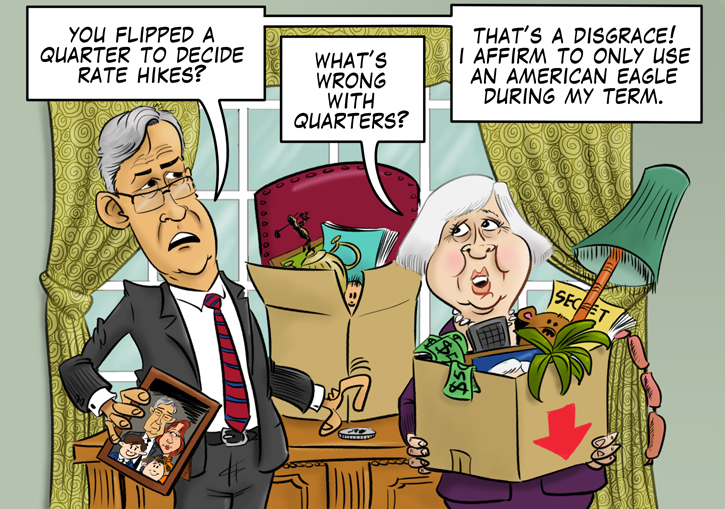
 Did You Make Janet Yellen Rich?
8 Feb 2021
 Grantham’s ‘Real McCoy’ Bubble in a World Gone Mad
21 Dec 2020
 Janet Yellen: Too Dumb To Stop
10 Dec 2020
 What You Will Find When You Follow the Money
17 Aug 2020
 The Dollar Is Dying
11 Aug 2020
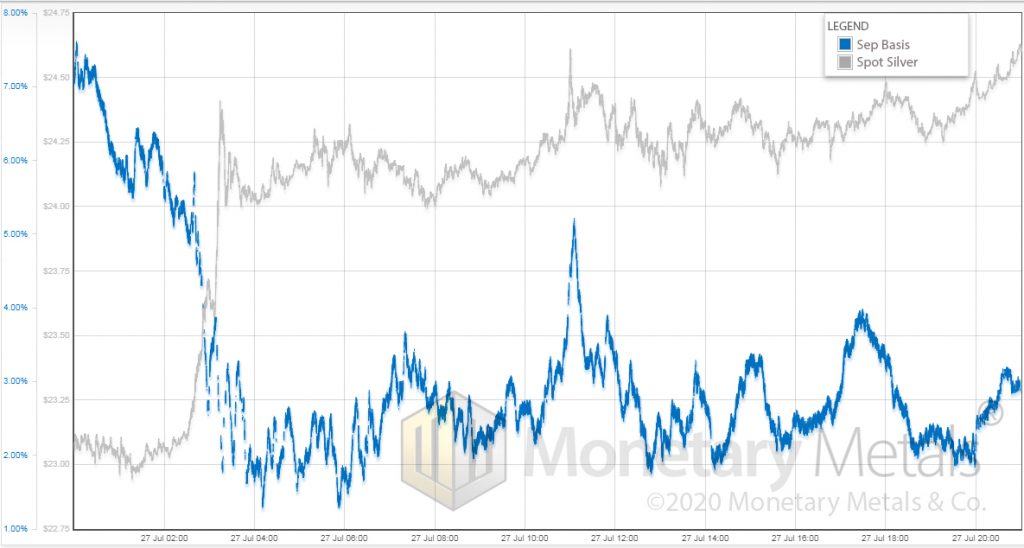 Silver “Scarcifies” – Precious Metals Supply and Demand
31 Jul 2020
 Game Over Spending
13 Jul 2020
 An Excellent Seasonal Buying Opportunity in Silver Lies Directly Ahead
29 Jun 2020
 The Decline of the Third World
24 Jun 2020
 US Money Supply – The Pandemic Moonshot
16 Jun 2020
 In Gold We Trust, 2020 – The Dawning of a Golden Decade
3 Jun 2020
 Gold Stocks – A Show of Strength
17 Apr 2020
 The Secret to Fun and Easy Stock Market Riches
18 Feb 2020
 A Pharmaceutical Stock That Is Often Particularly Strong At This Time Of The Year
15 Feb 2020
