Nevada is, by all accounts and accountants, in rough shape. Very rough shape. An economy overly dependent upon a single industry, tourism, in this case, is a disaster waiting to happen should anything happen to that industry. Pandemic restrictions, for instance.
Nevadans cannot afford the government spending they “have” without a gaming industry attracting visitors at full throttle. Desperate, the state’s governor Steve Sisolak announced last week that officials would explore setting up highly innovative, and what will be very controversial, “innovation zones” within their borders to specifically attract other types of businesses; the pandemic panic seems likely to stick around for a while.
The controversy stems not from the general idea of incentivizing successful firms to relocate and increase one’s tax base; rather, it is how Nevada proposes to structure these incentives. Typically, what’s offered are tax abatements, public-funded infrastructure, and the like. Can’t do that, Sisolak admitted, the state has no money, so the innovation zones will be created as potential counties unto themselves.
Yeah.
Corporations will be, essentially, free to set up their own local government structures (within established guidelines, the governor claims). Invitation for a CEO to take on the role of also Sheriff, tax collector, and school board? Frightening, undoubtedly, but that’s not really my issue (here).
In order to qualify for the corporate state-within-a-state setup, any corporation must be doing business in some specified “high tech” capacity and then pledge an immediate $250 million to invest in its newly documented legal domain, plus a solid pledge for a further $1 billion over the next ten years.
Who has $250 million? Which firms can be reasonably assured of the next billion?
| Blank-check SPAC’s fronted by instragram influencers and celebrities or financially-secure junk bond floaters, sure, but Mom and Pop tech businesses aren’t afforded any chance near this “opportunity.” Had this been literally 1984 (OK, more like 1974), Steve Jobs wouldn’t get through the initial screening.
We’re left with the idea – and this isn’t specific to Sisolak’s Hail Mary plan – that big business is the place to go. The best perhaps exclusive way to generate or regenerate a tax base is to steal huge companies from other places. While some municipalities pay minor attention to “incubation” zones seeking to nuzzle the small, the wider world, including the politicians blindly operating within it, is made to think big and only big. This can be, and likely has been, short-sighted. While the invisible hand of capitalism has been hotly debated ever since Adam Smith, there is a wealth of data showing that background, supply-side wealth for any economic system begins small – and then becomes big. Economic potential, therefore, derived from the transition. These kinds of firms were once called “gazelles” in a paper written back in the mid-nineties by economists David Birch and James Medoff – just as all sorts of at formerly garage-based technology innovators were hitting it huge. I wrote about these many years ago:
|
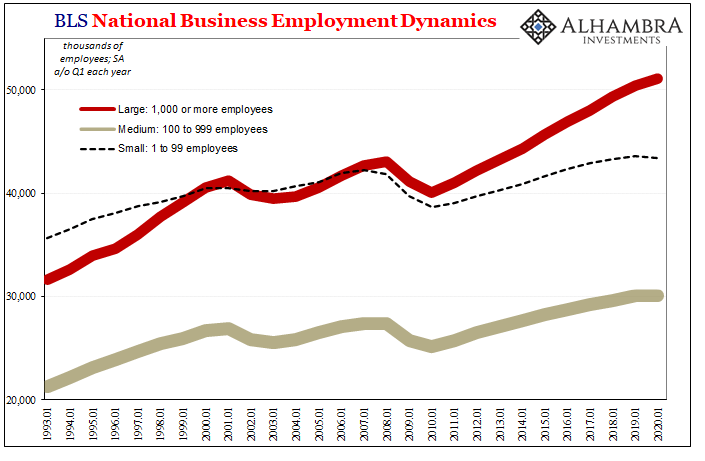
BLS National Business Employment Dynamics, 1993-2020 |
| If this is so, what would happen should, say, the financial system begin favoring only larger businesses because the liquidity risks associated with lending to smaller firms was perceived to have become too high? This is a trend observed throughout history during periods of depression and tight money (same thing); those who have it come to favor only the most liquid credits at the expense of risk-taking which would otherwise propel opportunistic investment to look deeper into, and take more seriously, the goings-on inside the prospective innovator’s garage.
Tight money instead what it is, forget taking a shot at the next Bill Gates because there’s another huge offering from Microsoft paying 15 bps over UST’s; or, if you really want to go after it during times like these, a mid-tier big cap issuing a bond at 75 bps spread! How might we know this has been the case? On the financial side it’s easy: low interest rates. The interest rate fallacy and even the falling interest costs for junk bonds, together these are definitive signs of the tight money conundrum (which I’ve covered in historical detail before, and so won’t go into it again here). We know that part has been true, but can we find evidence for its deeper economic consequences? Has the herd of potential gazelles been thinned too much by the hungry predators of post-2008 systemic illiquidity? Data is, as you might imagine, difficult to come by. For one thing, who has stats on small companies that rapidly advance through the mid-sized ranks to have then transformed themselves into the newest large firms? Well, the BLS does – kind of. Going back to the early nineties, the BLS has kept track of private employment, at least, breaking down payrolls by size of firm. This gives us a rough, very rough, idea of general conditions and more importantly trends within each segment. What we might expect to find is that, around 2008, small businesses, in particular, it hasn’t gone so well for them at least relative to the other classes. |
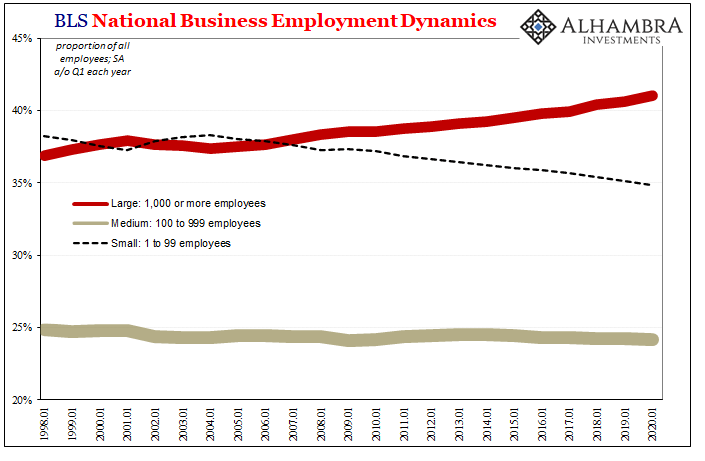
BLS National Business Employment Dynamics, 1998-2020 |
| Sure enough, the BLS’s National Employment Dynamics Data backs up this idea. We already know that job growth overall since the Great “Recession” began has been the worst since the 1930’s; not even a recovery. At the bottom end of it has been the smallest businesses.
According to this set of figures, big businesses have gained the most permanent employees over the last tense dozen years, beginning with the fact that during the 2008-09 contraction small firms had accounted for 47.8% of net job losses despite starting out the Great “Recession” in 2007 with only 37.6% of all employees. Liquidity favored the largest during the most acute illiquidity action. Since, small businesses have struggled while larger businesses, while not exactly thriving, they’ve performed comparatively better (middle-sized firm have basically stayed the same). |
Productivity Supply Side Potential, 1949-2019 |
| And this seems to have repeated since 2020 (the quarterly data only goes up through Q2 2020): the largest businesses, who up to last year had jumped to employ 41% of all employees, these had only made up 35% of last year’s first half job losses; the smallest firms, just 35% of all employees, represented 40% of all job losses to that same point.
The last two quarters of last year are almost certainly to have been more extreme divergences between the labor capacities at opposite ends of the size (liquidity) spectrum; some jobs came back to the large firms who easily drew down bank revolvers or issued more bonds to a Powell-calmed corporate bond market, while small businesses further drowned without any credit lifeline including the Fed’s ridiculously mismanaged, largely unused “Main Street” loan rescue. This sets up for much more of the same; not only might it have been smaller firms unable to source funds to grow or stick around, some of the possible gazelles never able to secure their own finances have surely been gobbled up by larger firms with mountains of potential credit seeking to fund their every whim no matter how extreme-valued.
Combined, the lack of growth opportunity along with the temptation to strike-it-rich and sell out likely, in my view, accounts for the count of employees among the smallest firms almost unchanged for the last twelve years of background systemic illiquidity (thus, why small firm employment didn’t grow, large firm employment grows relatively bigger, and mid-sized employment stayed proportionally the same). The data presented here is, obviously, far from conclusive; though it does fit very well with other sets, including the productivity numbers put out by the BLS (using some BEA-collected inputs from GDP). The latter has likewise shown the same period with “puzzlingly” low levels of productivity therefore lacking the sort of supply-side spring you’d otherwise have expected from a healthy herd of gazelles easily able to have tapped into enterprising rather than overly-cautious lenders. |
Productivity Supply Side Potential, 1988-2020 |
| On the contrary, the BLS illustrates how the only substantial productivity growth since 2007 has twice come from exclusively mass layoffs across the entire economic spectrum (though, again, disproportionately affecting smaller firms).
The possibilities presented here are what make the interest rate fallacy so dangerous; the hidden costs are, essentially, counterfactuals. We know what didn’t happen, actual, legitimate recovery, but to show to the public why we have to start by first explaining that everything its members have been taught about something so basic as interest rates is entirely wrong. You can’t even get that far with the current edition of the Economics textbook. Deflationary tendencies are not strictly measurable by interest rates alone. Though more difficult to illuminate, the very real costs of Keynes’ greater evil is as much the destruction you don’t see; what robs the animals of their animal spirits. QE didn’t create a credit bubble at all; it merely further reinforced the wrong ideas about when, where, and how deeper fundamentals might actually fit together (which is one key reason why central bankers are always, always so confused). The fact that it never actually works just makes life for the gazelles we’ll never get to appreciate even worse out there on the increasingly bare monetary plain. And that was before 2020. Given this and now how the world begins 2021, the idea of some sustained inflationary breakout from here is instead the substance of only what comes out of every gazelle’s opposite end. |
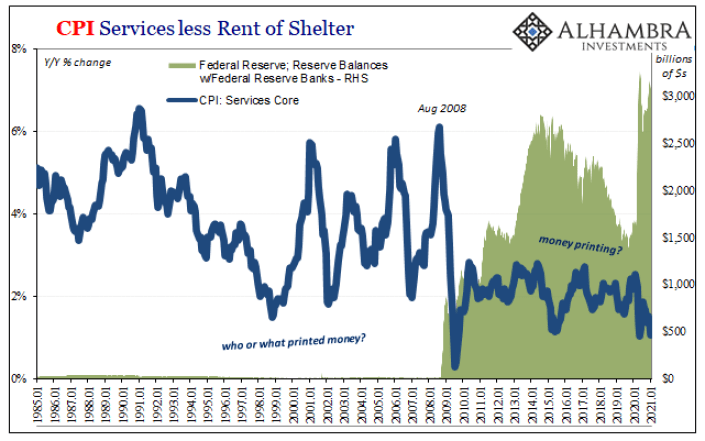
CPI Services less Rent of Shelter, 1985-2021 |
Tags: Bill Gates,currencies,Deflation,dollar,economy,eurodollar system,Featured,Federal Reserve/Monetary Policy,global dollar shortage,inflation,Labor Market,Markets,newsletter,productivity,QE,Supply-Side


