


Lance Roberts
My articles My offerMy siteAbout meMy videosMy books
Follow on:TwitterSeeking AlphaFacebookAmazon
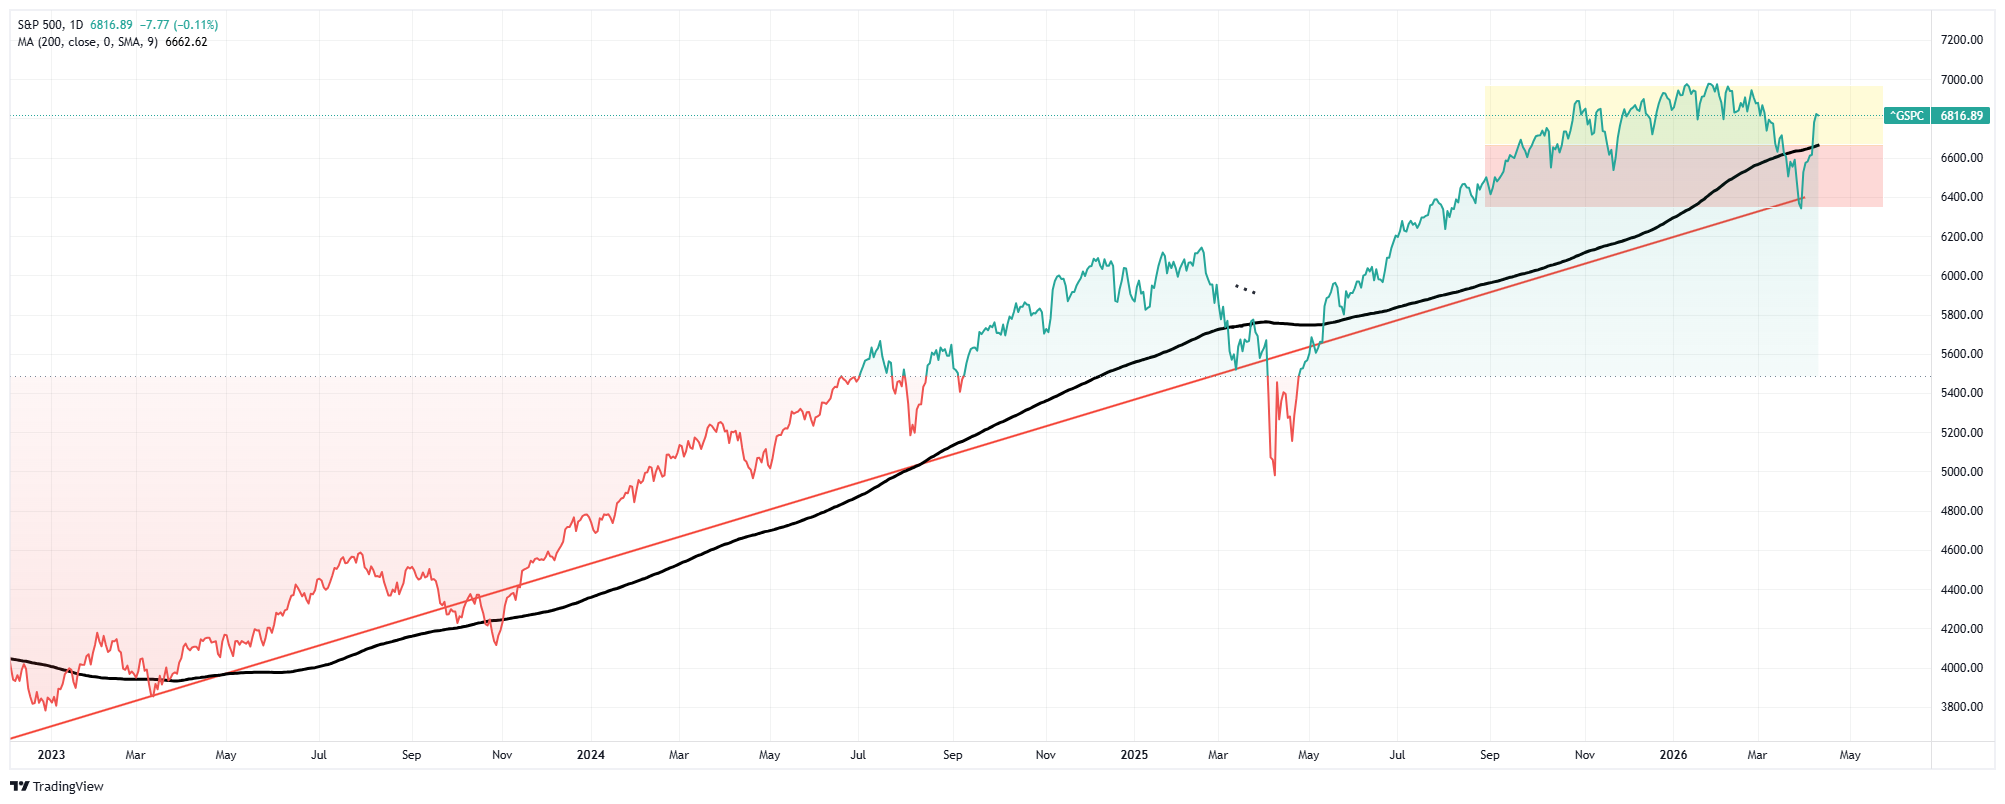
Over the last few weeks, we have published real-time market commentary as the correction proceeded. The goal was to help investors navigate the more dire outcomes promoted on social media. A largely unexpected outcome was that the S&P 500 outlook changed dramatically in a matter of days. After five consecutive weeks of decline driven by the Iran conflict, surging oil prices, and a Federal Reserve frozen between inflation and growth, we suggested a rally was likely. That rally came hard with an 8.2% surge from its March lows near 6,300. Furthermore, that rally reclaimed its 20-, 50-, and 200-day moving averages in rapid succession. As of Friday's close at 6,816.89, the S&P 500 sits just 2.6% below January's all-time high of 7,002. That's a recovery that demands explanation, honest evaluation, and a clear-eyed view of what comes next.

So, let's start with a review of how we got here. In our 200-DMA breakdown analysis, we noted that the combination of a still-rising 200-day average, an RSI in the low 30s, and AAII bearish sentiment above 52% historically produces a reflexive rally, even when the longer-term outcome remains uncertain. We also wrote clearly that the goal isn't to go to cash. It's to reduce the cost of being wrong while staying positioned for the recovery when it arrives.
That framing matters now more than ever, because the S&P 500 outlook from here is genuinely two-sided.
Sentiment & Technicals Led The Way
The setup that preceded this rally was not ambiguous. Sentiment reached levels of fear historically inconsistent with continued selling pressure, as shown in the table below.
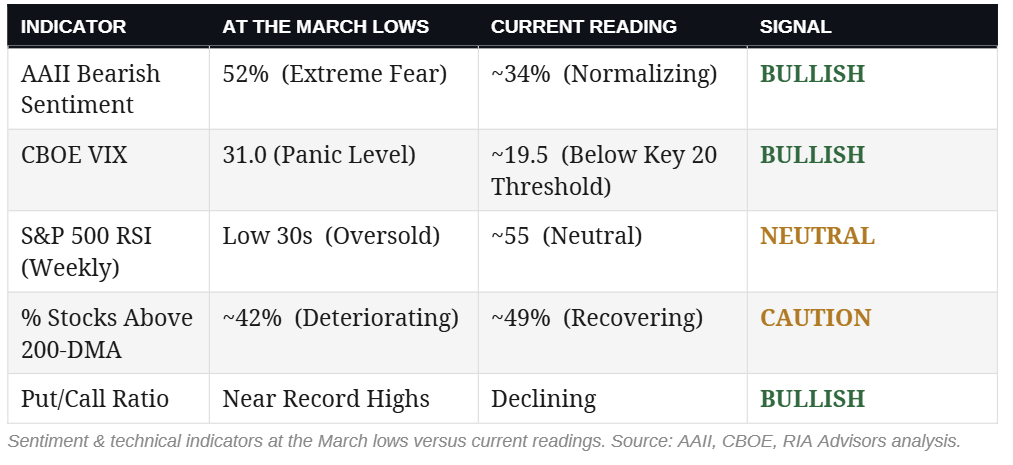
Three data points stand out. AAII bearish sentiment peaked above 52%, well past the 45% threshold we flag as a meaningful contrarian signal. The VIX hit 31, a reading that, in comparable historical setups, consistently preceded near-term reversals. Furthermore, put option volume approached record levels during the final week of the selloff. Fear of that magnitude is the fuel for a rally when markets are deeply oversold. All that is needed is a "catalyst" to ignite that fuel. That "match" came in the form of a ceasefire announcement.
The VIX collapsing back to 19.5 and crossing below the 20 level we identified weeks ago as a necessary condition for any recovery was the single most important technical event of the week. For the first time in this entire correction, both required conditions were simultaneously met: oil pulled back, and the VIX fell below 20. That combination transformed a reflexive bounce into something worth taking seriously when evaluating the S&P 500 outlook.
Most notably, we warned previously that not all 200-DMA breaks are created equal. Our prior analysis stressed the critical distinction between a rising and a declining 200-day average at the point of the break.
"The structural difference is what matters most. In every brief break, the 200-dma was still rising or flat when the price crossed below it. The long-term trend hadn’t broken as a sentiment shock had temporarily pushed the price below an intact baseline. Fear was already extreme at the moment of the break, which meant the contrarian setup was already in place. As shown, the 200-DMA is still rising, and the long-term trend remains intact."
Historical data makes the difference stark, and when the break below the 200-DMA is less than 4 weeks, as was the case with the recent reversal, forward returns improve sharply.
"The numbers from those five events stand in stark contrast to the sustained breaks. Average 12-month return: +19.8%. The 2012 fiscal cliff break recovered so fast that the market returned over 28% over the following year. The October 2023 break reclaimed the 200-dma within weeks and ran +27.0% over 12 months. Crucially, once you get past the first month, every single brief whipsaw event posted positive returns at 3, 6, 9, and 12 months. The hit rate is 100% for investors who didn’t panic-sell on those breaks. For those who did, it was among the most expensive decisions made in those market cycles."
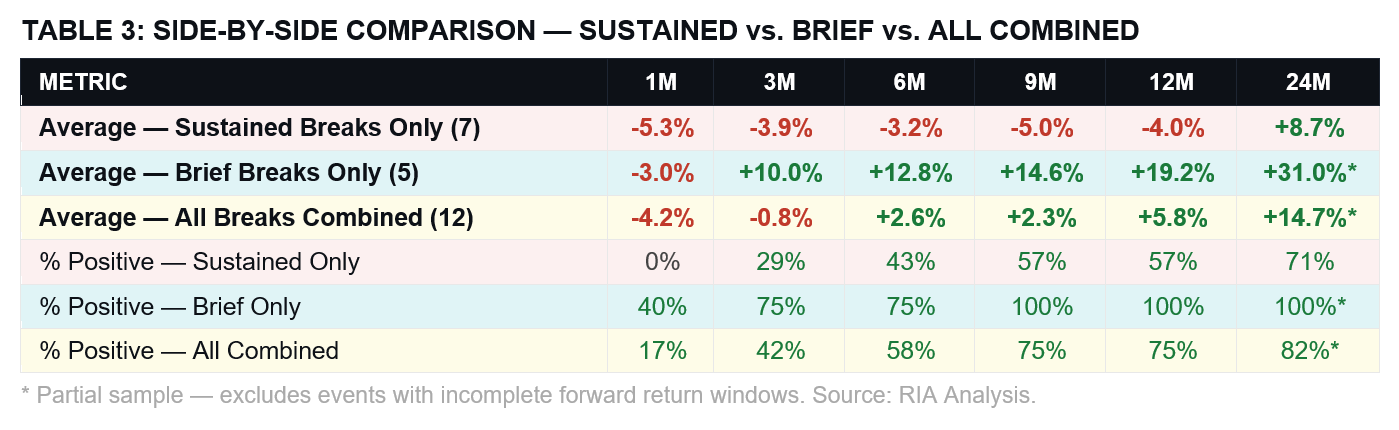
The 2026 episode lines up with the more constructive historical analog, not the destructive one. That said, Q4 2018 and 2015 both produced sharp initial recoveries before finding a lower low, so there IS risk worth considering. Therefore, while the S&P 500 outlook remains constructive over the next 12 months, we remain tactically uncertain in the near term.

So, what is our outlook from here?

Bull Vs. Bear: Evaluating The S&P 500 Outlook From Here
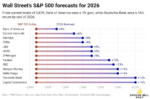
While social media loves to promote the most "bearish" of possible outcomes, as investors, we need intellectual honesty to evaluate potential market outcomes. Wall Street's most prominent strategists are split in ways we haven't seen in years, not on direction, but on timing and durability. The table below frames the debate, and the analysis that follows explains why each side deserves serious weight.
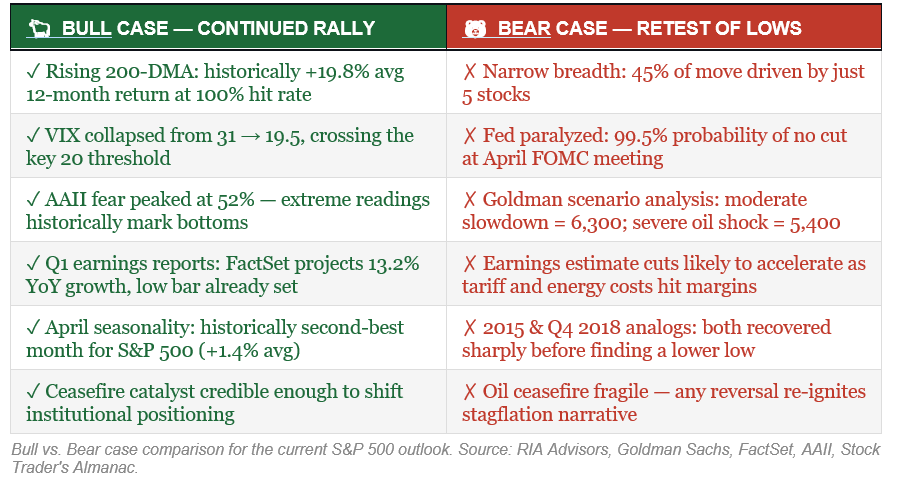
The Bull Case
The bull case for the S&P 500 outlook is not a "hope" case; it is more of a base case. As noted above, when the 200-day moving average is still rising at the time of a price break, every comparable episode since 2000 has produced positive returns at the 3-, 6-, 9-, and 12-month marks. We can't ignore those statistics just because something is popular on social media. The rising 200-DMA indicates the long-term trend remains intact. The break was a sentiment event, not a structural break. And sentiment events eventually resolve.
Goldman Sachs makes this case by maintaining its 7,600-year-end S&P 500 target throughout the March correction. That target remained anchored by projected earnings of $309 per share in 2026 and $342 in 2027. Goldman's strategists describe the current phase as a "marathon broadening," a shift from narrow, mega-cap tech leadership toward cyclicals and industrials that have lagged for two years. Their argument is that 12% earnings-per-share growth creates a "fundamental floor" that limits downside even in a choppy macro environment.
"The bull market is maturing, not ending. The 7,600 year-end target for the S&P 500 is a vote of confidence in the underlying health of Corporate America. With 12% earnings growth acting as a safety net, the transition from a narrow, tech-led rally to a broad-based recovery offers a more sustainable path forward." — Goldman Sachs Equity Strategy, April 2026
The Q1 earnings reports also support the bullish case as analysts trimmed Q1 EPS estimates during the quarter. With the bar reset lower than it appears on the surface, it sets up the classic beat-and-raise scenario if corporate America can simply maintain its recent pace. FactSet projects 13.2% year-over-year earnings growth, and Barclays bumped its full-year 2026 EPS forecast to $321. In prior market cycles, that kind of low-bar, high-beat dynamic in early earnings reports has been the ignition source for the next leg higher. Add April's historically strong seasonal tailwinds, the second-best month for the S&P 500 at +1.4% on average, and the short-term setup tilts constructive.
The Bear Case
Don't worry, I didn't forget about the bear case, but that case doesn't require a catastrophe. It only requires that the current rally's foundation is narrower and more fragile than price action suggests, and the evidence for that is hard to dismiss. Roughly 45% of the 8.2% move from the lows was driven by just five stocks. Furthermore, the percentage of S&P 500 members trading above their 200-day moving average sits near 49%, recovering, but not convincingly so. In every durable market recovery since 2000, breadth expanded meaningfully within the first two weeks of the move. That hasn't happened here.
JPMorgan's Dubravko Lakos-Bujas cut his year-end S&P 500 target from 7,500 to 7,200 in mid-March, and his near-term warning is more sobering than the revised target implies. He noted that oil-equity correlations turn increasingly negative after a 30% spike in crude, precisely the level we reached during the conflict's peak. His base case sees the index potentially sliding to 6,000 to 6,200 before recovering if recession risks gain traction, with the 6,600 technical level offering only thin support. The bear case here isn't that the economy collapses, it's that the damage accumulates slowly enough that investors don't see it until earnings guidance forces the reckoning.
"Markets are underestimating the risks from the Middle East conflict, surging oil prices, and investor complacency. Investors have been mostly hedging rather than de-risking, with gross leverage still near highs. This is a high-risk assumption given that S&P 500 and oil correlations typically turn increasingly more negative after a 30% oil spike." — Dubravko Lakos-Bujas, JPMorgan Head of Global Markets Strategy, March 2026
The macro overlay compounds the concern. The Federal Reserve is effectively paralyzed. According to CME FedWatch, there is a 99.5% probability of no rate change at the April meeting, and markets have priced out cuts for most of 2026. The 10-year Treasury sits near 4.32%, and CTA positioning in Treasuries remains near maximum short. Any oil-related inflation surprise could push yields higher, tightening financial conditions at exactly the moment corporate guidance most needs a policy backstop.
Bank of America's Michael Hartnett put it plainly: He wants to see a "buyable washout" with stronger capitulation, preferring entry points below 6,600 rather than chasing the current recovery. The history of comparable setups, specifically Q4 2018 and the 2015 correction, suggests the market often finds a lower low before the durable recovery takes hold. That doesn't mean the ultimate destination changes. It means the path is rarely as clean as the initial bounce makes it appear.
"Investors should not mistake a relief rally for a resolution. The conditions for a durable bottom include breadth expansion, Fed flexibility, and evidence that earnings estimates are bottoming — not just one of those three." — RIA Advisors, April 2026.

Where We Go From Here
After weighing both sides of the debate honestly, my view is that the most probable S&P 500 outlook for the next four to six weeks is neither a straight-line continuation to all-time highs nor an immediate collapse back to the March lows. What's more likely is a period of volatile consolidation inside a well-defined range. Particularly, as the market migrates from one headline or policy-driven event to the next. Resolution will ultimately depend on a single question that only corporate earnings reports can answer:
"Are forward earnings estimates still intact, or has the macro damage from oil, tariffs, and a paralyzed Fed already started eating into the numbers that justify current valuations?"
That question matters more than it normally would as the market rally was a function of relief, not confirmation. The Iran ceasefire removed a headline risk, and the oversold sentiment condition provided the fuel. However, neither of those forces changes the underlying earnings math that ultimately determines where this market belongs. Goldman Sachs has the S&P 500 priced for $309 per share in earnings this year. If that number is right, a 7,600 year-end target is defensible. But with energy costs, tariff friction, and consumer softness already compressing margins in ways analysts haven't yet modeled, that $309 figure could start to move lower. Even with a market trading at 20x times forward earnings, there is very little cushion when the denominator falls.
The technical picture gives us the range to work with. The 200-day moving average near 6,664 is the first real line of defense on any pullback. That level was identified as critical in our initial analysis and has since been reclaimed by the market with conviction. The bullish trend line from the October 2022 lows remains the most critical support level. On the other hand, the January all-time high near 7,002 is the ceiling. Within that roughly 5% corridor, the path of least resistance depends on earnings outlooks.
That's not a hedge or a cop-out. It's the honest read of a market that is moving fast on sentiment and needs fundamental confirmation to go further.
The single most important lesson from every comparable historical episode — Q4 2018, the 2015 correction, the February 2016 lows — is that the initial reflexive rally off the oversold condition is rarely the final entry point. The market almost always gives you a second chance to add exposure at better levels. The investors who get hurt are the ones who either panicked at the bottom or chased at the top of the initial bounce. Neither extreme serves you here.
Breadth is the variable we're watching most closely. Until we see breadth break convincingly above 50% and hold there, the risk of a lower retest remains real. We must respect that in our portfolio positioning. This isn't pessimism. It's the difference between trading what's confirmed and hoping what's possible becomes real.
Investor Tactics
Translating that analysis into actual portfolio decisions requires honesty. Honesty about what we know, what we don't, and what the risk of being wrong on each side actually costs. The posture we're maintaining is what I'd call cautious offense. We are not sitting on our hands waiting for a perfect signal that never comes. But, we are also not abandoning the discipline that protected us through the correction based on a rally.
We are not chasing the rally from current levels. However, we did use the initial bounce off the lows to rebalance portfolios and add a bit of equity exposure. However, adding here, at just 2.6% below the all-time high, requires paying a premium. That's not a trade we're willing to make at scale. What we are doing is defining the entry conditions in advance. Therefore, if the market gives us the pullback that history says is likely, we know what to do.
On the existing portfolio, the priority this week is triage. Positions that didn't participate meaningfully in a near-10% rally from the lows are telling you something important. We sold those. Conversely, we added to the quality names that led the recovery. Most crucially, risk management isn't optional in this environment.
The investors who will do best from here aren't the ones who called the bottom perfectly or who faded the rally out of stubbornness. They're the ones who accepted the data as it came, adjusted their positioning without capitulating to either extreme, and stayed disciplined enough to act on confirmed signals rather than hoped-for ones. That's been our approach since the 200-DMA broke in March. It remains our approach now.
The data got us to this point. Trust the process, not the emotion, to carry you through what comes next.
The post S&P 500 Outlook: The 8.2% Rally & What Comes Next. appeared first on RIA.
Full story here Are you the author?You Might Also Like
 The 200-DMA Just Broke: What Every Investor Should Know
2026-03-23
There are hundreds of technical indicators that market analysts track, but only one gets a live television chyron the moment it breaks. The 200-day moving average (200-DMA) is the single most widely followed technical level in global financial markets, and the reason isn’t mystical; it’s institutional. Quant funds, pension allocators, programmatic traders, systemic funds, and …
 Speculative Narrative Unwinds
2026-02-09
For nearly two years, markets were driven by the same speculative narrative that “this time is different.” Bitcoin, precious metals, and AI-linked equities rose not only because of robust fundamentals, but also because investors clung to powerful narratives about inflation, disruption, and monetary collapse. Those speculative narratives are not only seductive but also contribute to …
 The South Park Market Of 2026
2026-01-23
I have been a “South Park” fan for as long as I can remember, and while the show isn’t a market guidebook, its brutal satire cuts through nonsense better than many Wall Street commentaries. Just like on the show, characters make absurd decisions and face absurd consequences, which is familiar to investors today. For example, …
Tags: Bear Market,Featured,Investing,Lance Roberts,newsletter,recession,S&P 500,Technical Analysis


