


Jeffrey P. Snider
My articles My offerMy siteAbout meMy videosMy books
Follow on:LinkedINTwitterSeeking Alpha
| The dollar was high and going higher. Emerging markets had been seriously complaining. In one, the top central banker for India outright warned, “dollar funding has evaporated.” The TIC data supported his view, with full-blown negative months, net selling from afar that’s historically akin to what was coming out of India and the rest of the world. China was cutting its RRR multiple times.
This was all following May 29, 2018, too, a day in the global “bond market” which had left no doubt collateral conditions had already become seriously strained; the monetary tightening exclamation point on all of the above. Clear dollar shortage stuff, one after another after another. |
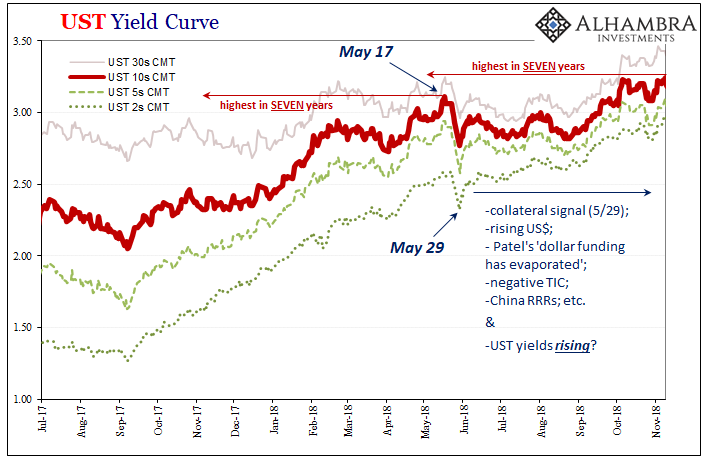 . |
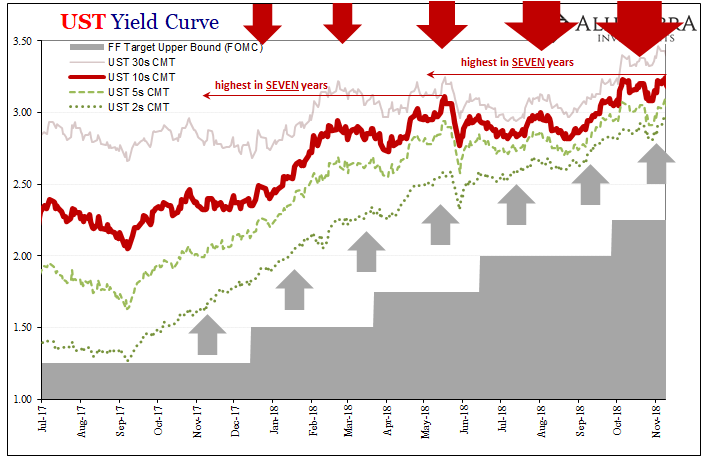
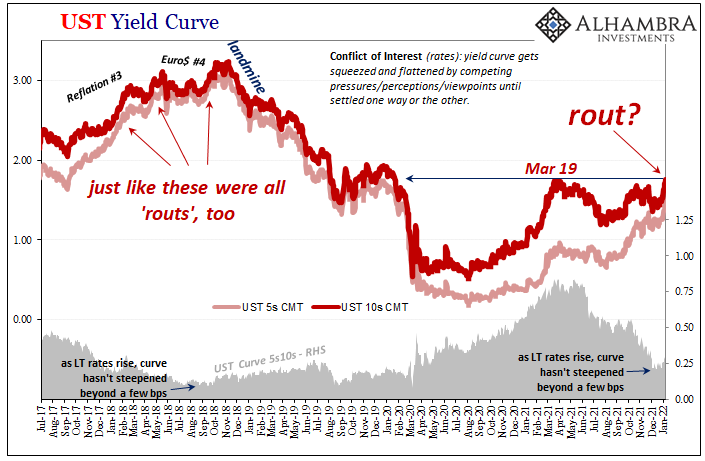
| And since the “bond market” and US Treasuries are at the center of it all, or closest viewpoint from which to peer inside the vast monetary shadows, LT UST yields of course…rose?Huh?
Yeah, they did. Not only that, after having reached a high on May 17, the 10-year would climb further to its highest in seven years by early October. You might remember those days, it was in all the newspapers, splashed across the internet in every form of its mediums. |
 . |
 . |
|
 . |
|
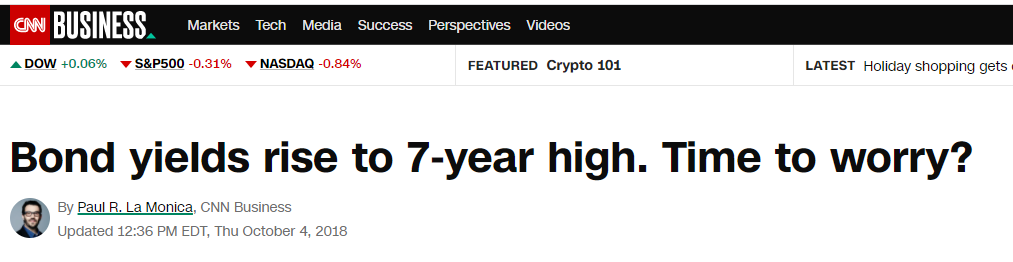
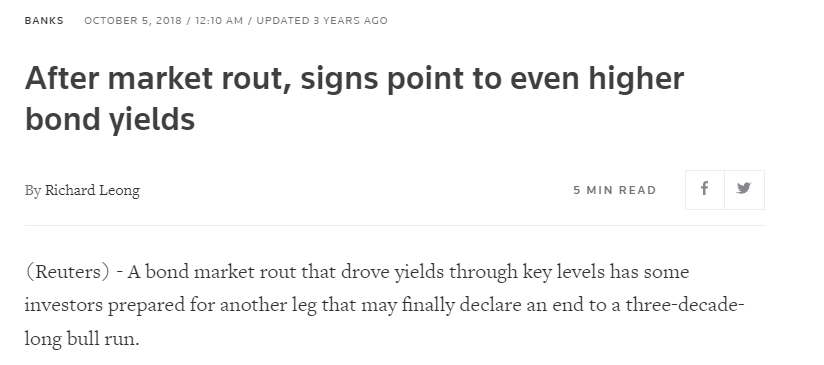
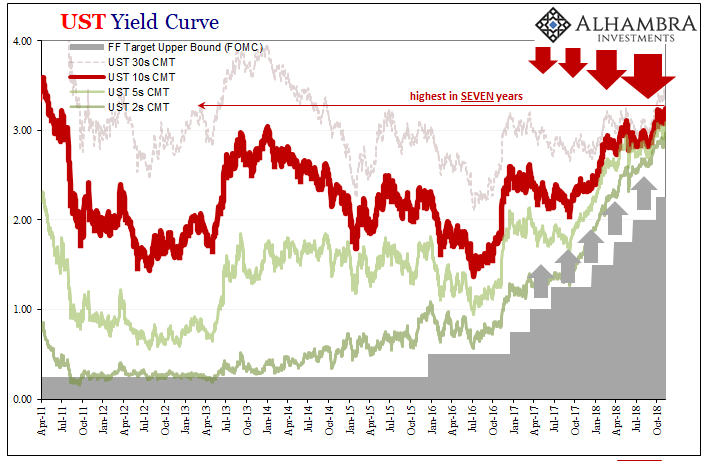
| The bond bull was immediately declared deader than a doornail, done, fork stuck already in what was reported as its rotting carcass stinking up the place. Inflation had killed it off, too, they said. Get used to much, much higher rates because this sucker, Jay’s economy was absolutely roaring.
Obviously, none of it was true; not the bond “bull” bull, nor all the scattershot analysis thrown around, including a whole library of the same such commentary beyond the tiny sample reproduced (easily) above. Barely over a month later, it all went downhill – literally, in the case of bond yields as well as the global economy. So what did happen in 2018? How can bond yields still go up despite all those nasty things listed at the outset? And what might that episode three years ago tell us about our current markets and global situation? First, always remember yield curve dynamics; the Treasury curve, like any other, isn’t monolithic. |
 . |
| There are parts, and each piece is oftentimes influenced by separate factors. If you haven’t already, this is a good place to start for these basics.
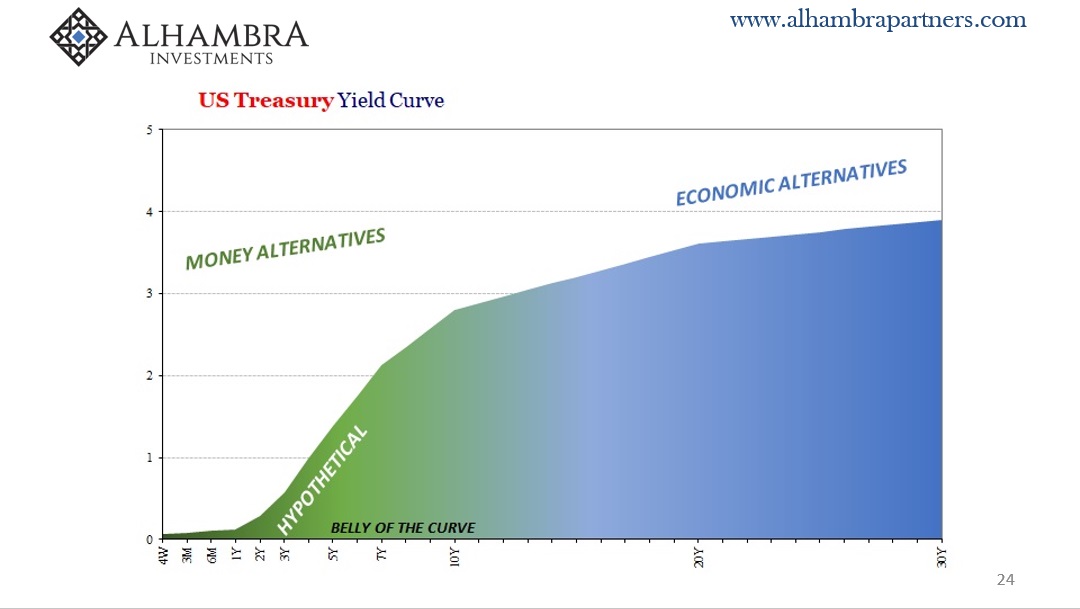
In addition to nominal yields and the curve level, you always, always need to pay close attention to the shape – on the whole as well as in discrete parts – and how the profile changes over time. This is a dynamic monetary/financial/economic universe, and the curve distorts with meaning and purpose hardly anyone nowadays seems able to properly decode. Though they are related, and do share some common factors, the balance of those can be quite different such that there are almost two curves operating simultaneously. The one at the front is most heavily inclined by monetary alternatives, and that money-like influence continues out into the middle of the notes – up to around the 5-year maturity (for a more detailed and complete description of these inner workings, click on the link above). From the 7-year note on out to the long bond end, this is Irving Fisher’s territory, the land of inflation and growth expectations as only somewhat predisposed by the cross-currents and perceptions of those front-end conditions. |
 . |
| When there are times the Treasury curve really does act like two Treasury curves, the boundary falls somewhere in that 5-year to 10-year No Man’s Land (this is why, of all the curve’s calendar spreads, I always start with the 5s10s because it crosses this border and sends us absolutely clear and powerful signals about this front vs. back relationship).
What was happening throughout 2018 was the yield curve splitting in two. On the one side, up front, the Fed and its federal funds target along with the various reserve programs (RRP, IOER) offering money alternatives via that set of policies. According to Janet Yellen then Jay Powell’s FOMC, they believed like all the media articles above the country was about to get itself into inflationary trouble. It was becoming too good, they reasoned. To head off that “danger”, rate hikes (as well as QT, but that’s a somewhat related tangent not necessary to go over today). For the Treasury curve, it would mean upward nominal pressure from below, from the shortest run. While all that was taking place in the short curve, the long end outright resisted the pressure even as yields here moved up, too. That was the back end squeeze, or flattening, competing narratives being played out in the whole curve’s shape. The overall shape flattened even as rates front to back rose because, Irving Fisher, growth and inflation expectations beyond any temporary short run Fed influence were not matching up with the Fed’s projections for those rate hikes. This is where all those dollar shortage factors I cited at the outset had come into play. |
 . |
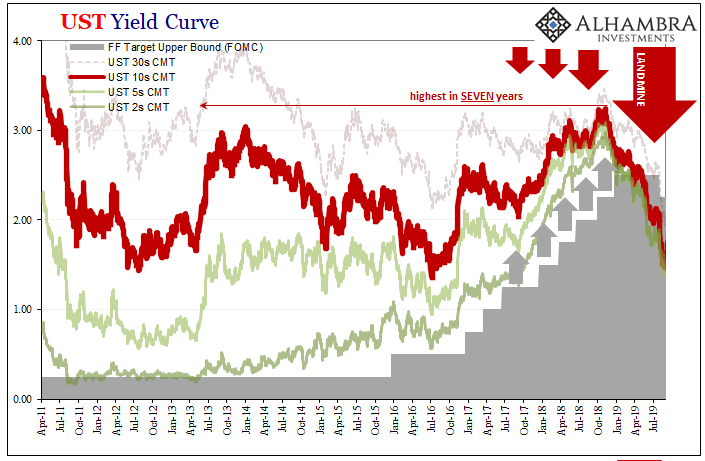
| The more 2018 passed, the more doubts about longer run inflation and growth grew as signals of deflationary potential continued to come one after another. However, the process of sorting those competing probabilities took time; it was only over much time that the spectrum of possibilities began to more completely favor the long end’s pessimism.
This had meant up to October and early November 2018, the yield curve would rise in nominal level while at the same time flattening dramatically. The future before that point was still undecided as to which curve, front or back, would win out. Right here is where the landmine comes into it, thus why I place so much emphasis on it. Time after time, the landmine has proved to be the moment when these conflicting viewpoints get settled. To date, they’ve always been settled to the long end’s doubts (which simply means long end doubts about deflationary risk and potential become just deflation). After that point, the whole thing is united once again as it collapses even up in the front (December 2018’s inversion). |
 . |
While everyone was told to focus exclusively on the highest-in-seven-years nominal 10s UST back in October and November 2018, that hadn’t actually meant anything useful or relevant; instead, the flat shape of the curve should’ve been everyone’s focus as it was those doubts even as interest rates rose and Powell’s hawks went unchallenged everywhere outside the yield curves second (back) half. |
 . |
| And they quickly melted away by the middle of November 2018 to leave everyone stunned; the bond “bull” very much alive and wreaking havoc yet again in Jay Powell’s expensive China shop, shelves overloaded with expensive media hot takes easily kicked over and trampled into forgettable dust.
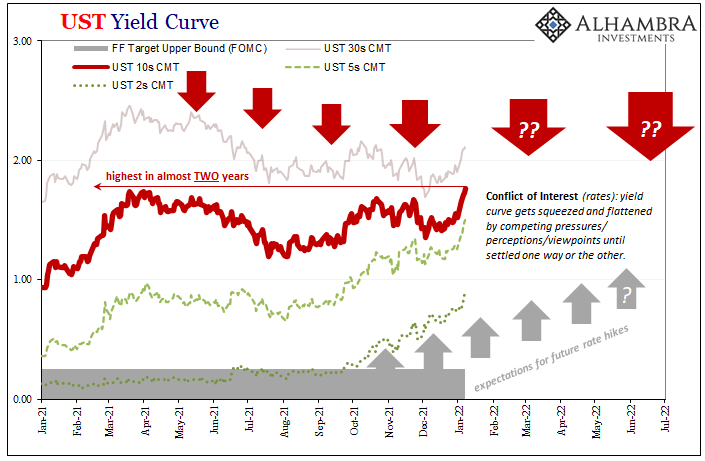
You have probably heard that today, January 7, December’s Payroll Friday, the UST 10s closed up trading at 1.76%, the highest yield in nearly two years!! The media is again ablaze with BOND ROUT!!!!!, the new high being heralded as the latest definitive sign of the bond market giving up and coming around to the inflation-red-hot-economy Jay Powell’s FOMC is once again using to justify its hawkishness. Like 2018, however, the yield curve has become similarly split and for all the same reasons. Over the past few weeks, the front end (out to the 5s) has been influenced by first the hawkish resolve (lots of rate hikes are coming!) before more recently having judged the omicron scare as little more than overkill. |
 . |
Powell has previously emphasized how the pandemic would be the one factor which could derail his taper/rate hike plans. With omicron appearing less and less of a stumbling block, the Fed’s temporary influence has taken over the short end, the road clear for rate hike liftoff maybe even by March.
This has similarly extended into the long end in that same 2018 way, to the point today the 10-year yield traded higher than its March 2021 peak. Upward pressure from underneath as the Treasury market doesn’t see anything right now, nothing tangible or immediate which over the short run might have a high probability of stopping the FOMC.
This despite again all those dollar shortage warning signs as stated in the opening paragraph. The flat curve, however, shows that those are still being taken seriously even as LT rates trend moderately higher.
Powell’s economic optimism, if you want to call it that since much of it derives from the unemployment rate and wage data, has been traded more forthrightly into the front with omicron fears fading. This translates into these modestly higher nominal levels but not a steeper shape.
It leaves us once more with these conflicting views meeting somewhere in the middle.
With no 2021 or yet 2022 landmine, the yield curve is actually two curves again waiting for this clash or conflict of interest rates (thanks Mr. Tateo for suggesting this title) to be settled one way or the other. Balance of probabilities in the front are more favorable, yet still so much unappreciated negative potential keeps a lid on it at the back.
There are other parts of the bond market equation to consider, as there had been three years ago, but I’ll save the similar move in TIPS real yields for next week. The eurodollar futures curve, still kinked but now un-inverted, I’ll also leave as a cliffhanger, too.
Full story here Are you the author?
Tags: Bonds,currencies,economy,Featured,Federal Reserve/Monetary Policy,inflation,Markets,newsletter,rate hikes,U.S. Treasuries,Yield Curve


