Is there anyone left out there who doesn’t know the rate of economic growth is slowing? The 10 year Treasury yield has fallen 45 basis points since peaking in mid-March. 10 year TIPS yields have fallen by the same amount and now reside below -1% again. Copper prices peaked a little later (early May), fell 16% at the recent low and are still down nearly 12% from the highs. Crude oil has recently joined in, falling 7% from its recent high. Energy stocks are in a full blown correction down 13% from the high set in June. Transportation stocks are also down more than 10% and materials stocks are close to correction territory too. Small cap stocks (Russell 2000) have been treading water since early February and are down about 8% from their high.
So, yes, the markets – people – seem well aware that the rate of growth is slowing.
A slowing rate of growth is not, however, a contraction, a recession. If that was the case, you’d see junk bonds selling off too and that just isn’t the case, at least not yet. In fact, credit spreads are at the lowest since about 2006. That isn’t as scary as it sounds since spreads went on to go even lower, bottoming nearly 75 basis points lower in mid-2007. I’d also expect to see the dollar rising as global investors generally want to hold dollars when things are looking their worst. The dollar is up from its recent lows but the rally so far looks pretty anemic. So, while the market is pricing in a slower rate of growth I think it would be a mistake to start acting as if the economy is about to fall off a cliff.
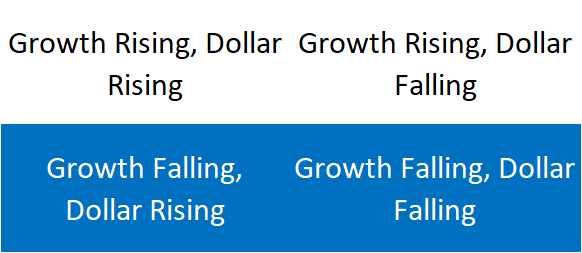
Our investment process puts a lot of emphasis on rates of change whether macro or micro. We classify the economy as either expanding or contracting and accelerating or decelerating. Different types of stocks and bonds benefit depending on the environment. An accelerating expansion sees small cap stocks, economically and inflation sensitive stocks outperform. A decelerating expansion will favor large caps and defensive sectors like healthcare and utilities. In expanding economies, corporate bonds tend to outperform Treasuries with duration determined by whether it is accelerating or decelerating. In contracting economies long term Treasuries perform the best.
Over the last few months, the changes we’ve made to our portfolio reflect the decelerating but still expanding economy. We sold energy, mining and materials stocks. We added healthcare stocks. We reduced our small cap and general commodity allocations. We raised our gold allocation. We extended, somewhat, our bond portfolio duration but we maintained some short term corporate bond exposure. All those moves are consistent with a decelerating but still expanding economy. The result is a higher than normal allocation to cash.
| The other part of our process emphasizes the trend of the dollar. A rising dollar is generally deflationary while a falling dollar is inflationary. I know that doesn’t fit the modern definition of those terms but it is more useful in my opinion. Prices are always changing, some rising, some falling, most of what the press identifies as “inflation” being nothing more than some price rising that people don’t like. Relative price changes can be confusing and personal experience can sway one’s views about inflation or deflation. But when the dollar is in an uptrend or downtrend it is usually pretty obvious. And it is easier to see that some relative dollar changes aren’t as important as others. The dollar rising against the Turkish Lira doesn’t mean much for the US economy. The dollar falling against the Euro, Yen or Yuan is much more meaningful. There are other ways to measure the value of the dollar too such as relative to gold or economically sensitive commodities like copper.
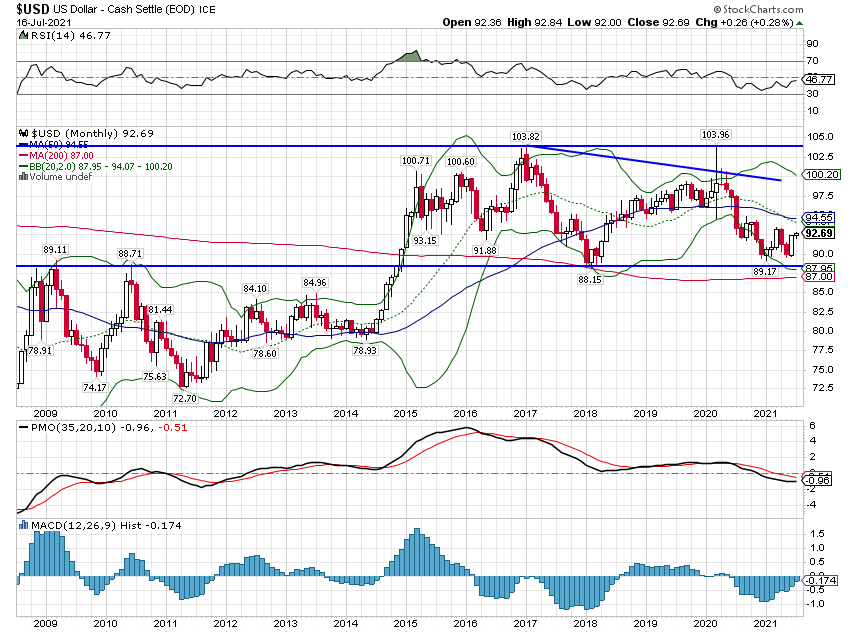
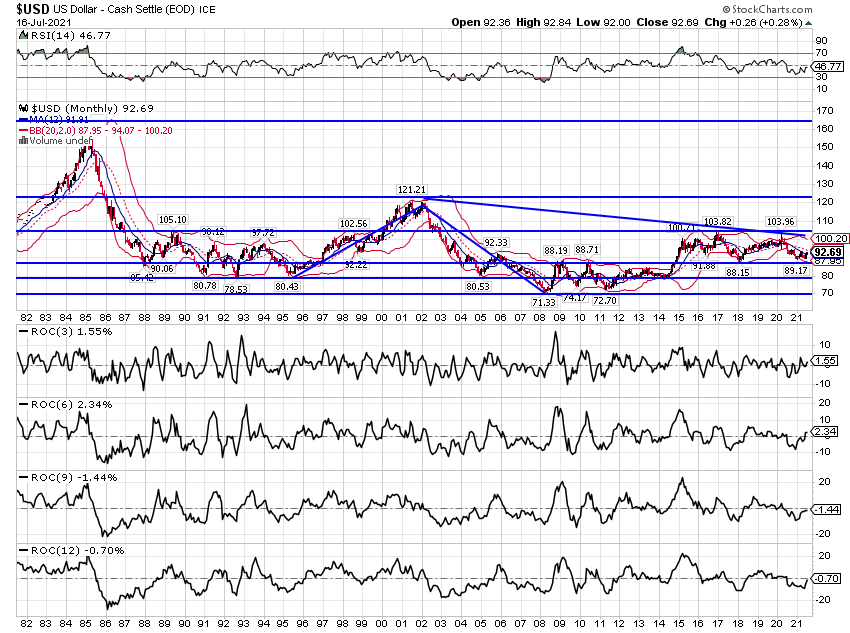
The state of the dollar is not always easy to determine though and as the title says, it is now clear as mud. The dollar index, which measures its value against a basket of currencies has been in a trading range for six years. It has had short term uptrends and downtrends during that time and we have taken advantage of them as best as possible. But the fact is that the dollar has gone nowhere for a long time: |
|
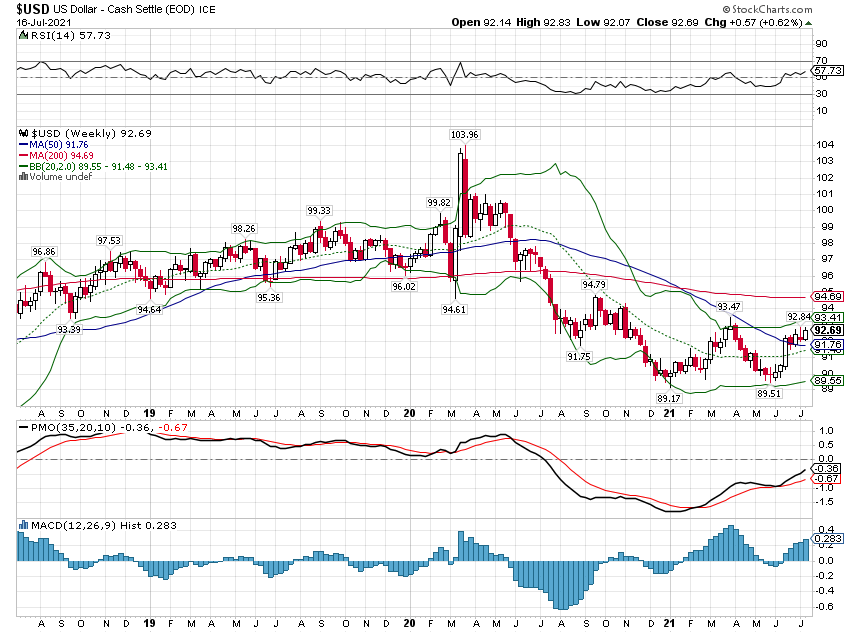
| The dollar is up on the year and over the last month or so but it is a small move so far, about 3% YTD. | |
| I have been calling the dollar neutral for months and I see no reason to change that right now.
From a portfolio perspective it means we are left in waiting mode. We made the logical moves for a decelerating economy but it is way too soon to position for a recession. If the dollar resumes the downtrend that started in the spring of last year, there are plenty of portfolio moves to make. International stocks generally outperform when the dollar is falling. General commodities would probably resume their uptrend. But if the dollar starts to rise again, an entirely different set of portfolio changes would be necessary. We certainly wouldn’t be worried about inflation. This, this waiting and doing nothing, is the hardest part of investing. It has been a tumultuous 15 months and following a process other than just buy and hold forever required more activity than any 15 months in recent memory. But now, there’s nothing to do but wait. Wait for more information about the economy. Wait for the dollar to establish a trend, even a short term one. It may be a virus resurgence that moves markets. It may be the new economic policies being discussed by the new administration. It may be developments in Europe or Asia that prove to be the final nudge. I don’t know and neither do you or anyone else. And so we wait. |
|
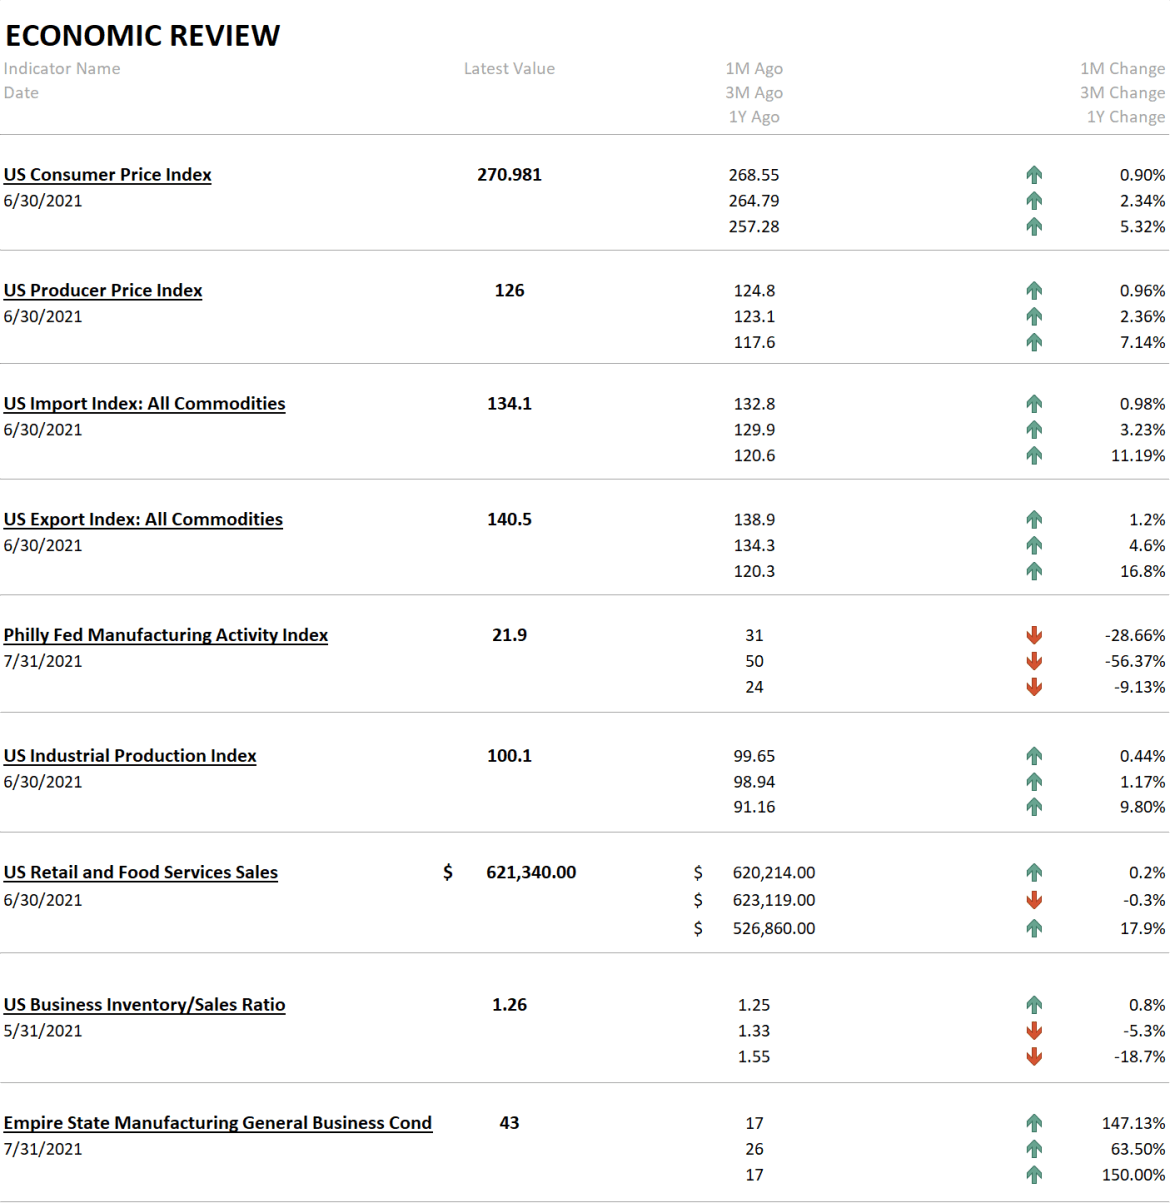
| The inflation data last week was hot but the market – the bond market specifically – didn’t care. The 10 year Treasury note yield fell on the week. Industrial production was held back by the auto sector but regardless, production is struggling to recover. You can see part of that in the inventory data where the business inventory to sales ratio remains quite low. Of course, the ratio is always low coming out of recession so maybe this is just normal reluctance of business to get too far out on a limb. The stock explanation is supply issues but that is likely only a partial answer restricted to a few industries. Whatever the case, IP has been anemic since the last recession with today’s index no higher than 2007. Retail sales were better than expected and remain very high relative to the pre-COVID trend. I’m sure that will come down unless the Biden administration finds a way to send everyone more free money.
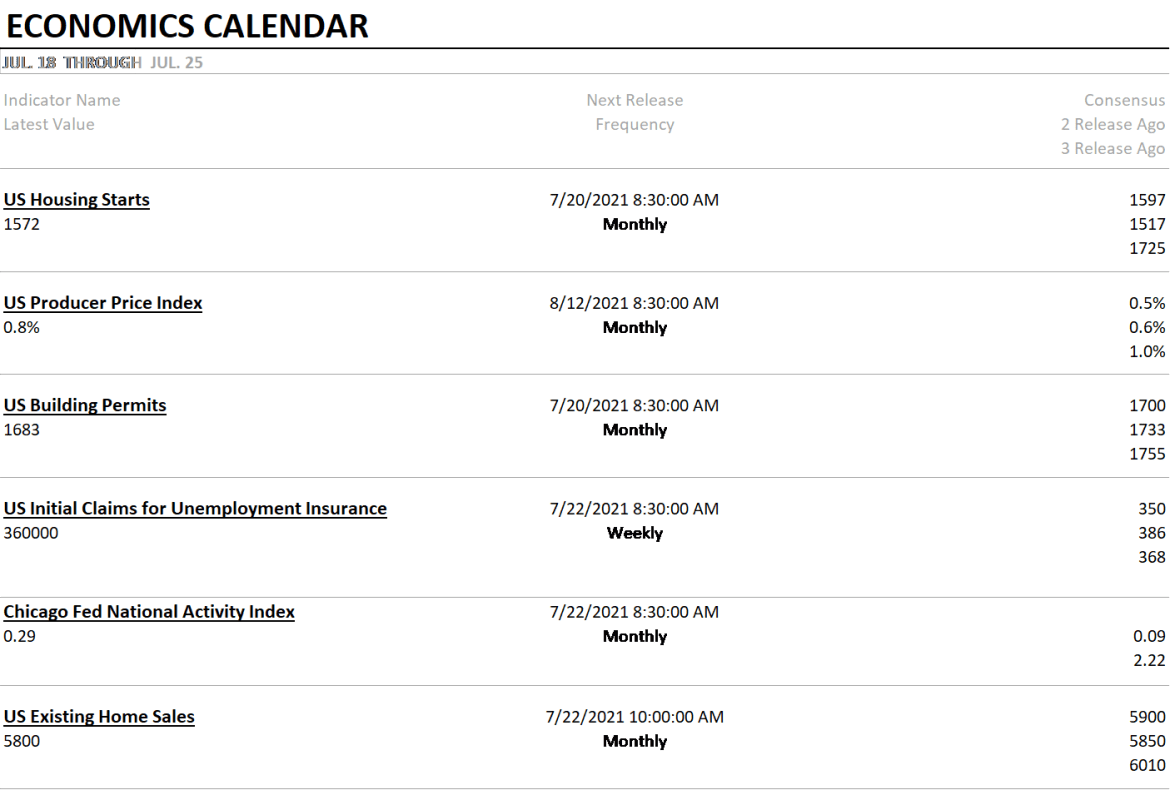
We get updates on housing next week with existing home sales, housing starts and permits. We also get the latest iteration of my favorite broad indicator, the Chicago Fed National Activity index. Expect it to fall back closer to zero or trend growth. |
|
|
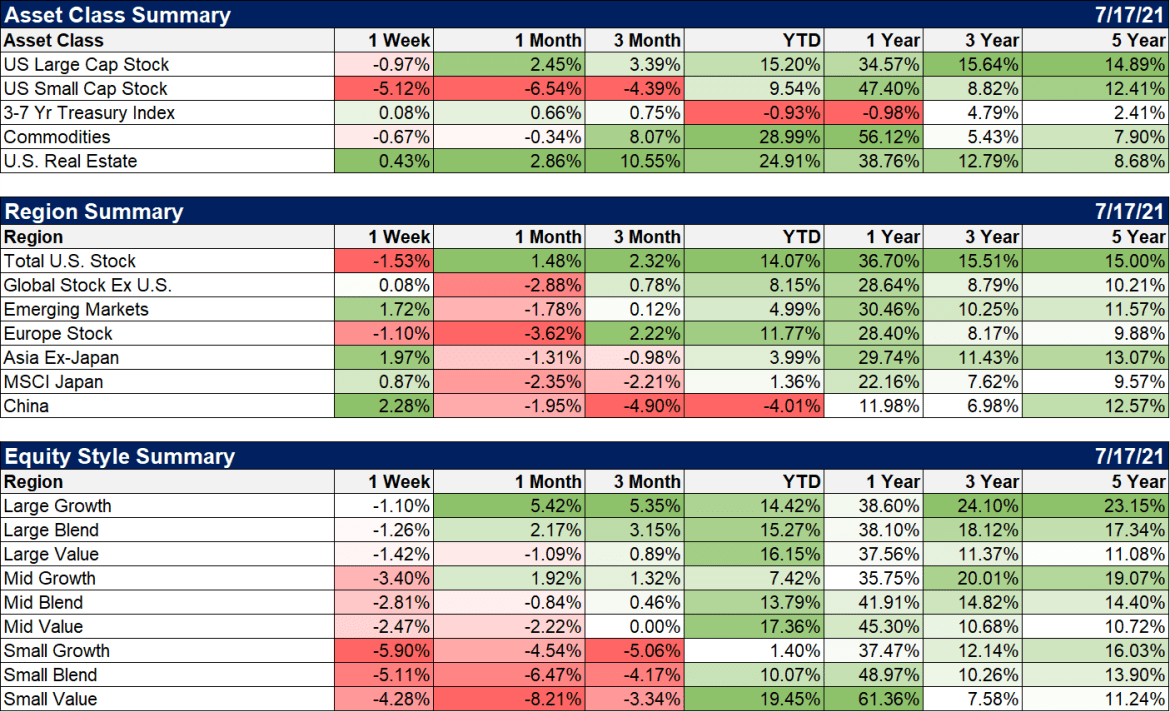
Markets generally had a tough week but bonds and real estate managed to post gains. Small cap stocks took it in the shorts, down over 5% on the week. Asian stocks outperformed last week while Europe followed the US. I was somewhat surprised to see EM stocks on the positive list and especially Latin America (not shown here but up fractionally on the week). That does not sound like fear of an economic slowdown to me.
|
|
|
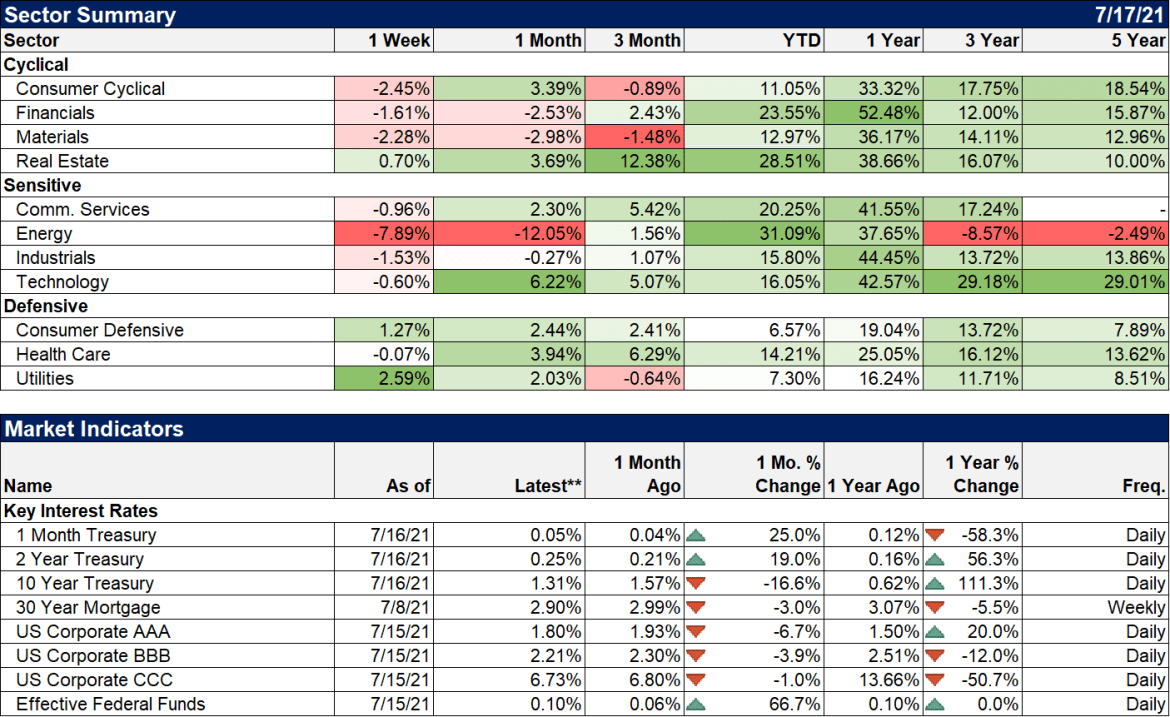
Energy stocks were the big losers on the week as OPEC+ appeared to come to a deal to raise output. I have to say, the deal I saw didn’t look like much so maybe it was just an excuse to take profits. Defensive stocks, as expected. were the best performers. |
|
| What should you be doing to your portfolio today? A very smart man once told me the answer to that question is almost always nothing. Active investing done right often requires a lot of activity in a short period of time and then….nothing for months or years. Once trends are established they need to be respected and exploited to the fullest. For the last six years, the dollar has been range bound in a very small band (about 10%). We have had long periods of range trading before but the range was wider, making shorter term trends easier to identify and exploit. The dollar traded in a roughly 20% range from 1988 to 2000 but the uptrend that started in 1995 didn’t peak until 2002. That was followed immediately by a six year downtrend until 2008. Those two periods saw very different assets outperform and there was a big payoff to recognizing the trend change. And I expect the next trend to pay similar rewards. |
Tags: Alhambra Portfolios,Alhambra Research,Bonds,cfnai,commodities,Copper,Core CPI,CPI,Crude Oil,currencies,Deflation,Dollar Index,economic growth,Emerging Markets,energy stocks,Featured,inflation,Interest rates,Markets,newsletter,PPI,Real Estate,stocks,TIPS,US dollar


