| The “too many” Treasury argument which ignited early in 2018 never made a whole lot of sense. It first showed up, believe it or not, in 2016. The idea in both cases was fiscal debt; Uncle Sam’s deficit monster displayed a voracious appetite never in danger of slowing down even though – Economists and central bankers claimed – it would’ve been wise to heed looming inflationary pressures to cut back first. Combined, fiscal and monetary policy was, they said, eventually going to let loose on consumer prices.
Hogwash. Here’s what I wrote the first time back in March 2016:
|
US Treasury & Auction Rates, 2018-2021 |
| In other words, primary dealers would likely have been only buying enough to maintain orderly markets, not so much that they suddenly became bloated warehouse units of unhedged risk. It strains credibility already.
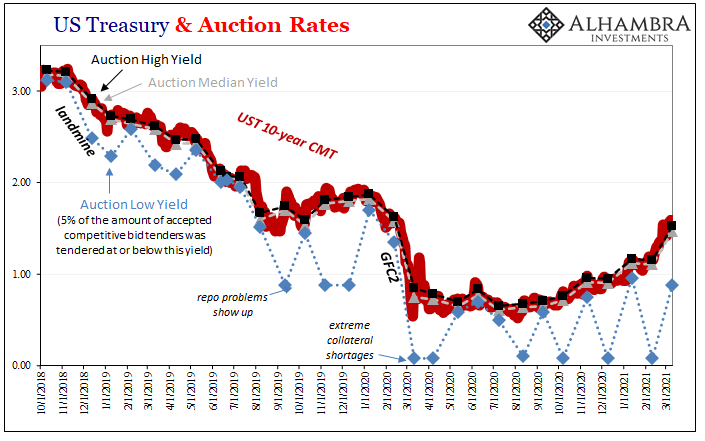
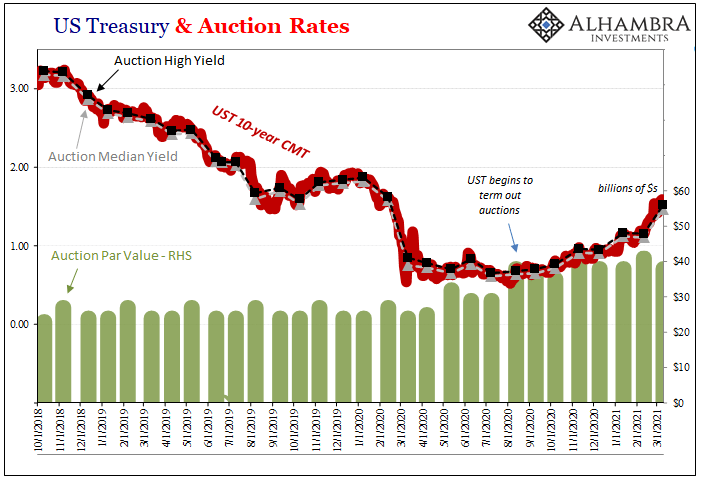
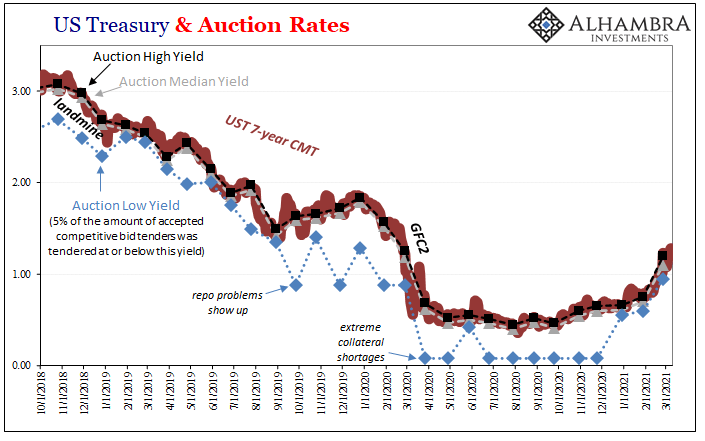
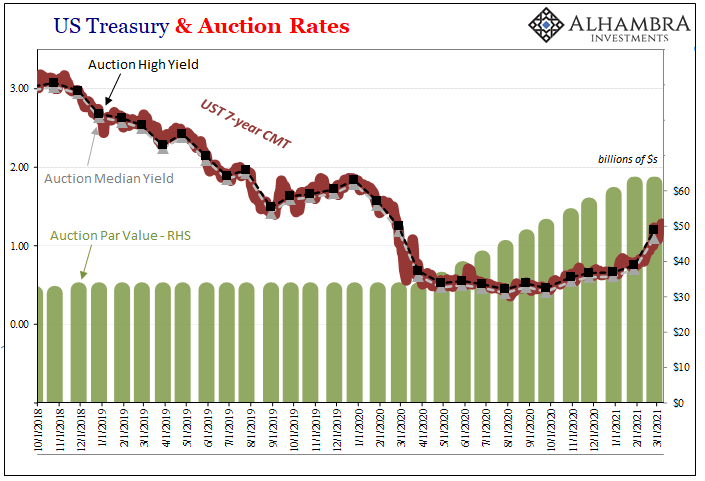
The second part is even worse. These banks are supposed to have had trouble selling UST’s during a period when everyone was buying them?…To suggest these banks have had so much trouble offloading their “duty” of emergency support, to the point of being “forced” into worse and worse funding and hedging prices, does not just strain credibility it is patently absurd. And yet, despite all the constant market evidence (prices, both auction and secondary markets) the theory made another appearance just a few years later based on the same premise. Only this time, early 2018, even worse given TCJA’s (tax reform) Trumpification of the deficit. |
US Treasury & Auction Rates, 2018-2021 |
US Treasury & Auction Rates, 2018-2021 |
|
US Treasury & Auction Rates, 2018-2021 |
|
| That’s the big problem with conventional Economics; it never allows itself to be falsified no matter how much evidence piles up against its sacred canon. “Too many” Treasuries was supposed to have been a part, and a key part, of the inflation confirmation. Instead of seeing that it wasn’t the case and understanding how this falsified the theory, the goalposts shifted which many times simply means moving everything further out in time (well, there didn’t turn out to be too many for the market to bear this year, but next year the thing will break for sure!)
With Treasury prices only much higher since, as they sell again from their recent highs last August the argument is put forward all over in a rolling clownshow of unexamined assumptions: anxiety over “too many” Treasuries. |
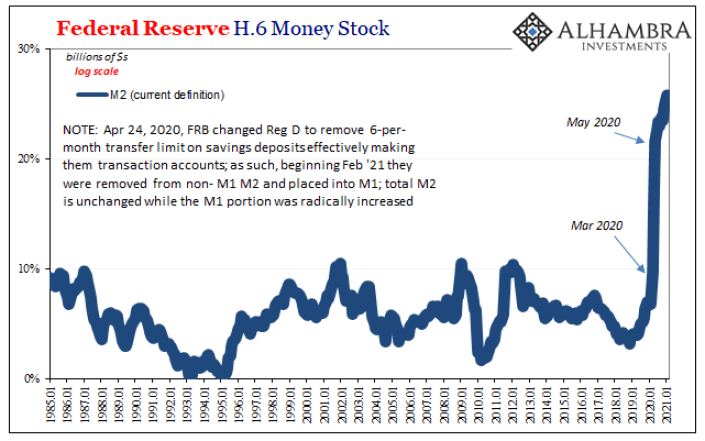
Federal Reserve H.6 Monet Stock, 1985-2021 |
Earlier today, this was written consistent with conventional assumptions:
Today’s 10-year reopening actually went off swimmingly despite any imagined wariness; just as all the rest have dependably time and again. With enhanced focus based on recent repo issues, this auction like all the others again showed that supply isn’t driving price whatsoever. The market wants whatever is sold safe in the knowledge there’ll be buyers for whatever doesn’t stick around in dealer inventory. What’s left, then, for rising yields (modestly falling prices) is entirely reflation alone. That isn’t to say inflation, which is something very different. In fact, from March 2016 like early 2018, this difference was palpable as the BOND ROUT!!!! linked to “too many” Treasuries failed to materialize month after month, year after year. Cries of surefire inflation were consistently lobbed about from the media perch and Bond Kings’ thrones, but never once from the market’s actual condition. From TIPS to 10s, auction demand to gold prices, modest reflation is once again left to answer for this 2021 market “volatility” – and nothing more than that. Bullion prices inversely reflect long-end Treasury yields, which wouldn’t be the case on the cusp of a major consumer price breakout like the wildness pictured in academic measures like M2. |
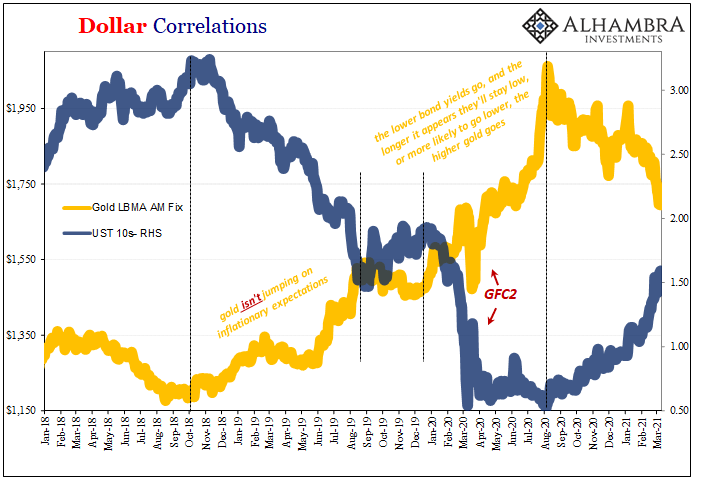
Dollar Correlations, 2018-2021 |
|
Gold prices had risen as UST demand had in the disinflationary/deflationary period up to March 2020, both for the same reasons; things going wrong for Jay Powell’s inflationary bias rather than right along his hawkish stance. Since yields bottomed out last August gold has still marched in inverse lockset with the reflationary reset across the note-end of the Treasury curve – because it only means a slightly better, less awful future scenario.Modest reflation fits with gold coming down from a high degree of realistic fear over big (deflationary) errors that it priced at its last August high. After all, 2020 had been and remained a historic mess despite all the flood myths and ten-figure government interventions (in fact, because of those and the lack of results). Let’s face it, gold’s still ~$1700 and UST 10s still yield around what would’ve been a record low before last year. |
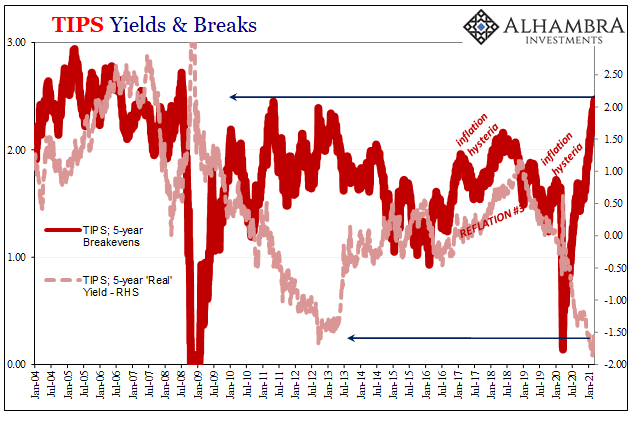
TIPS Yields & Breaks, 2004-2021 |
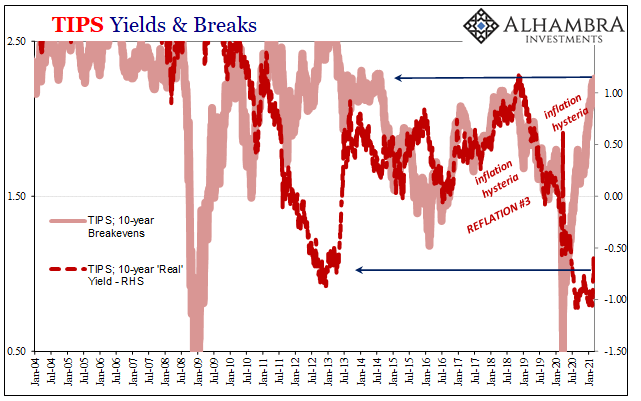
| Just how much have things improved given those corroborated signals? In other words, let’s not get carried away and retain some needed perspective that you won’t get from the exact same “too many” Treasuries arguments. You see this exact same thing in TIPS; while inflation expectations (breakevens) are up, they aren’t really up all that much and they are more importantly overshadowed by real yields that indicate almost nothing good from the real economy.
Given that, no wonder demand for the safest, most liquid (OTR) instruments proceeds without interruption regardless of supply size (boosted, now and again, by what’s really behind repo irregularities). The Treasury price range right now is set by reflation alone, which means, outside of bills, not much has changed since early 2018 or March 2016. We’re still operating in the same framework. |
TIPS Yields & Breaks, 2004-2021 |
Full story here Are you the author? Previous post See more for Next post
Tags: Bonds,commodities,currencies,Deflation,economy,Featured,Federal Reserve/Monetary Policy,Gold,inflation,Interest rates,Markets,newsletter,Reflation,U.S. Treasuries


