Jeffrey P. Snider
My articles My offerMy siteAbout meMy videosMy books
Follow on:LinkedINTwitterSeeking Alpha
Fear of the ultra-inflationary aspects of fiscal overdrive. This is the current message, but according to what basis? Bigger is better, therefore if the last one didn’t work then the much larger next one absolutely will. So long as you forget there was a last one and when that prior version had been announced it was also given the same benefit of the doubt.
Most people don’t like looking to Japan mainly because it is too depressing; unless one is an Economist who just doesn’t want admit such theoretical failures of the scale that would up-end the entire discipline. Whatever the underlying reason, each prefers instead to come up with rationalizations for why when every Western country does the exact same things the Japanese have already tried the results will somehow, some way scroll up differently.
That’s not logic; it’s unrivaled insanity.
Japanese officials are themselves insane to a substantial degree, but who is more far-gone: those who keep doing the same things regardless of results, or others who have the ability to identify and track those undesirable results without harming their own yet choose to undertake the same ideas anyway?
Abenomics began with a bang; in January 2013, Prime Minister Shinzo Abe first bullied the Bank of Japan into his first “arrow”; the monetary policy “easing” that would be called QQE (begun in April that year), the monetary piece of this Abenomics. It was declared a massive monetary expansion, unrivaled anywhere since perhaps Germany circa 1922-23 – only this time it was to be intentional.
Abenomics’ second arrow was fiscal expansion. While not quite as “reckless” as QQE, and why it comes second in Abe’s clearly arranged pecking order, Japan’s Cabinet Office was alighted with a hefty ¥20.2 trillion in “stimulus” to start with January 2013. As these things go, the announced number is always a bit fuzzy and puffed up to, very much like QQE, add to the shock and awe effect (which leads one to question what apart from shock or awe is left to affect?)
A little over half of the total, about ¥10.3 trillion, would come down in the form of “direct” federal government spending; the remainder, some ¥9.9 trillion, was meant to flow through local governments and private channels deploying credits and grants (via the Trust Fund Bureau or one of the 30-some other “agencies” tapped into “secondary” budget resources).
Of that “direct” ¥10.3 trillion, ¥3.8 trillion was earmarked for “disaster relief” (there’s always a “disaster” to justify more central spending; in Japan in 2013, this meant Fukushima and still recovering from 2011’s earthquake/tsunami), ¥3.1 trillion for child and medical care expenses, and even a hundred billion yen or so for the military.
“Stimulus.”
Critics – especially those who support the theory – contend that large numbers as they may be they are never large enough nor does it end up where it is needed most. The first part even Abe agreed with; a second Abenomics second arrow was announced in April 2014, barely a year later, as the Japanese economy stumbled badly supposedly bedeviled by the 2-percentage point increase in the country’s VAT tax.
This second helping of the second arrow was followed later in 2014 by a second QQE, building up the pace of bond/asset purchases still underway from the first dose of the first arrow. Around the same time, a third iteration of the second arrow was announced, more government spending, followed by another one the next year (2015).
In early 2016, QQE2 was changed to QQE w/NIRP (negative interest rates) followed by yet another fiscal package that July, this time an announced ¥28 trillion, and then QQE w/YCC implemented in September (along with a monetary policy commitment to “overshoot” on inflation the central bank still hadn’t come close to finding).
Over the next little while, especially 2017, authorities believed it had finally worked. Inflation rates began to rise, as did gross economic numbers suggesting at least some modest acceleration.
Just as officials were becoming confident as to Abenomics ultimate – if delayed; it was only supposed to take two years and be completed, meaning unwound, by around 2016 – success, “something” yanked the rug right out from underneath them in the early months of 2018. Had it really been Abenomics that by 2017 had most things at least going in the right direction? Of course not, it was instead “globally synchronized growth”:
One factor underpinning the recent 2017/early 2018 modest economic growth is the expansion of global demand, particularly for high-tech electronics…Those who remember the trillions of dollars in spending on public works—massive and often unnecessary road and bridge construction projects—that littered Japan’s countryside during the “lost decade” of the 1990s worry that Abe’s stimulus may add to the debt load without boosting output.
Understanding that it had been the arrival of Euro$ #3 which had first “delayed” Japan’s rebound until later in 2016, this would put the mild acceleration in 2017 into the context of Reflation #3 rather than some categorical shift without account for its postponement; in other words, this is the eurodollar’s world and we are all just trying to get along inside of it.
Thus, when Euro$ #4 showed up right at the start of 2018, all the hopes and dreams of Abenomics were yet again rudely shoved to the side and leaving officials confused. Inflation as GDP rates began to recede all over again even as all three of its arrows still ongoing (the third having been structural reforms primarily in Japan’s labor force; incentivizing more women to join, the so-called Womenomics).
By later 2019, Japan found itself mired in another recession, a long-postponed second VAT tax hike, and then more second arrow: another ¥13.2 trillion program broadcast two Decembers ago. This was quickly followed by COVID, a second global dollar crisis, and then the big colossus: not one but two – yes, two – nearly identical ¥117 trillion fiscal packages.
|
The first had been unveiled in April 2020 followed quickly by the second last May. The ¥234 trillion combined amounted to an absolutely filthy 40% of GDP! You can say one thing about the Japanese, they absolutely roll out incomprehensibly large numbers. As usual, the headline oversold especially any straightforward impact; about ¥33 trillion would come out as direct spending financed by nearly ¥32 trillion in new bond issues (bond-financed fiscal expansion) contained in a second secondary budget. Though smaller, even the direct spending this time would be greater than the first four headline second arrows combined. Though Shinzo Abe resigned as Prime Minister last August (for “health” reasons), his successor Yoshihide Suga picked right up where everything had left off. Still another fiscal “rescue” was crafted in December 2020, this time about ¥40 trillion, which by itself would have been twice as large as the largest single announcements of the pre-2020 Abe era. |
Japan CPI, 2006-2021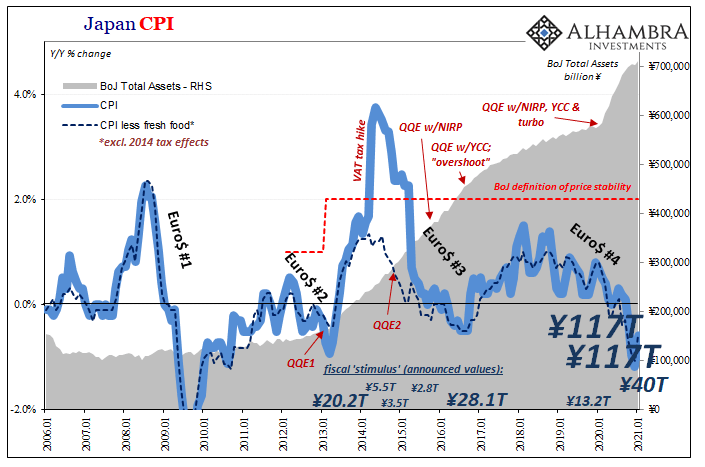 - Click to enlarge |
| While all that had been taking place, the Bank of Japan re-accelerated QQE last March propelling its own balance sheet to just shy of three-quarters of a quadrillion yen in total assets (therefore liabilities, majority in the form of bank reserves, and some very small capital).
The country’s economy, given these massive doses of everything, must be an absolute inflationary inferno speeding toward its Weimar Germany hyperinflationary reckoning, right? Well, Japanese inflation did pick up in January 2021, rising about 0.5% month-over-month. That increase in the CPI index brought annual inflation rates to -0.6% last month up from -1.2% in December. Core consumer prices had likewise fallen -0.6% during January. If you can detect any impact – even temporary – from any of these policies without resorting to “jobs saved”, you would certainly have to be an illusionist. Again, inflation like Japan’s overall economic trajectory is moved by the eurodollar regardless of government action, big, small, or even utterly insane. |
Japan Real GDP/GDE 1955-2019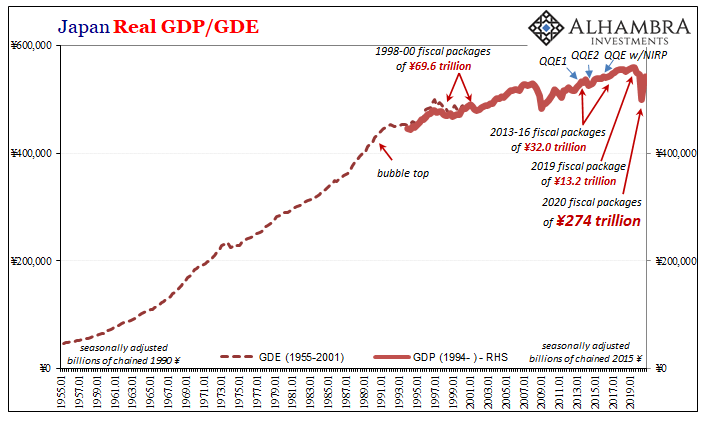 - Click to enlarge |
The Biden Administration is about to unleash its own monster, as you probably know, goosed up to a mammoth (sounding) $1.9 trillion – approaching 9% of nominal annual US GDP. Quite Japan-like, looking into the details direct “aid” is less than half that total (about $825 billion). There’s about $350 billion to bail out the states and DC (according to a political formula) plus $130 billion or so to school districts (paid out over a seven-year period) compared to $475 billion in payments to individuals.
These are significant sums. What they are not is somehow different from Japanese.
Full story here Are you the author?Tags: Abenomics,Bank of Japan,Bonds,CPI,currencies,Deflation,economy,Featured,Federal Reserve/Monetary Policy,Fiscal spending,inflation,Markets,Monetary Policy,newsletter,nirp,QQE,stimulus,ZIRP