Jeffrey P. Snider
My articles My offerMy siteAbout meMy videosMy books
Follow on:LinkedINTwitterSeeking Alpha
|
Headline GDP growth during the fourth quarter of 2019 was 2.05849% (continuously compounded annual rate), slightly lower than the (revised) 2.08169% during Q3. For the year, the Bureau of Economic Analysis (BEA) puts total real output at $19.07 trillion, or annual growth of 2.33% and down from 2.93% in 2018. Last year was weaker than 2017, the second lowest out of the six since 2013. And that’s where the good news ends. |
Eurodollar Disruption, Peaks & Troughs, 2011-2019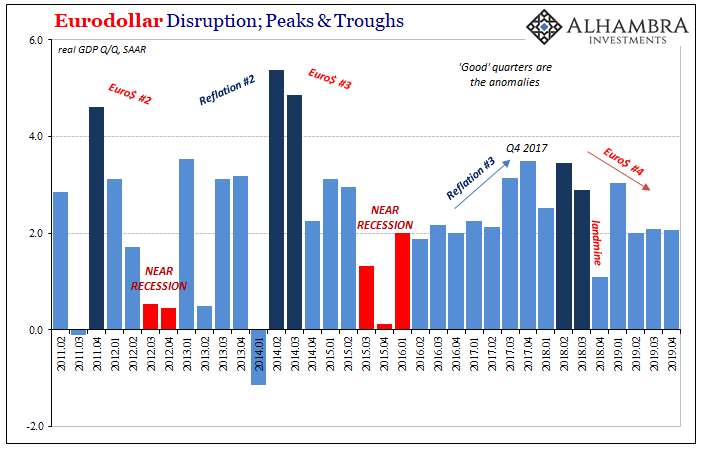 - Click to enlarge |
Case Study in Missing Growth, 1983-2018 - Click to enlarge |
|
The Real GDP Problem, 1988-2018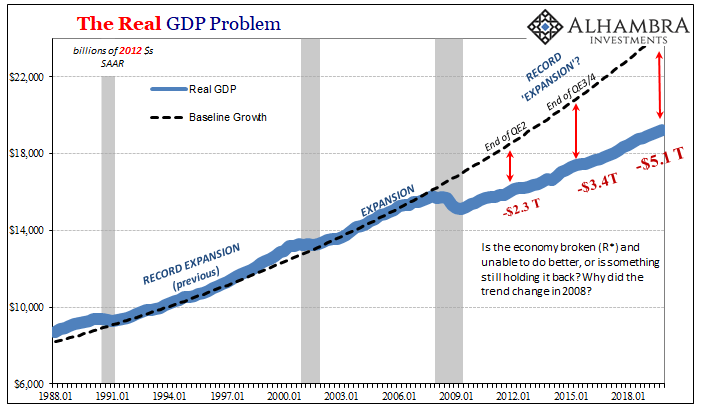 . |
|
| Underneath the headline, not all that far into the details is a growing mess. To begin with, the major contributor to Q4 “growth” was the unusually large decline in imports (GDP accounting subtracts spending on anything coming from overseas). While exports were marginally higher (1.4%), the BEA figures that the total dollar value of imported goods and services, adjusted for inflation, fell by an annual rate of near 9%. |
GDP Net Trade, 1998-2019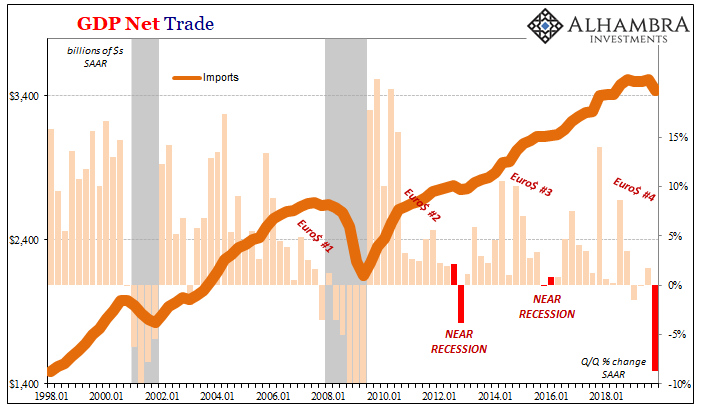 - Click to enlarge |
| That was the largest such decline since the second quarter of 2009 – the last of the Great “Recession.” So much for US demand. Along with what has been flat exports going all the way back to early 2018, together they “contributed” 1.48 points to the latest measure of overall GDP that was barely 2%. |
GDP Net Trade, 1998-2019 - Click to enlarge |
| The way the BEA figures it, this is starting to look like something different. Imports didn’t fall like this during the near recession at the culmination of Euro$ #3 in 2016, either. The closest was the one quarter during the likewise close call coming at the end of Euro$ #2, but that was a single quarter.
Remember, these figures are drawn from the final three months of 2019. Every one of which came after rate cuts (two of them, anyway, with the third and, so far, final in the earlier part of the quarter during October) and repo operations. And a not-QE. What I wrote about it in December drawn from the Census Bureau’s estimates for their view of imports has been reinforced by the BEA’s quarterly update. More signals of a more synchronized global downturn.
And that’s just where the bad news GDP begins. Imports are down so sharply because the domestic part of the supply chain has neared its breaking point. One step up from imports is inventory. If retailers and wholesalers are thinking economic weakness, and then see it confirmed by inventory piling up, they’re going to begin cutting back on what they order which means a material change in the demand for imported goods (as well as those produced domestically; see: ISM). |
Case Study in Inventory, 2006-2018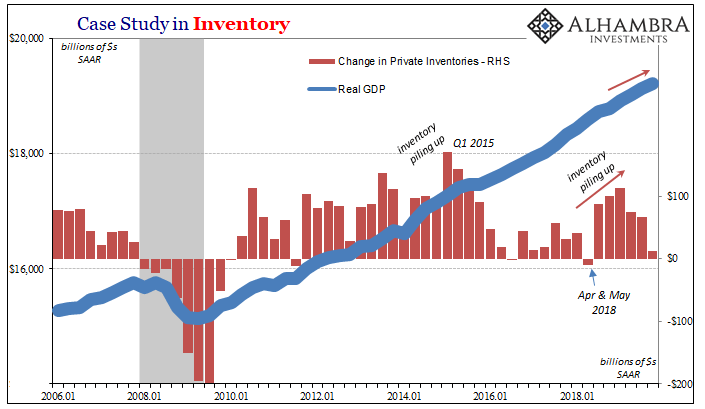 - Click to enlarge |
| Inventory had first accelerated for the three quarters immediately following the dollar change during Q2 2018 (April and May). Over the final three quarters of 2019, as you can see above, inventory continues to grow but at a decelerating rate. For Q4, the BEA believes it was finally almost flat.
Is that the top of the inventory portion of the cycle? That depends on whether you believe consumer spending is about to kick back in. Jay Powell certainly does, or says publicly that he does, largely based on his view of the labor market as represented by the stellar unemployment rate. Other labor market data isn’t looking so good. Neither is the GDP estimate for Personal Consumption Expenditures (PCE). During the final three months of last year, the Christmas shopping season, PCE gained just 1.8% (Q/Q annual rate). That was down from a 3.6% rate in Q3 and an outlier of 4.6% during Q2. In fact, those prior two quarters were anomalies in what has been a clearly weakening trend dating all the way back to the “best jobs market in decades” that didn’t survive the end of 2014. |
Real Personal Consumption Expenditures, 1983-2019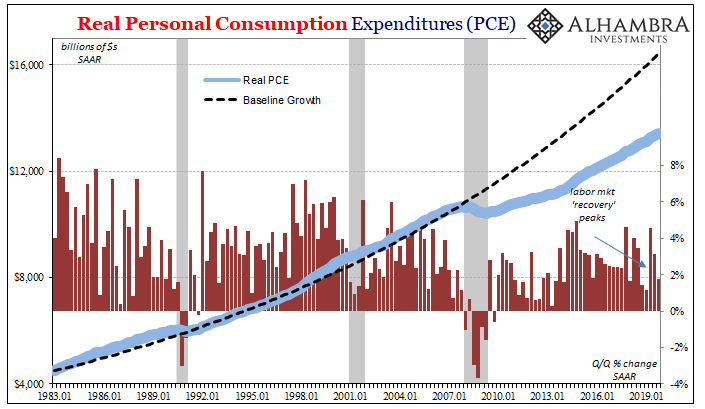 - Click to enlarge |
| Going back to Q1 2018, half the quarters have been 1.8% or less, including three out of the last five.
Consumer spending is a lagging indication, at best coincidental. More forward-looking is business investment or capex. In the jargon of BEA GDP, Real Private Non-residential Fixed Investment (PNFI). As consumers are slowly squeezed by headwinds and disinflationary pressures, US businesses are ahead of them in that very same process. |
Real Private Non-residential Fixed Investment, 2002-2018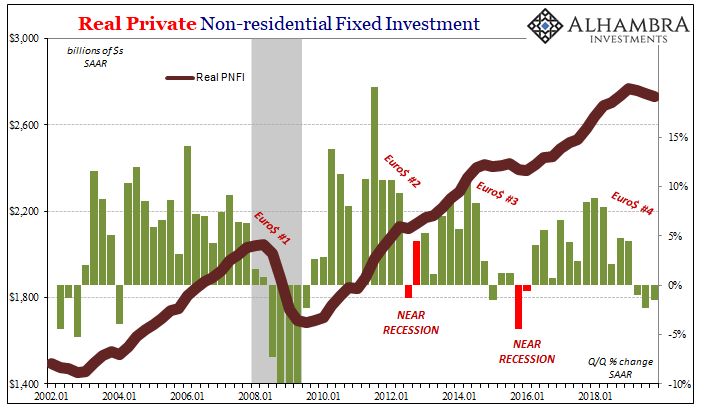 - Click to enlarge |
| Capex, in its GDP form, has now declined for three consecutive quarters. Again, that includes the fourth of 2019 when businesses were fully aware of how helpful the Federal Reserve was telling them it was being. Not to mention the NYSE.
Year-over-year, PNFI was down (slightly) for the first time since Q1 2016. More and more the final quarter of last year looks like the first quarter of that year – which wasn’t very good, in fact very near to recession. And during that time, the Fed had just raised the fed funds target(s) together these two periods indicating how it really doesn’t seem to matter all that much what the Fed is doing in any direction. And there are, as noted above, quite a few signs that the current downturn has the potential to surpass that prior one. Not only imports and perhaps PCE, but also, on the supply side, one key piece of capex. The US economy like many others is transforming, much slower than it needs to but being converted nonetheless. The high-tech sector has been one of the few parts of the economy to have maintained relatively robust growth; in fact, one of the very few where you wouldn’t roll your eyes when the word strong was used to characterize it. |
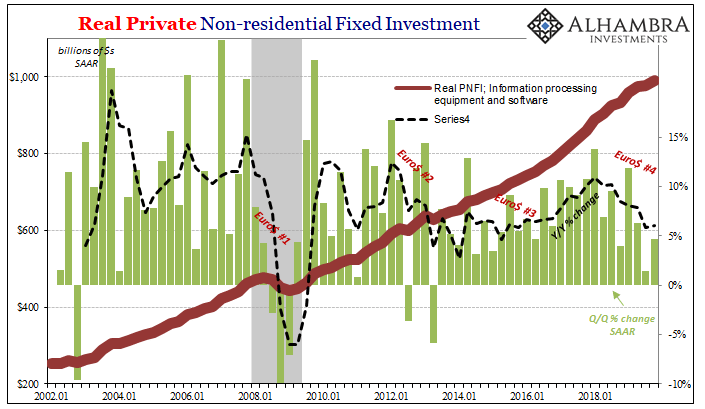 . |
IT equipment and software investment had been accelerating, sharply, ever since around the end of 2013. But it peaked back in Q1 2018 and with the dollar’s (latest) shift it’s been downhill ever since.
That’s one part of economic growth, supply side no less, that the US economy cannot afford a sustained deceleration let alone any real setback. It could prove crucial as to whether or not this downturn goes farther than the last one.
Altogether, Q4 makes three straight quarters of right around 2% GDP, proving at least one thing – there was no second half rebound. But there is a progression underlying each of those three that makes them very different. The common assessment is that the US economy finished up 2019 in relatively good shape to begin 2020 heading back the right way.
The BEA, however, doesn’t have the numbers to back up that view. They don’t add up to a recession, either, but they are continuing to point toward more downside to come whatever that might mean. Risks seem to be still on the side of more Euro$ #4 than Reflation #4. And, like China’s economic juggling act, that’s all before virology going viral.
Full story here Are you the author?
Tags: capex,consumer spending,currencies,economy,EuroDollar,eurodollar squeeze,exports,Federal Reserve/Monetary Policy,GDP,imports,Inventory,Markets,newsletter,PCE,personal consumption expenditures