Jeffrey P. Snider
My articles My offerMy siteAbout meMy videosMy books
Follow on:LinkedINTwitterSeeking Alpha
|
Even though it was a stunning turn of events, the move was widely celebrated. The Federal Reserve’s Open Market Committee, the FOMC, hadn’t been scheduled to meet until the end of that month. And yet, Alan Greenspan didn’t want to wait. The “maestro”, still at the height of his reputation, was being pressured to live up to it. The Fed had begun to cut rates. In Austin, Texas, where President-elect Bush and many prominent business leaders were gathered, the news was greeted cheerfully, completely free from alarm. Jack Welch, the “legendary” CEO of General Electric at the time, said how the room had “rejoiced” at Greenspan’s “decisive action.” They all raised their glasses in festive salute. It had been a tough year, 2000. |
US Treasury Yield Curve, 2000-2001(see more posts on US Treasury yield, ) - Click to enlarge |
| The stock market which ended the 1900’s on a seemingly unstoppable run had been, in fact, stopped. The question was whether that would mean something more than the shattered dreams of day traders. The bond market was pretty clear especially as the year wore on – recession.
January 3, 2001, was the second business day of the new year and here was the maestro giving in to those concerns. It had been an unscheduled intermeeting vote to reduce the federal funds target; not by the typical 25 bps, either, but a double shot 50 bps. The very sort of quasi-emergency maneuver that common sense would have dictated required more sober analysis. Not so at the NYSE, which CNN relayed at the time:
In less than two months, the US economy would be in recession. |
The Regular Conundrum, 1997-2001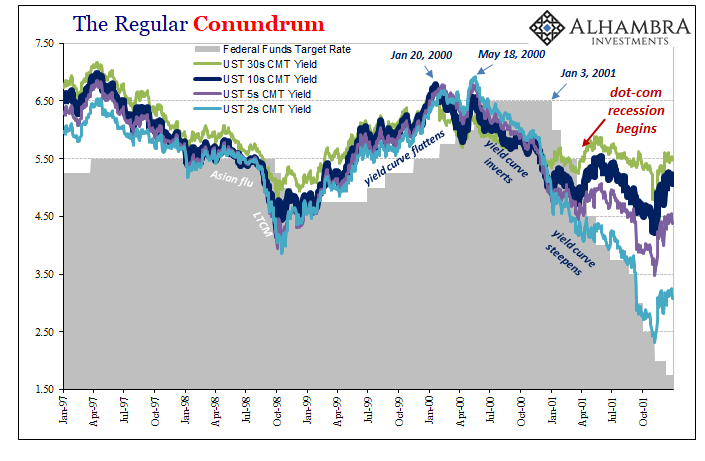 - Click to enlarge |
| I’ve recently compared the current trend in the yield curve to the “midpoint” action during the 2008 crisis not because I believe we are repeating that crisis, rather it was because that was the last time there were rate cuts. These are more universal traits and patterns we are interested in harvesting and analyzing which can be observed across any number of historical business cycles.
The 2001 recession is another good example. The yield curve of 2000 distorted sharply and inverted (meaning not just in the 2s10s but at often several interior points along it), central bankers denied anything was wrong (the last rate hike in May), and then after typically many months they finally caught up to the bond market; literally behind the curve. The rate cuts never signal avoiding the recessionary case; they often confirm what the bond market had already predicted. What Jay Powell will tell you today, however, is that he and the rest of the FOMC aren’t wary like Greenspan in late 2000. |
US Treasury Yield Curve, 1998(see more posts on US Treasury yield, ) - Click to enlarge |
| No, Powell is more like the maestro of 1998. That’s the “mid-cycle adjustment” he keeps referring to. Just a bit of a slowdown requiring a very minor alteration in the short rate environment which will keep the good times rolling.
The stock market right now seems to be thinking that way, too. What about bonds in ’98? Very different story. As far as the yield curve (eurodollar futures, too) was concerned, it wasn’t the same at all. The curve twisted a little bit, but never really got deep into inversion and even then never more than a few bps at any point along the curve. Bonds were saying the Asian flu was serious, but the prognosis for the actually booming US economy was only ever mild concern. There was never any bond curve conviction about the downside. There was too much obviously going right in the economy. And then Greenspan came in with three rate cuts beginning late September 1998 and all was practically forgotten. |
US Treasury Yield Curve, 2018-2019(see more posts on US Treasury yield, )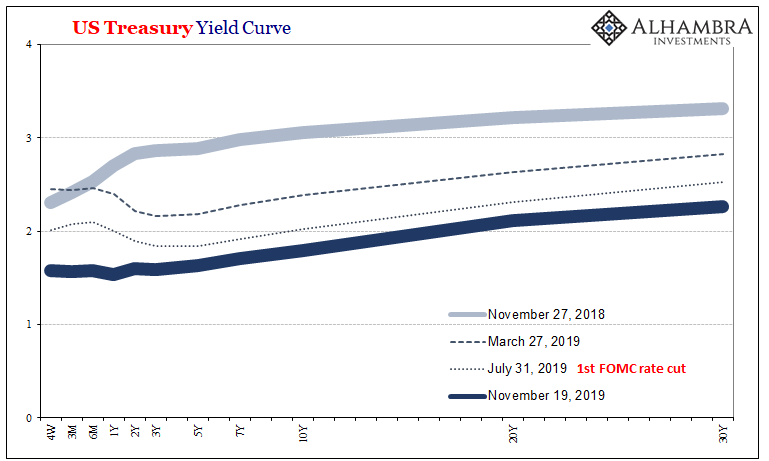 - Click to enlarge |
| In fact, as the curve went, the whole thing wrapped up in about six months; really less than that. By the time the last of those mid-cycle adjustments was made in November 1998, nominal rates were already moving higher on a practically uninterrupted trajectory.
Whether or not we believe Greenspan’s actions made any difference at all (I personally hold serious doubts given other monetary factors of that time, such as the rip-roaring eurodollar system already pushing US housing into overdrive), that’s where all the similarities end. The only comparison then to now is the single number three. The yield curve today has been twisting and inverted for about a year ongoing, and only recently has it received serious consideration anywhere outside of the rest of the bond market. Its progression looks very different from how it went twenty-one years ago, especially since the broader market continues to suggest there’s more coming. We’ve not seen the end of whatever it is that’s going on right now. While it wasn’t at all clear in ’98, it was by the end of ’01: rate cuts didn’t really mean what we they were supposed to mean. Just three of them, totaling all of 75 bps, had allowed the US economy to avoid recession the prior time whereas 11 cuts by the end of ‘01, totaling 475 bps, couldn’t keep one from occurring? In other words, forget the rate cuts. |
The Regular Conundrum, 2016-2019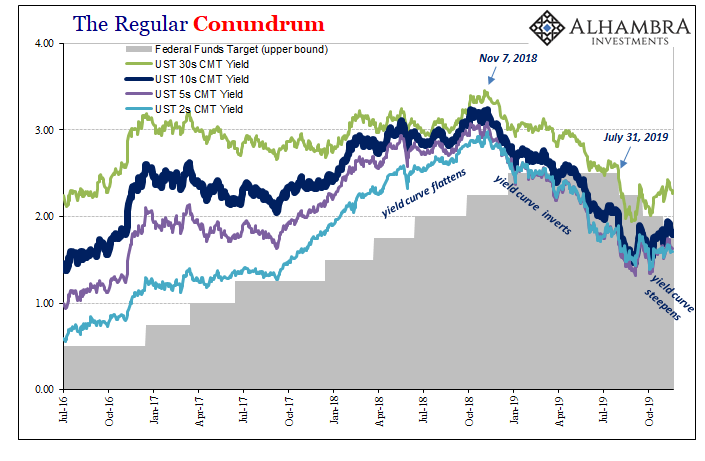 - Click to enlarge |
| It’s not about the cuts. It’s about everything else going on, the whole climate. That’s what ultimately mattered back then, in both cases, and will ultimately matter today.
Rate cuts are little more than small medicine to soothe nervous feelings, especially as they might develop from time to time over at the NYSE. Jack Welch was cheering Greenspan’s “aggressive action” just before the recession began but by the time it was reaching its end, in November 2001, Greenspan didn’t seem so powerful to GE’s boss anymore.
|
The Real GDP Problem, 1988-2018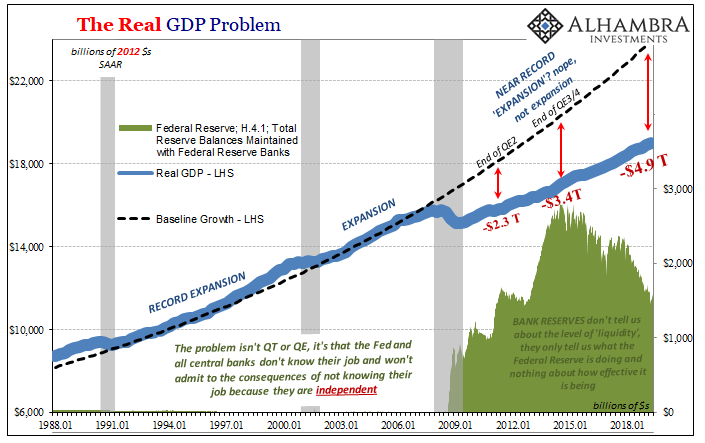 - Click to enlarge |
| If you had a traditional problem, this would be a layup. You’d put the stimulus packages in, you’d do the things you had to do, and you’d get this economy going sometime, who knows, second quarter, third quarter of next year. But we don’t have a normal time. We have an unpredictable time, with not only an economic recession but also a psychological recession.
Why did what was a really mild recession feel so abnormal to the guy? The enormous “stimulus” of all those rate cuts just didn’t seem to be having any positive effect. And they wouldn’t over the next few years, either, as what defined the era of the early 2000’s wasn’t so much that small recession as it was the real lack of traditional recovery. The eurodollar had completely taken over by then, which for the US economy meant Ross Perot’s “giant sucking sound” of industrial jobs being offshored, replaced mostly by the enormous expansion of finance and debt. That’s not a real recovery, which Greenspan tacitly acknowledged by moving the fed funds target down to 1% a year and a half after the dot-com recession had ended. Thus, you can’t even compare the climate of today’s economy with that of twenty-one years ago let alone any actual specifics. Even the Fed doesn’t really believe it (R*) no matter what Powell says. There is nothing about 2019 which should remind anyone of 1998. Especially the curves since the bond market understands and factors the huge difference. |
Benchmark 10-year UST, 2001-2019 - Click to enlarge |
Full story here Are you the author?
Tags: Alan Greenspan,Bonds,currencies,economy,Federal Reserve/Monetary Policy,Interest rates,jay powell,Markets,rate cuts,recession,U.S. Treasuries,US Treasury yield,Yield Curve