| While the world’s attention was fixated on US$ repo for once, the Bank of Japan held a policy meeting and turned in an even more “dovish” performance. Likely the global central bank plan had been to combine the Fed’s second rate cut with what amounted to a simultaneous Japanese pledge for more “stimulus” in October. Both of those followed closely an ECB which got itself back in the QE business once more.
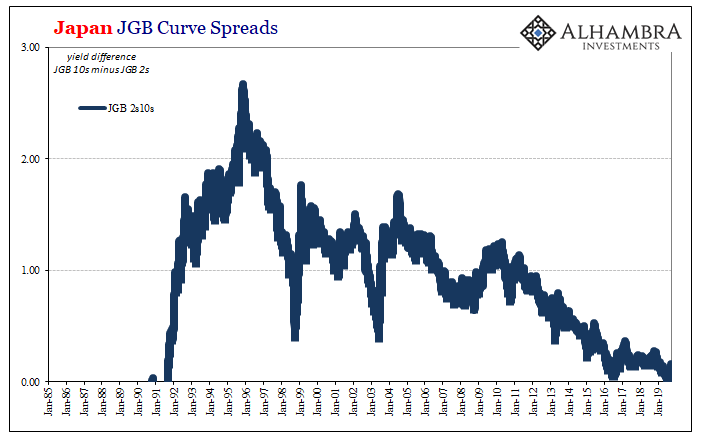
But all that likely coordinated “accommodation” was spoiled once the fed funds rate poked well above what the Fed supposedly allows for it. It raised uncomfortable questions for all these central bankers – no longer what will you do, what can you do? Together with concerning economic data in Japan that just keeps coming, no wonder the BoJ decided it wouldn’t wait for its regular meeting to announce…something. The Japanese began this week by pinging the JGB curve. Officials don’t like how close it had come to inverting (in the 2s10s), though in this crazy environment what would an inverted JGB curve actually mean? |
Japan JGB Curve Spreads, 1985-2019 |
I considered that question early last month. Nothing good, I assure you, and for much more than just this one country.
The reason Argentina may be relevant is because the JGB market is a reflection of much more than what might be coming down the road at Japan. It makes sense, therefore, that Japanese central bankers would try something to disrupt the JGB curve inching inexorably toward upside down. It’s already significantly negative to begin with. Inverting while negative, that’s entirely new territory. |
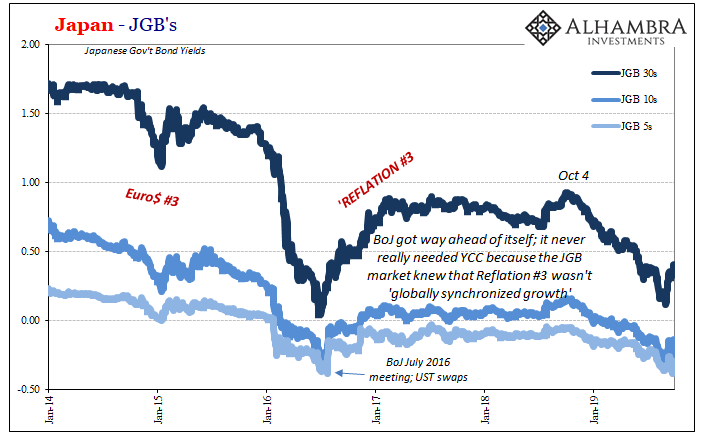
Japan JGB's, 2014-2019 |
| By saying the central bank would reconsider its purchases (under a QQE that will never end) at the longer maturities, authorities were making a statement about the curve itself. As things go wrong, they want to instead project something, anything that could be taken as a positive. A steeper rather than inverting curve.
This is what I mean when I say they need to stop trying to send facetious messages through the curves and start listening to what they are instead saying about the true state of the world.
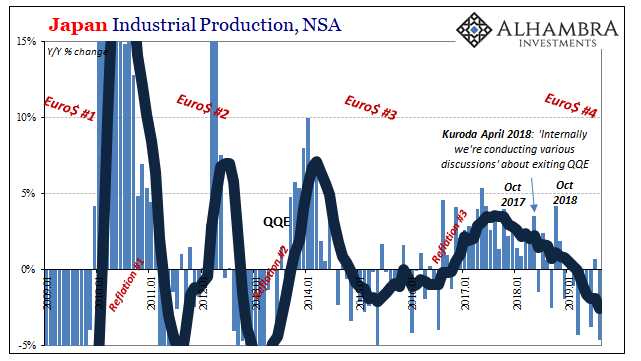
It is global risk and that’s what we find in the Japanese economic accounts. |
Japan Industrial Production, NSA 2009-2019(see more posts on Japan Industrial Production, ) |
| Officials really did mistake globally synchronized growth for something meaningful, and bought heavily into it at the same time this global downturn was already showing up in their own backyard. They missed the transition out of Reflation #3 into Euro$ #4 because they didn’t see it as the limited reflation that it really was.
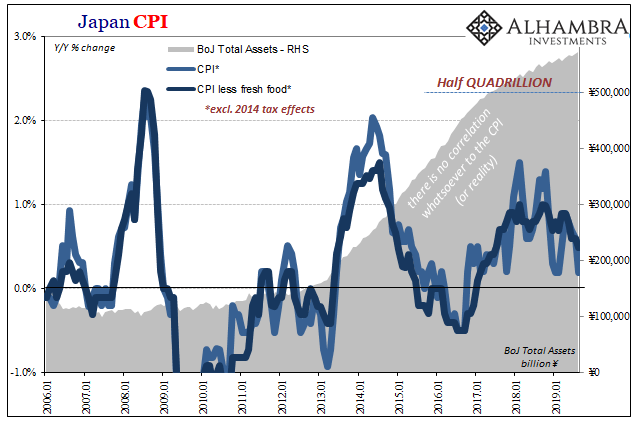
Instead of ending QQE as was the plan as late as April and May 2018, the BoJ will be ramping it back up again perhaps with even more negative NIRP alongside. It was nothing more than emotional desire, the need to be vindicated in Japan after 23 QE’s (by my count) and closing in on ¥600 trillion in assets. And it was the bond market which told them to reconsider. JGB’s most of all. The JGB curve never really moved; there was no need for YCC in the first place. |
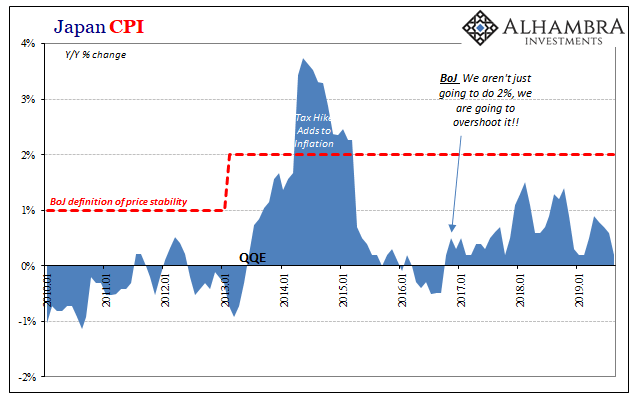
Japan CPI, 2006-2019(see more posts on Japan Consumer Price Index, ) |
And now it is being totally flipped upside down because even authorities know the global economy is in big trouble. As I wrote on Monday about how truly absurd the BoJ’s latest haphazard plans really are:
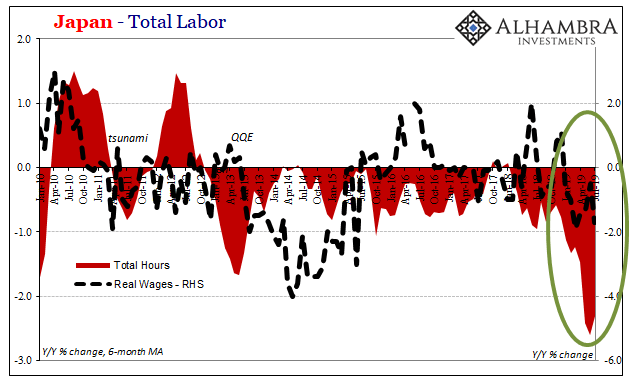
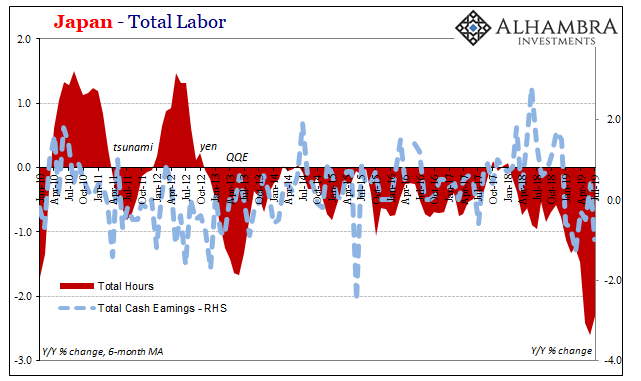
Inflation to industry to labor. |
Japan CPI, 2010-2019(see more posts on Japan Consumer Price Index, ) |
| Japan’s economy is deep into Euro$ #4. That means a lot for more than Japan. Even Japanese central bankers know it. |
Japan Total Labor, 2010-2019 |
Japan Total Labor, 2010-2019 |
Full story here Are you the author? Previous post See more for Next post
Tags: Bank of Japan,Bonds,CPI,currencies,economy,Euro$ #4,Federal Reserve/Monetary Policy,globally synchronized growth,Government Bonds,industrial production,inflation,Japan,Japan Consumer Price Index,Japan Industrial Production,JGB,Labor Market,Markets,newsletter,real wages,total hours worked


