


Keith Weiner
My articles My offerMy siteAbout meMy videosMy books
Follow on:LinkedINTwitterSeeking AlphaFacebookAmazonGoogle +
At a shopping mall recently, we observed an interesting deal at Sketchers. If you buy two pairs of shoes, the second is 30% off. Sketchers has long offered deals like this (sometimes 50% off). This is a sign of deflation.
Regular readers know to wait for the punchline.
Manufacturer Gives Away Its Margins
We do not refer merely to the fact that there is a discount. We are not simply arguing that Sketchers are sold cheaper—hence deflation. That is not our approach. Let’s look beneath the surface, and drill deeper.
Sketchers makes the sort of shoes that you wear frequently, especially for exercise. They are not made to last forever, and not haute couture that will be worn once every blue moon. If the customer likes the Sketchers styling and they fit well (e.g. for wide feet), then he will be back to buy the next pair in three or four months.
Sketchers already has good pricing. They don’t need to cut prices further simply to win market share from leaders like Nike. And anyways, a discount on the second pair is not exactly designed to beat competitors on price. It is designed to do something else. To attach a second sale to the first.
It is curious that Sketchers is willing to give away money to achieve this goal. We say give away money, because Sketchers is likely to get the sale in a few months when the old pair wore out. The company has great distribution. Its marketing people know all this.
So 30% seems like a lot of margin to give away, perhaps the lion’s share. What is Sketchers gaining, for which it trades away its gross profit margin?
Manufacturer’s Preference
As an aside, we frame the question this way to make explicit that people express preferences in the market. If you buy a hamburger for $5, you are expressing a preference for the food than for the cash. If you don’t buy pears, but instead buy apples, you express your preference for apples over pairs. Perhaps the preference is due to the lower price of apples that day, or some other reason such as baking a pie. No matter, every day every participant expresses his preferences in the market.
Sketchers is expressing its preference for cash over higher margins. Its debt does not look particularly heavy (though we are not equity analysts). So it’s not necessarily the desperate grasping for revenue straws to service its debt. However, even companies who don’t borrow up to the hilt get caught up in the same dynamics:
Borrow to build more capacity, sell more goods to utilize it, and service debt
The Iron Law of Volume
If Sketchers can make 50 million pairs of shoes (a SWAG for Sketchers revenue of $4.7 billion annual), then the cost per pair is lower than if its capacity is only 5 million. This same principle applies to sales too. If each store sells 20,000 pairs then the cost to sell each pair is lower than at 2,000 pairs.
The catch is that company has to sell 50 million pairs of shoes. Sketchers’ motivation (we assume, we are not privy to any particular information from the company) is to keep the factories operating at full capacity, keep the shoes flowing, and feed revenue to the hungry maw of its manufacturing and distribution machine.
Sketchers, in particular, may not be frantically servicing debt, but it is having the same net effect. And it is competing with companies who do have that debt load. It is obliged to play the same game. Sketchers, like its competitors, is pushing down the bid on shoes.
To put this in common terminology, this dynamic is boosting the purchasing power of the dollar. Purchasing power, in this case, is 1 / S where S is the price of shoes. If you average the price of shoes with the price of apples and oranges and the price of petrol, etc., you get the dollar’s purchasing power.
As an aside, we object to the very notion of purchasing power, as a creature of Quantity Theory of Money Land. It implies that how much you can buy with a dollar is intrinsic to the dollar. As we see with Sketchers, that is not true.
Anyways, the discount on the second pair of shoes is well-designed for the goal of increased unit volume, and not directed towards a simple price war against Nike. It does indeed motivate customers to increase their volume (Keith bought a second pair at the store).
So Sketcher prefers revenue to profit margin, as it runs its production at capacity. And it pushes down the bid price on shoes. Folks, this is the exact opposite of the 1970’s bout of inflation.
Consumer’s Preference
The customer is also expressing a preference. We could miss the action if we said the customer prefers a discount. But that is not really what is going on.
Suppose Sketchers offered a discount of 1% to buy a second pair. Presumably no one would take them up on the offer. Sketchers knows this (and has probably even test-marketed it). Also the same at 2%, and so on. So it’s not a mere discount, and that is not quite the preference expressed by consumers anyways.
It is telling that Sketchers was obliged to go up to 30% (they have offered 50% at times). This is the number that its marketing department determined the marginal shoe-buyer would prefer strongly enough to buy a second pair.
This shows us a lot about this customer. We have already established that Sketchers products are wear items. Customers have to go back and buy another pair sooner or later. Yet it takes a large discount to make them buy two pairs at once!
The customer is expressing a strong preference to keep his cash, over getting a second pair of shoes that he will need in a few months anyways. Even at a discount. The preference is strong enough that the shoe company has to give up a huge chunk of its profit margin to get the customer to buy a second pair, against his propensity. This is extraordinary.
So while the shoe seller expresses its preference for cash over margins, the shoe buyer expresses his preference for cash over a shoe he won’t need for three months. And only by the former discounting the price considerably, will the latter be reluctantly induced to part with (less) cash for the second pair.
Did we say this is extraordinary?
Demand for Money
We are not particularly fans of the whole idea of demand for money, as we write that money has non-declining marginal utility. But here is an interesting dynamic. Both seller and buyer have strong preferences for cash. The former needs it to feed a fast-moving belt, moving from rubber to pavement, cranking out sneakers. The latter needs it for, whatever it is that wage-earners save cash for.
This may mean that the wage-earner does not necessarily have the cash to buy shoes he will wear in 3 months—i.e. he is living paycheck to paycheck. Or else it means that he prefers to have a higher bank balance, rather than a higher shoe-closet balance.
This is another precise opposite of the 1970’s. We wrote about the Lazy 1970’s vs the Frenetic 2000’s. Back in the 1970’s, people preferred a pantry full of tuna fish cans to a bank account full of dollars. Not today. Another way to think of this is to compare the marginal utility of cans of tuna fish, or Sketchers sneakers, to the marginal utility of dollars. In the 1970’s, the marginal utility of canned food fell slower than the marginal utility of the dollar. Talk about extraordinary! Today, that has reversed.
Perhaps the consumer is struggling under his own debt burden. Just as the shoe companies have played the game of increasing the discount until they get takers, so have the banks. They have kept lowering the cost of credit, until nearly everyone has jumped in to the debtors’ pool. Those with debt have a greater need for a larger cash buffer than those who live debt-free. It is not so different for a consumer as for a corporation.
Deflation
Whatever the reason, both parties have a strong preference for cash over the marginal pair of shoes. So the producer has to up the incentive to take the extra pair.
We submit, for your consideration, that this is evidence of a deflationary era. Gold bugs can insist that the inflation statistic is a lie. Monetarists can fret over the increase in the quantity of what’s called money so far, and what they anticipate is coming in response to the next crisis.
We will end with a quote often falsely attributed to Milton Friedman. However, the principle is true.
“If you put the federal government in charge of the Sahara Desert, in five years there’d be a shortage of sand.”
We have put the government in charge, not of sand nor corn nor steel. But of money. And as we see from the Sketchers’ story, there’s quite a shortage (notwithstanding the gross quantity of it).
Isn’t it time to rediscover and return to a free market for money and credit? The gold standard. That’s what Monetary Metals is aiming towards, with our radical idea of paying interest on gold.
Supply and Demand Fundamentals
The price of gold moved up another $16, and the price of silver was +$0.14.
We just want to offer three thoughts about the markets this week. One is: “wow!” Look at the interest rate in the US drop. Remember when the ten-year Treasury was “breaking out” over 3%? Now, look at it. 1.5%. It’s nearly back to its all-time low set a few years ago.
It will fall farther than that, ere the end.
Next, a common meme we are seeing in the gold community is that people are losing confidence in central banks and their toilet-paper currencies. Not yet, they aren’t (notwithstanding Argentina and its ilk). When it happens—it will, but today is not that day, as our old friend Aragorn would say—you will observe permanent gold backwardation. That is, the cobasis on every futures contract from near to the farthest reaches of the board, will be well above zero. And rising. And the price of gold will be rising, probably exponentially. With each uptick in price, the cobasis will climb higher.
We will be not only chronicling that, when it happens, we will be bellowing it from the rooftops!
Three, much is being said that lower interest rates are a driver for higher gold prices. We have documented in the past that there is not a simple correlation between interest (either short-term, or the yield on the long bond) and the price of gold. It’s something else.
Like with most other macroeconomic variables, one cannot simply ask “where is the threshold?” It does not work that way. There is no magic debt-to-GDP number that guarantees collapse, much to the embarrassment of those who used to promote this hypothesis. There is no magic quantity of dollars that causes skyrocketing prices. And no magic interest rate, that drives up the gold price.
What we need is a spread, or a ratio.
We should compare the market interest rate to marginal time preference. As the Sketchers story illustrates, time preference today is much lower than it was in the 1970’s. In the 1970’s, people wanted real goods even to the point of filling their pantries full of canned food they wouldn’t eat for years, so desperate were they for real goods. 10% (or more) in the bank was no temptation for them to park their dollars. So we say time preference was very high indeed.
Today, it’s the opposite. Even for zero interest earned in a bank account, people prefer that to a discounted pair of shoes they are certain to use in a few months. So we say time preference is low.
That’s why the low rate of interest is not driving the price of gold to the moon.
Of course, not everyone has the same preferences. Some have a higher time preference. That’s why the price of gold is $1,500 for the first time in years.
Monetary Metals is excited to be bringing the first gold bond to market. Please contact us if you are interested in investing.
Gold and Silver PriceNow let’s look at the only true picture of supply and demand for gold and silver. But, first, here is the chart of the prices of gold and silver. |
Gold and Silver Price(see more posts on gold price, silver prices, )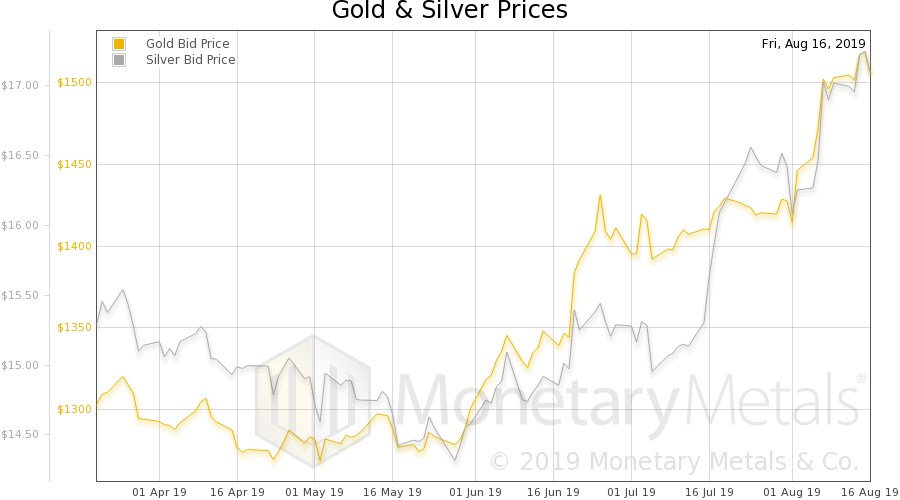 - Click to enlarge |
Gold: Silver RatioNext, this is a graph of the gold price measured in silver, otherwise known as the gold to silver ratio (see here for an explanation of bid and offer prices for the ratio). The ratio inched up this week. |
Gold: Silver Ratio(see more posts on gold silver ratio, )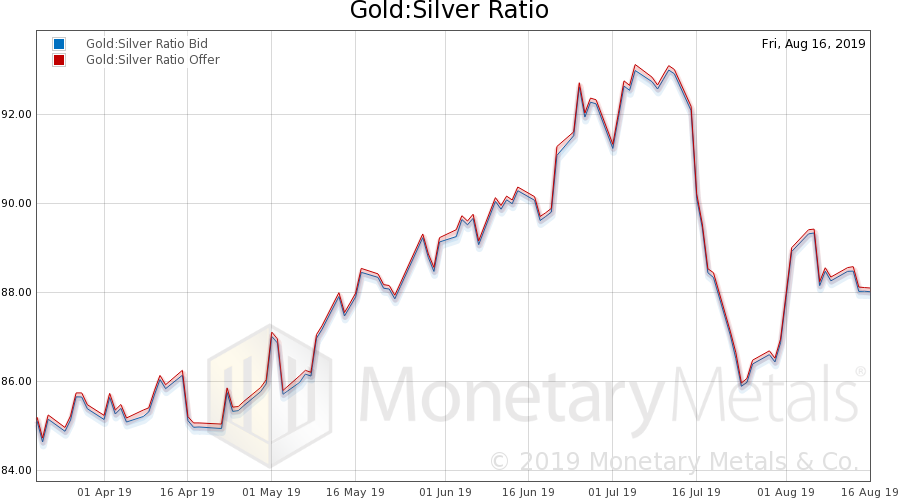 - Click to enlarge |
Gold Basis and Co-basis and the Dollar PriceHere is the gold graph showing gold basis, cobasis and the price of the dollar in terms of gold price. We see a small rise in scarcity (i.e. cobasis), along with a small rise in price. The move continues to be driven by buying of physical metal. This week, the Monetary Metals Gold Fundamental Price went up further, to $1,516. |
Gold Basis and Co-basis and the Dollar Price(see more posts on dollar price, gold basis, Gold co-basis, ) - Click to enlarge |
Silver Basis and Co-basis and the Dollar PriceNow let’s look at silver. The scarcity of silver appears to be up. But keep in mind that the September silver contract is nearing expiry. And it is subject to temporary backwardation, due to selling pressure from all the naked longs who must roll their positions. There is a (smaller) rise in the silver basis continuous too. The fundamental price moved up again, to $16.93. |
Silver Basis and Co-basis and the Dollar Price(see more posts on dollar price, silver basis, Silver co-basis, )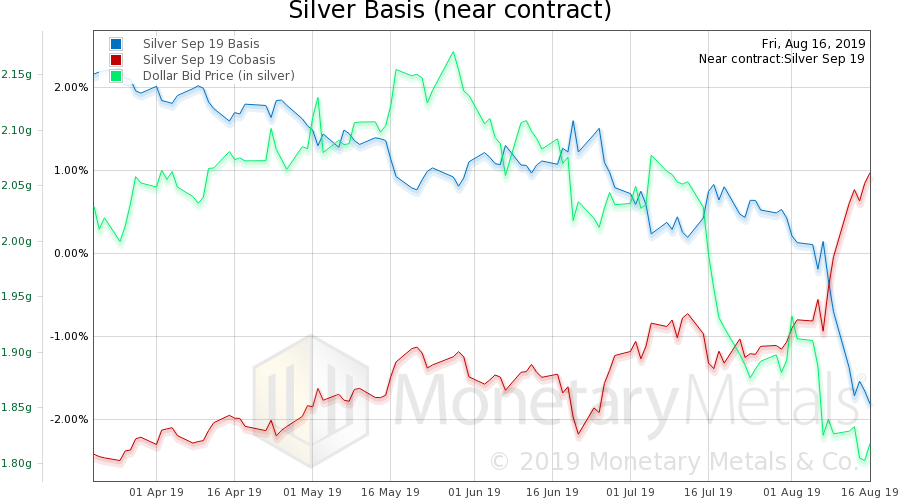 - Click to enlarge |
© 2019 Monetary Metals
Full story here Are you the author?Tags: Basic Reports,Deflation,dollar price,gold basis,Gold co-basis,gold price,gold silver ratio,newsletter,silver basis,Silver co-basis,silver prices


