


Jeffrey P. Snider
My articles My offerMy siteAbout meMy videosMy books
Follow on:LinkedINTwitterSeeking Alpha
| Quick review: stocks hit a bit of a rough patch right during the height of inflation hysteria. At the end of January 2018, just as the US unemployment rate had finally achieved the very center of attention, global markets were rocked by instability. Unexpectedly, of course.
Over the next several weeks, share prices sagged and people blamed it on a number of things: Korean War, the unemployment rate itself (the economy was going to be too good, the Fed would have to hike rates faster and farther), Italian populists, FOMC officials thinking it was T-bills or something. |
Eurodollar Futures Curve 2018(see more posts on EUR/USD, )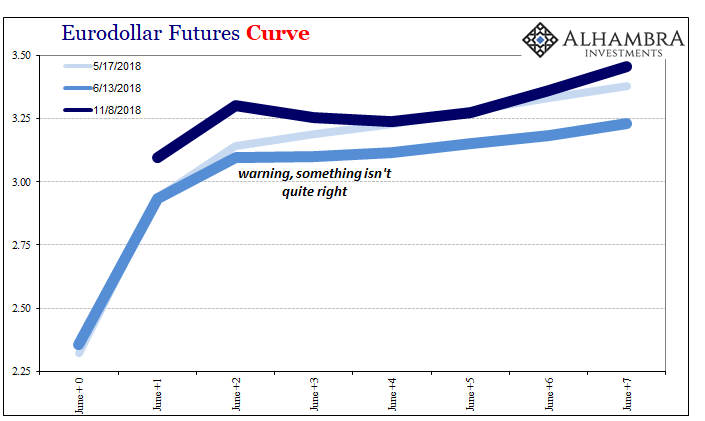 - Click to enlarge |
| Then, global stock markets shook off everything and marched ever higher. Meanwhile, the dollar turned, EM’s spun out of control, and bond markets began to do odd things. Curves, already flat, became downright distorted. All the while, these were ignored on CNBC.
It wasn’t until early October, after several months of being warned, that share prices were made to confront this underlying ugliness. Over those same months, the global economic narrative shifted, too: from boom, to decoupling, to “concerns” about “softness.” |
Eurodollar Futures June 2020(see more posts on EUR/USD, )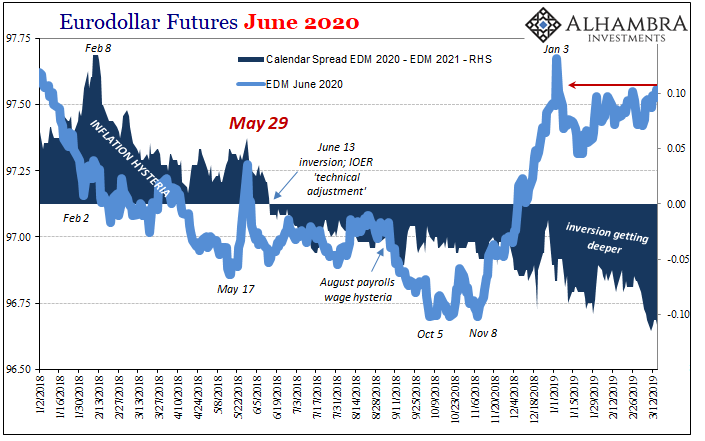 - Click to enlarge |
| The process seems to be repeating. Since Christmas Eve, US market indices in particular have been moving almost straight up, undeterred by economics. Nothing can seem to dent the comfort of this Fed pause and global renewed dovishness.
Meanwhile, bond markets are even odder. Many curves are back to where they had been in early January when everyone was so shaken up. Some key places, even worse (the 5-year note traded for much of the day a few bps below EFF again). Convergence the last time was to where bonds (and eurodollar futures) were heading, not stocks and a global boom. |
Eurodollar Futures Curve 2018-2019(see more posts on EUR/USD, ) - Click to enlarge |
| There is no discernible benefit from a Fed pause here. If we go back and review this bond/money market history of the last year or so, the trend is still going. At first small warnings. A little distorted, a little bigger warning. Then some more. And more. Now even more. |
US Treasury Curve(see more posts on US Treasury, )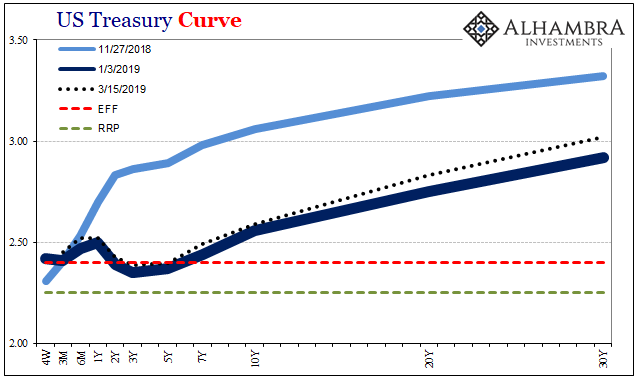 - Click to enlarge |
Tags: Bonds,currencies,economy,EUR/USD,eurodollar futures,eurodollar futures curve,Federal Reserve/Monetary Policy,Markets,newsletter,U.S. Treasuries,US Treasury,Yield Curve


