Most of the world’s financial centers are closed for the May Day holiday, but the lack of participation has not prevented the extension of the US dollar’s recovery. The Dollar Index has traded above its 200-day moving average for the first time in a year. No new catalyst has emerged. The widening interest rate differential in the dollar’s favor over Germany, for example, is unprecedented. Just like Fed officials can be more confident that their mandates are within reach (than it was before and more than the other major central banks), so too are investors.
Last week’s losses saw the euro reached the 50% retracement objective of the most recent leg up that began last November. It was found near $1.2055. The lower Bollinger Band is found near there today. The 61.8% retracement is near $1.1935 and to see that, the euro needs to go through the 200-day moving average near $1.2015, and a 712 mln euro option that expires today struck at $1.2020, and below the psychologically important $1.20 level.
The softer than expected April manufacturing PMI (53.9, a 17-month low. from a revised 54.9 in March and forecasts for 54.8) has encouraged sellers to push sterling through the March 1 low near $1.3710. That was neckline of a possible double top pattern that projects into the $1.30-$1.31 area. Sterling is falling for the fifth consecutive session and the 10th of the past 11. Sterling had fallen through the 100-day moving average(~$1.3870) at the end of last week for the first time since last November. The 200-day moving average is near $1.3535.
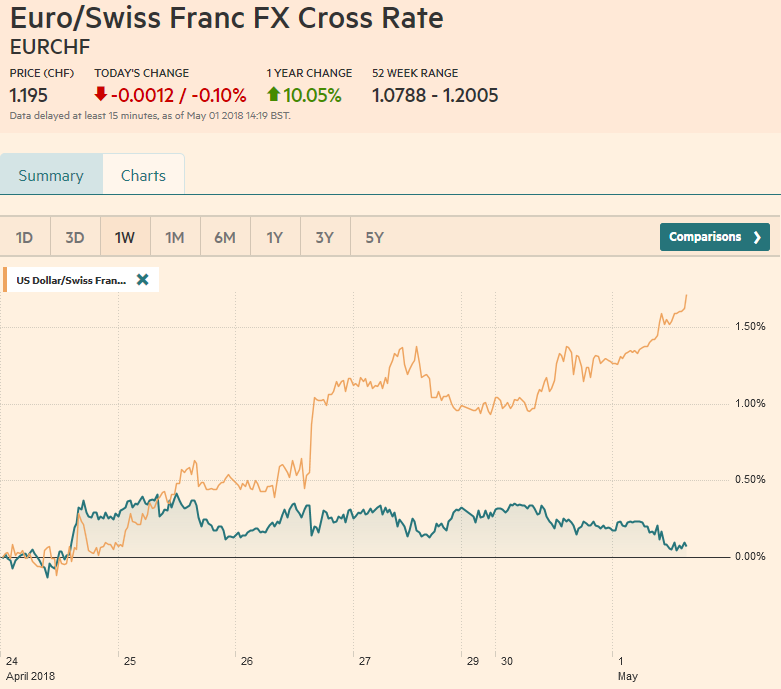
Swiss FrancThe Euro dropped at 1.195 CHF. |
EUR/CHF and USD/CHF, May 01(see more posts on EUR/CHF, USD/CHF, ) Source: markets.ft.com - Click to enlarge |
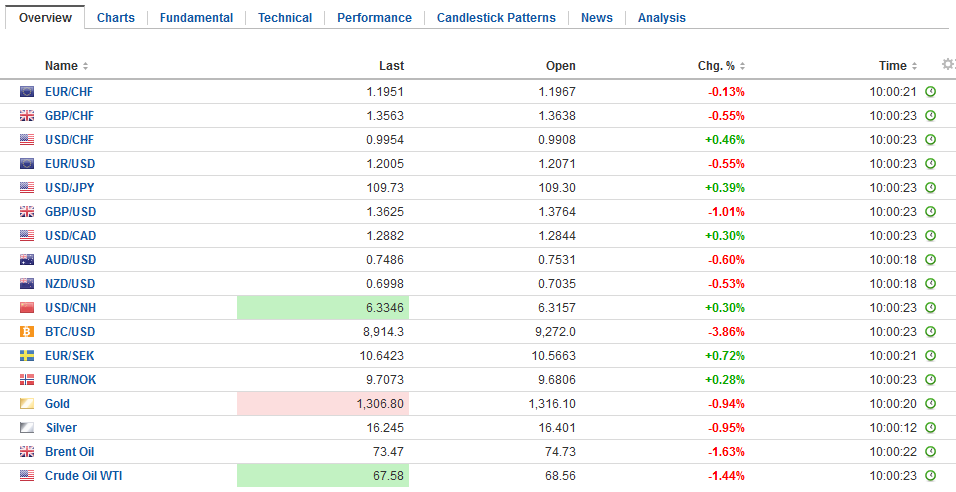
FX RatesSterling’s slide has helped fuel a recovery in the FTSE 100. The benchmark has risen in 10 of the past 11 sessions to reach a three month high. It rose 6.4% last month. The perceived odds of a BOE rate hike next month continue to be pared back. The 40% chance that was implied by the OIS a week ago has fallen below 20% now. Japan’s markets re-open today after yesterday’s holiday and will be closed Thursday and Friday. The dollar has edged cautiously through the JPY109.50 area. The JPY110 area is psychologically important and is the measuring objective of the head and shoulders bottom pattern that had been formed in March. There is a $760 mln JPY109.30 option that expires today, which could come back into play if the dollar’s momentum stalls here as it has over the past several days. The dollar overcame the 100-day moving average last week (~JPY108.80). The 200-day moving average is near JPY110.25. Note that the US 10-year premium over Japan is just shy of 300 bp and is near the largest in more than a decade. It is encouraging the purchases of US debt on an unhedged basis at the start of the new fiscal year. There was no doubt in the market’s mind that the Reserve Bank of Australia was going to keep policy steady today. And it did. With employment growth slowing and inflation (headline and core) a little below the 2-3% target range, policy is expected to be on hold until the end of the year. The wider interest rate premium of the US over Australia is partly a function of Fed expectations and partly a shift in the outlook for the RBA. The Australian dollar is down for its eighth session of the past nine. It is making new lows for the year today to test the $0.7500 level seen last December. A break of the $0.7480 area could target $0.7325. The Canadian dollar is faring the best against the US dollar today as it continues to consolidate last week’s losses. The US dollar approached the 61.8% retracement of its decline from mid-March through mid-April, which is found near CAD1.2900. A move above there would target CAD1.30 and the year’s high near CAD1.3125.
|
FX Daily Rates, May 01 |
| With hours before the exemptions to the steel and aluminum tariffs for Canada, Mexico and Europe were set to expire, the US announced a one-month extension. The US has offered a permanent exemption for countries accepting a quota (roughly 90% of recent exports). Voluntary export restrictions (VERs) were used against Japan in the 1980s, but since GATT became the WTO, this practice was prohibited. Nevertheless, Argentina, Brazil, and Australia have apparently struck agreements for which details are expected to be announced shortly.
NAFTA talks will resume May 7. The US has floated a new twist on domestic content. It is proposing that 40% of cars and 45% of pickup trucks must be accounted for by labor that is paid at least $16 an hour. Non-production jobs, like engineering, research, sales, software development and the like could account for as much as a third of the requirement. The proposal is clearly directed to Mexico, where research by the Center for Automotive Research has been cited in the press estimating assembly-line autoworkers earn no more than $6 an hour and less than $3 an hour in the auto parts industry. |
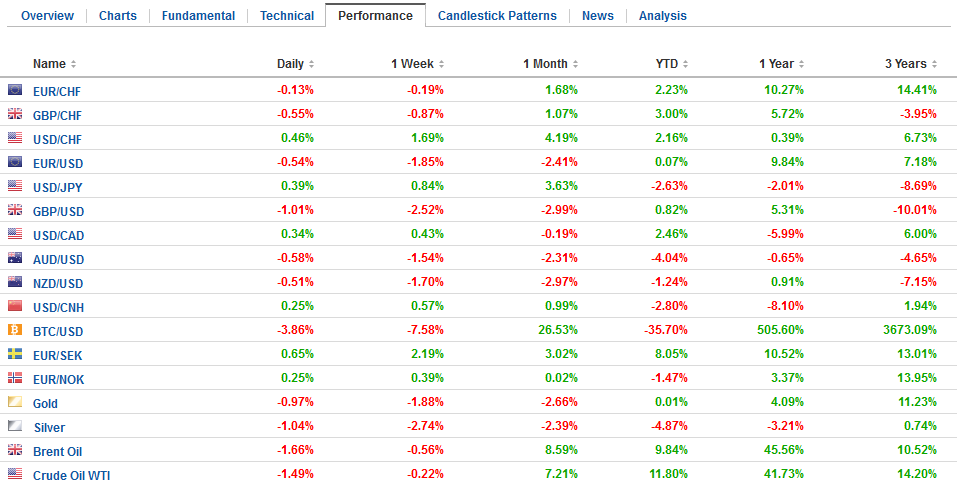
FX Performance, May 01 |
United StatesThe US is also proposing rapid adoption. The original NAFTA allowed for up to an eight-year transition. The US wants the pick-up truck agreement to come into force in two years and autos in four. US officials proudly point to the 2.5% tariff on imported autos as evidence of its embrace of free-trade. Pick-up trucks enjoy much more protection. There is a 25% tariff on imports pick-ups. The US reports April auto sale figures. They are expected to have slowed to a 17.1 mln seasonally adjusted annual rate from a 17.4 mln pace in March. A weaker than expected report will suggest that the consumer pullback in Q1 has continued. Recall personal consumption rose 1.1% in Q1 18, the weakest since Q2 13, and down dramatically from the 4.0% increase in Q4 17. That said, given the Fed and market’s confidence, any disappointing data is likely to be shrugged off as transitory or not reflective of the economy’s underlying strength. How the S&P 500 trades around last week’s gap may set the near-term tone. The benchmark opened sharply higher last Thursday, leaving a gap in its wake that is found between 2645.3 and 2647.2. The 200-day moving averaged has been frayed several times in the first four months of the year, but it held on a close basis except once. It is found near 2612.3. |
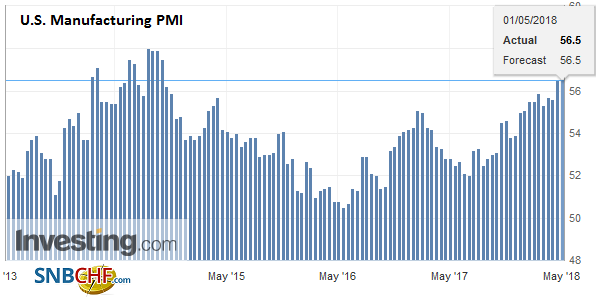
U.S. Manufacturing PMI, Apr 2018(see more posts on U.S. Manufacturing PMI, ) Source: investing.com - Click to enlarge |
Graphs and additional information on Swiss Franc by the snbchf team.
Full story here Are you the author? Previous post See more for Next postTags: #GBP,#USD,$AUD,$CAD,$EUR,$JPY,EUR/CHF,newslettersent,SPY,U.S. Manufacturing PMI,USD/CHF


