Marc Chandler
My articles My offerMy siteAbout meMy videosMy books
Follow on:LinkedINTwitterSeeking AlphaAmazon
At the end of every quarter, the IMF publishes the most authoritative reserve data with a three-month lag. On Good Friday, the IMF published Q4 17 reserve holdings. A recent article on Bloomberg played up an economist’s forecast that euro reserves would increase by $500 bln over the next couple of years. A review of the reserve data may help us evaluate such a claim, which if true, could have important implications for international investors.
Let’s first review a few basics. The IMF COFER report is a high-level account of central bank reserves that includes level and curency allocation. However, not all central banks report the currency allocation of their reserves. Some countries regard this as a national secret. Other central banks are incredibly transparent and regularly publish the allocation of their reserves, such as the Swiss National Bank, which also lists the foreign equities it owns on its website. Allocated plus unallocated reserves equal total reserves.
Global reserves are reported in US dollar terms. It is the dollar value of those reserves that is tracked. The reserves are mostly held in interest-bearing securities. Given the relative volatility of currencies and bonds, the change in exchange rates can drive the changes in valuation separate from changes in quantities of holdings. The implication is that any analysis that does not take swings in valuation into account may produce misleading conclusions.
Two main forces have driven the changes in the reserves figures. First, for the past few years, China, which previously did not report the allocation of its reserves but has been doing so gradually, preserving some degree of confidentiality.
In late 2014, unallocated reserves accounted for a little more than 41% of total reserves, or about $4.841 trillion. As of the end of 2017, the unallocated share had slipped below 17% to stand at $1.860 trillion. We note that the $3 trillion decline largely matches the size of China’s reserves, suggesting that it may be nearly done sharing the allocation of its reserves.
Allocated reserves stood at $10.019 trillion at the end of 2017, which is a $373 bln increase on the quarter. The value of the unallocated reserves fell by $204 bln. The decline was likely along the line we suggested as China adopts the best practices. The IMF reports that overall reserves rose to $11.425 trillion, a $220 bln increase. From a bottoms up analysis, we conclude that this increase is largely a function of valuation adjustments and not a significant increase in demand for new reserve assets.
At the end of last year, 62.7% of the global reserves that were allocated were invested in dollars or $6.282 trillion, which the media reports is a four-year low. Reserves denominated in dollars increased by $156 bln on the quarter, and none can be attributed to the dollar’s exchange rate. Without pretending a precision we don’t have, suffice it to be said that price of US dollar debt fell in Q4 17. To get some sense of the magnitude, recall that the US 5-year yield (a rough proxy of central bank tenor, we assume) rose about 25 bp over the course of the quarter, which is something on the magnitude of 0.7%.
The dollar’s share of reserves has eased. It stood at 65.3% at the end of 2016 and 65.7% at the end of 2015. However, note that even if there is no change in the quantity of reserves, a shift in the exchange values can produce a change in the allocation. It appears that the dollar’s share of reserves don’t change as much as the exchange rate implies, confirming that central banks target the composition (efficient frontier or benchmark). Individual central banks may have different allocations, but the percentage reserves allocated to dollars appears steady, a little more than 60%.
The media frequently seems to play up the dollar’s share of reserves to the extent the subject is broached. However, given the US runs a current account deficit, it will have to import capital. That is the conventional way to express it, though, in my work, it often seems that large parts of the capital flows are the exogenous variable–i.e., trade flows help equilibrate capital flows rather than the other way around.
Central banks seem to step in mostly to fill the breach if and when the private sector can’t or won’t. Consider the situation from the perspective of a country with a large trade surplus. If the increased savings or capital implied by a trade surplus is not offset, a currency (or the price of assets in foreign currency terms) would appreciate.
Often the private sector will recycle the increase in savings by buying more foreign assets (portfolio and direct investment). However, sometimes the private sector’s efforts are insufficient. The re-cycling gap (like a funding gap) is filled by intervention where the central bank accumulates the foreign assets.
This is why some Treasury officials going back at least several years have been critical of foreign central banks accumulating Treasuries. Treasuries are accumulated, they argue, so that the currencies do not bear the burden of adjustment. This practice lends itself to the creation of large trade imbalances and protectionist backlash. Some economists argue that this foreign demand for US Treasuries keeps interest rates lower than they would otherwise be and fuels financial bubbles to which the US seems so prone (e.g., S&L, LTCM, Internet, the Great Financial Crisis).
The demand for new reserve assets, of which the dollar is likely to be around 60%, can be independent of the US savings and investment. A country that experiences an increase in trade, for example, may choose to have more reserves. Reserves are also understood relative to foreign debt obligations, especially those of a short-term nature. An increase of such obligations may encourage the accumulation of reserves. Some countries may want to increase their dollar reserves to manage their own money supply in pegged regimes (e.g., Hong Kong) or currency boards (e.g., Grenada), or a means of self-insurance as several Asian countries did post the 1997-1998 financial crisis.
The dollars held in reserves rose $780 bln from Q4 16 to Q4 17. On the face of it, the accumulation of dollar reserves more than covered the $466 bln current account deficit. But some of this increase is likely to reflect the shift of China’s reserves from unallocated to allocate, which does not represent a new accumulation of dollars. Unallocated reserves fell by almost $890 bln. If 60% of these reserves were allocated to dollars, it could explain nearly 70% of the increase in the dollar’s share of allocated reserves.
That would suggest new reserve demand for dollars may have increased by something around to $235 bln. Separately, it is interesting to note the Federal Reserve’s custody account for foreign central banks increased by $182 bln in 2017. A little more than half the world’s dollar reserves are held in custody by the Federal Reserve. The TIC data suggests that China’s holdings of Treasuries increased by $127 bln last year.
| The euro is the second most important reserve currency. At the end of 2017, the dollar value of euro reserves stood at $2.019 trillion. This represents an $85 bln increase for the quarter and a $408 bln increase over the course of the year. This sounds impressive and suggests the call for a $500 bln increase over the next two years may not be such a bold call.
However, part of the rise is going to be a function of the shift from unallocated to allocated reserves and the appreciation of the euro. If 20% of unallocated reserves were in euros, the shift to allocated reserves would explain nearly $180 bln of the $408 bln increase. The euro appreciated 14.2% against the dollar in 2017. If for simplicity sake was add that appreciation to the dollar value of euro’s reserves at the end of 2016, the swing, that would be worth about a $225 bln increase in euro reserves. The two factors–the shift to allocated reserves and valuation–explains nearly all ($405 bln) of the increase in the dollar’s value of euro reserves last year. As a percentage of allocated reserves, the euro share increased to 20.15% from 19.13% at the end of 2016. The euro’s share of global reserves has hovered around 20% for several years. The idea that there would a 25% increase, or $500 bln, in the dollar value of euro reserves, seems to be more likely a bearish view of the dollar, and recall that the OECD estimates the euro to be undervalued by about 8.8% on a PPP basis. Moreover, as noted, the unallocated reserves have fallen by $3 trillion since the Q1 2015, which is why it seems that China is nearly completed its multiyear project of reporting the allocation of its reserves. |
EUR/USD, April 11(see more posts on EUR/USD, )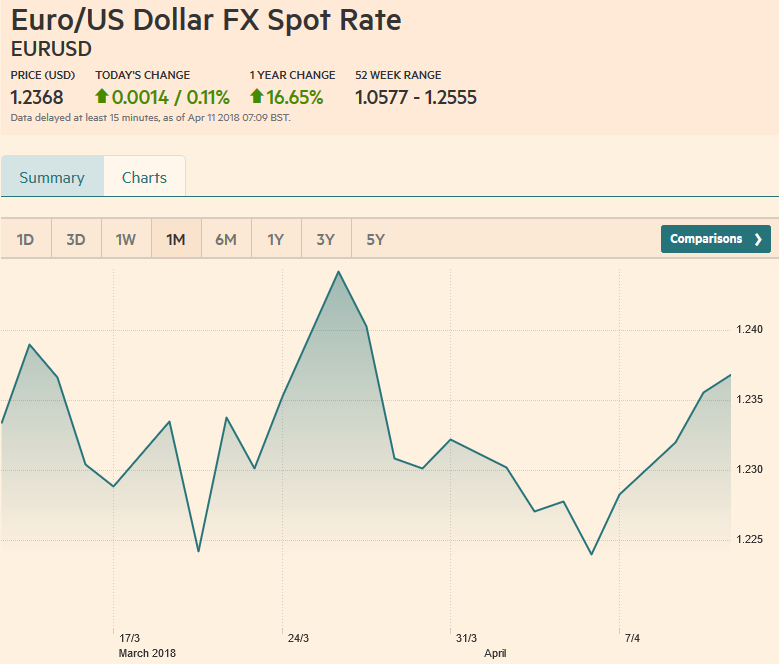 Source: markets.ft.com - Click to enlarge |
However, to think that foreign central banks will buy $500 bln of euro-denominated assets over the next two years would seem to ignore the glacial speed at which central banks change the allocation of reserves. Also, even if the ECB finishes its asset purchase program, it will still be buying a substantial part of new net issuance as it replaces maturing issues and the Stability and Growth Pact forces fiscal consolidation. Such a large increase in foreign official demand would pose significant challenges for the ECB’s attempt to normalize policy.
Such an increase in euro reserves does not do justice to the structural questions about the EMU project that do not appear to have been completely answered despite the broad economic expansion. The recycling of savings from creditors to debtors (or from trade surplus countries to deficit countries) that we described took place in Europe (between the North and South) before the 2010-2012 crisis (or the European phase of the Great Financial Crisis).
The recycling by the private sector within Europe does not appear to be working. Draghi’s demonstrated commitment to do whatever is necessary to preserve EMU reduces the risk of a country leaving the union, and this lowers the threat of devaluation. This, coupled with the ECB purchases and private investors hunt for yield, have encouraged demand for European peripheral bonds, but this appetite may change when the ECB stops buying, or the business cycle turns.
| The Japanese economy is the third largest in the world. The dollar value of yen reserves was $490 bln at the end of 2017, edging out the value of sterling’s reserves ($455 bln). That compares with $436 bln at the end of Q3 17 and $333 bln at the end of 2016. Of the $157 increase the dollar value of yen reserves last year, about $12.5 bln can be accounted for by the 3.8% appreciation of the yen and $40 bln from the shift from unallocated to allocated reserves (assumed 4.5% were denominated in yen).
The yen’s share of allocated reserves rose has risen steadily in recent year. It stood at 4.89% at the end of 2017 and 3.95% at the end of 2016. It was 3.75% at the end of 2015 and 3.55% at the end of 2014. There does appear to have been some increase in yen reserves. We would want to look closer at the accumulation of SNB reserves, as they allocate 8% of its reserves to the yen, nearly twice what the world does. We also suspect that China’s may have also had a higher share of yen in reserves. At the end of 2016, the OECD estimated the yen was roughly 17% undervalued. For the last 30 years, the yen has been overvalued but has been undervalued since the end of 2013. The yen appeared to reach an extreme just beyond 20% in 2015 and early 2016. The IMF began breaking the yuan out of allocated reserves in Q4 16. They stood at $90.8 mln. At the end of Q4 17, they had risen to $123 mln. About 20% of the increase can be explained by the 6.7% appreciation of the yuan against the dollar. There does appear to have been a marginal increase in yuan in reserves, but note its reserves are measured in hundreds of millions, while we have been discussing the dollar and euro in terms of trillions and yen in billions. The extremely slow take-up of yuan by central banks supports our judgment that its inclusion in the SDR was more a symbolic gesture than a significant catalyst of its internationalization. It was an acknowledgment of how far China has come rather than a spur to challenge the dollar. It also speaks to the gradual and cautious nature of central banks and why a significant shift in reserve allocations (e.g., a 25% or $500 bln increase in euro reserves independent of valuation) in a two-year period is unlikely. |
JPY/USD, April 11 Source: markets.ft.com - Click to enlarge |
| Lastly, we turn to reserves denominated in sterling. At the end of 2017, sterling reserves were worth $455 bln. This is an $89 bln increase after a $16 bln increase in 2016. Sterling accounted for 4.7% of allocated reserves at the end of 2015. Its share fell to 4.3% at the end of 2016 before recovering to 4.5% last year.
Sterling appreciated 9.5% against the dollar last year. This alone accounts for nearly $35 bln increase (of the $89 bln rise) in sterling denominated reserves. The shift from unallocated to allocated may have been worth another $9 bln of sterling’s increase. In 2016, when the UK voted to leave the EU, sterling fell a little more than 17%. The dollar value of sterling reserves increased, suggesting that reserve managers sought to maintain a certain allocation of sterling reserves. We are not convinced that sterling’s reserve status will change much initially after the UK leaves the EU. If it becomes less correlated with the euro, and/or if it diversifies its trade more, it might be a more attractive reserve asset. However, it punches well above its weight, and over time, its share in the SDR and as a reserve asset may shrink as its economy and its bond market are increasingly eclipsed by others. |
GBP/USD, April 11(see more posts on British Pound, ) Source: markets.ft.com - Click to enlarge |
Tags: #GBP,#USD,$CNY,$EUR,$JPY,$TLT,British Pound,EUR/USD,newslettersent