USD/CHFThe USDCHF pair shows sideways trading around the EMA50, noticing that the EMA50 shows clear negative signals on the four hours’ time frame, while the price settles below the intraday bullish channel’s support line that appears on the chart. Therefore, we will continue to suggest the bearish trend in the upcoming period conditioned by the price stability below 0.9440 level, noting that breaking 0.9373 is required to confirm the extension of the bearish wave towards 0.9186. Expected trading range for today is between 0.9300 support and 0.9460 resistance. |
USD/CHF, March 06(see more posts on USD/CHF, )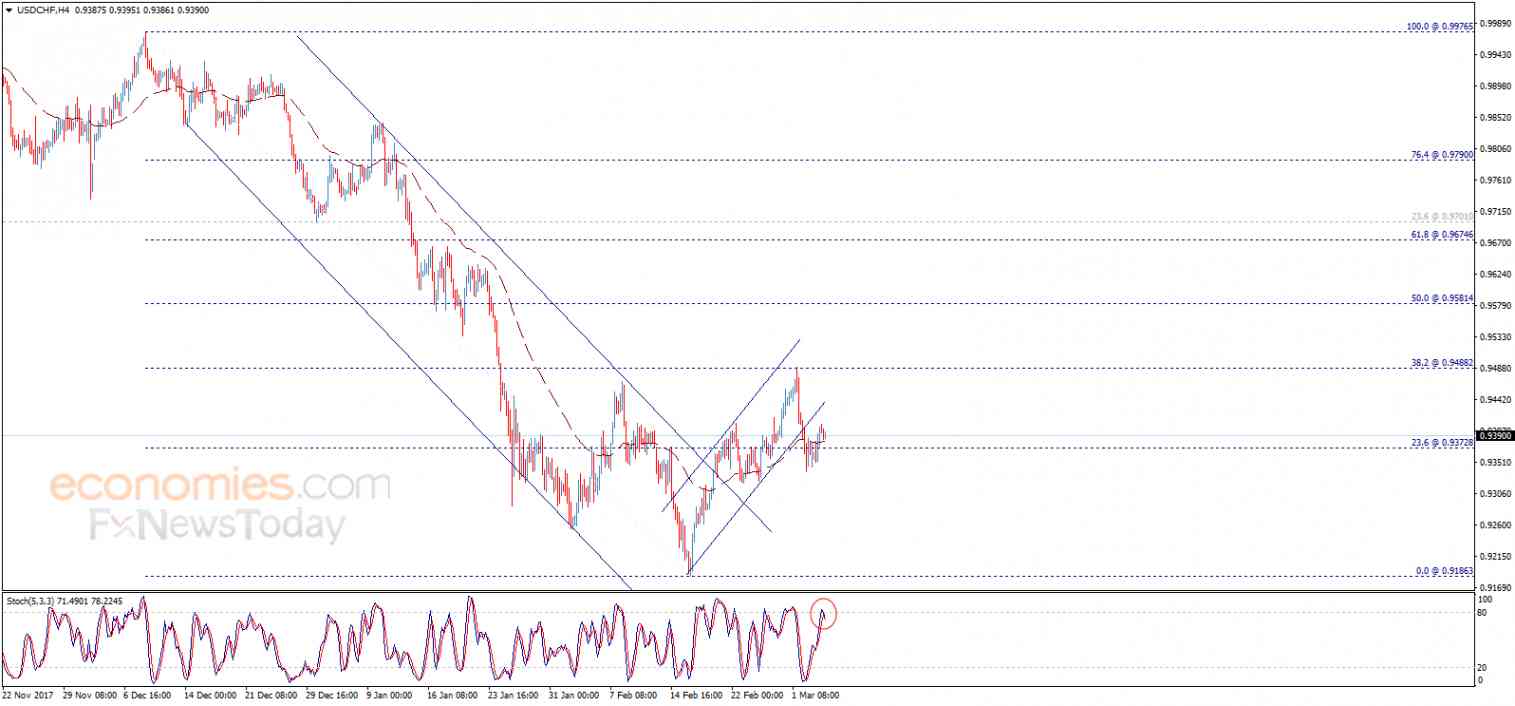 Source: economies.com - Click to enlarge |
USD/JPY
|
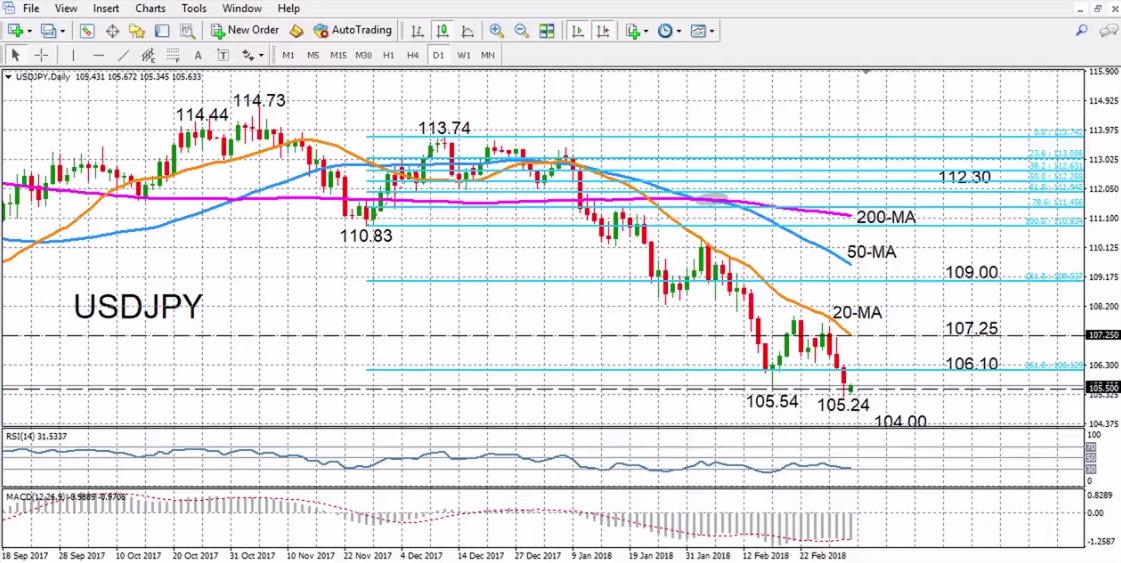
USD/JPY with Technical Indicators, March 05(see more posts on USD/JPY, ) |
EUR/USD
|
EUR/USD with Technical Indicators, March 05(see more posts on EUR/USD, ) |
GBP/USD
|
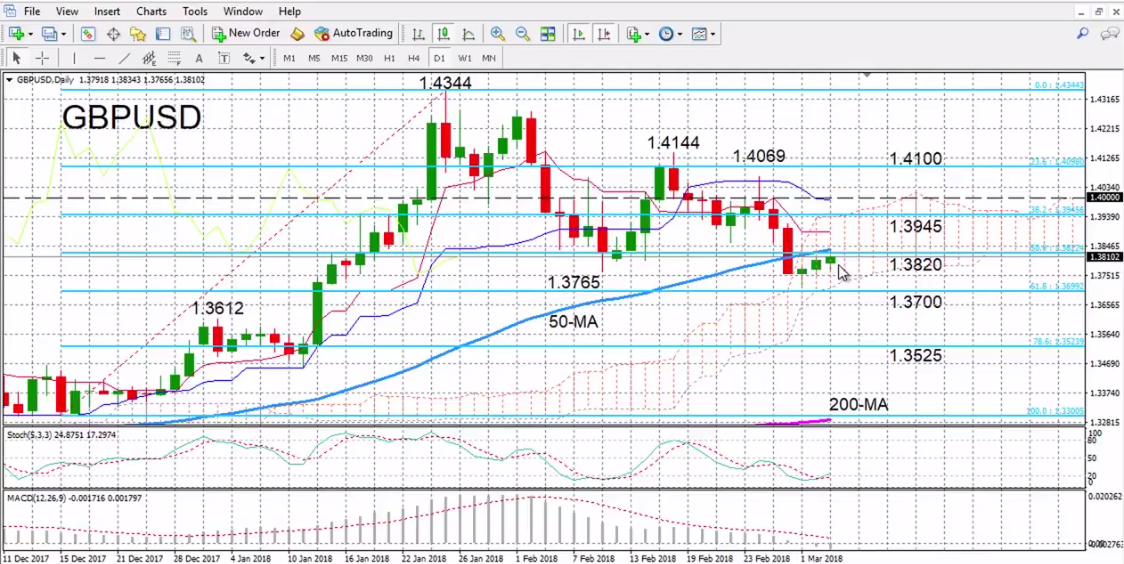
GBP/USD with Technical Indicators, March 05(see more posts on GBP/USD, ) |
EUR/GBP
|
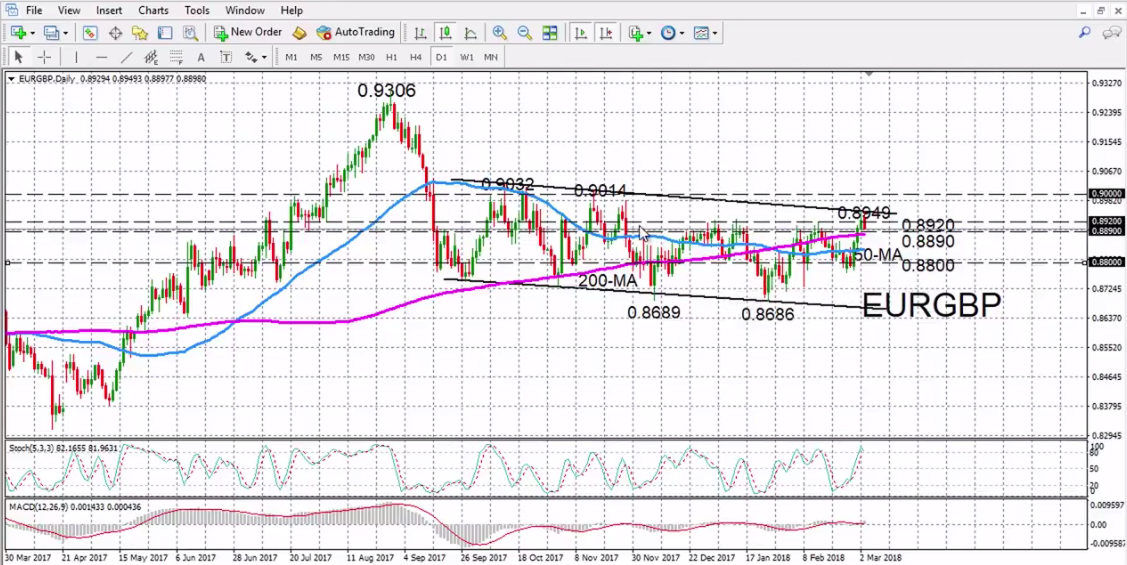
EUR/GBP with Technical Indicators, March 05(see more posts on EUR/GBP, ) |
AUD/USD
|
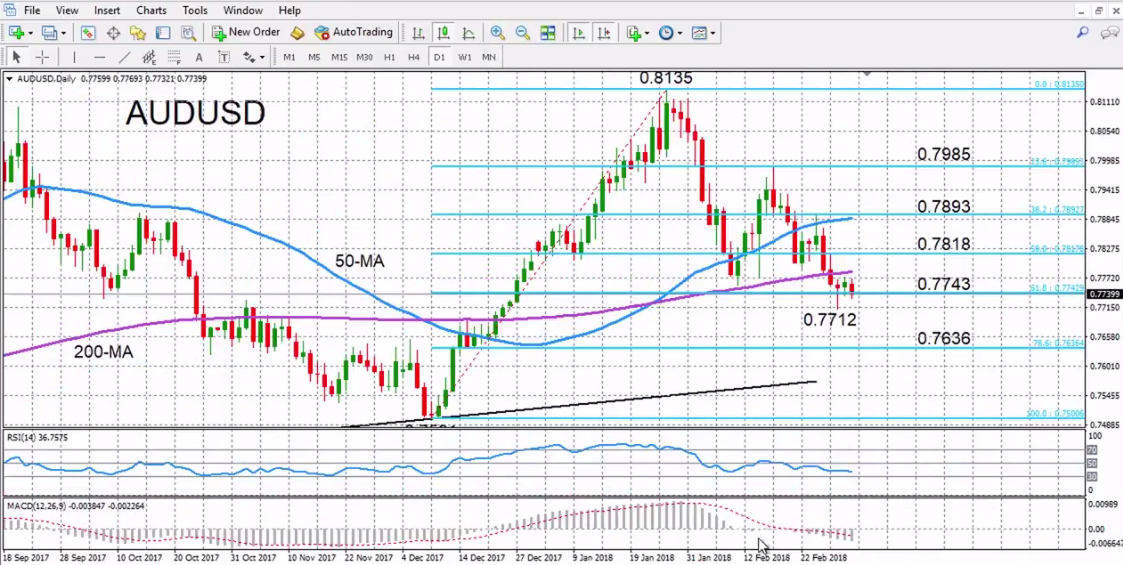
AUD/USD with Technical Indicators, March 05 |
Are you the author? Previous post See more for Next post
Tags: Australian Dollar,Bollinger Bands,British Pound,Canadian Dollar,Crude Oil,EUR/GBP,EUR/USD,Euro,Euro Dollar,Gold,Japanese yen,MACDs Moving Average,newslettersent,RSI Relative Strength,S&P 500 Index,Stochastics,Swiss Franc Index,U.S. Dollar Index,U.S. Treasuries,usd-jpy,usd/cad,USD/CHF


