Keith Weiner
My articles My offerMy siteAbout meMy videosMy books
Follow on:LinkedINTwitterSeeking AlphaFacebookAmazonGoogle +
Short and Long Term ForecastsPredicting the likely path of the prices of the metals in the near term is easy. Just look at the fundamentals. We have invested many man-years in developing the theory, model, and software to calculate it. Every week we publish charts and our calculated fundamental prices. However, predicting the outlook for a longer period of time is much harder. The fundamental shows the relative pressures in the spot and futures markets, but they only show a snapshot. They do not predict how those pressures might change. For that, one looks at the dollar of course, credit, interest rates, other currencies, the economy, and even wild cards like bitcoin. |
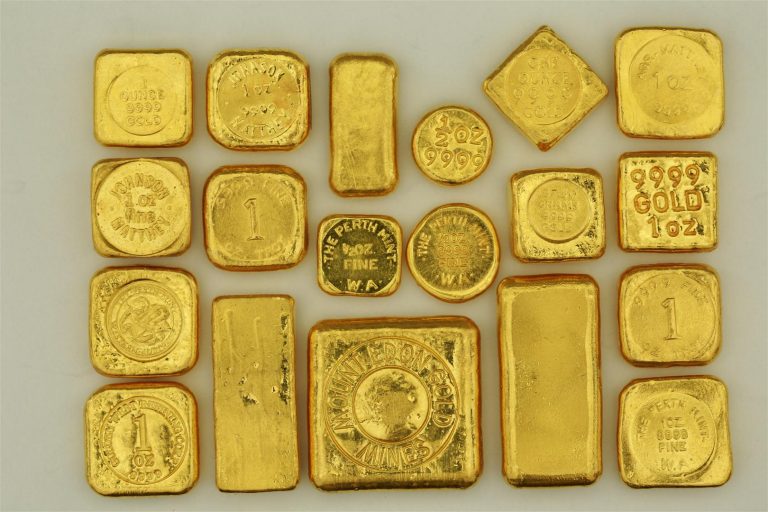 A selection of 1 and ½ ounce gold bars – definitely more fondle-friendly than bitcoin, but a bit more cumbersome to send around. - Click to enlarge |
Review of Last Year’s CallWe did not publish an Outlook 2017, because we were in the midst of developing and launching not just our website, but the engine that powers it, our data science platform. We will look at much of this data in this Outlook 2018. To keep ourselves honest, we like to review our call from the prior year. Without a 2017 call, we will briefly look at what we said in Outlook 2016:
That did not turn out to be a bad call. Gold ended 2015 around $1060. By the middle of the year, its price had shot up to about $1370. This was an overshoot of its fundamentals (which we called in that year’s July 3 Supply and Demand Report). We said market price was $200 above the fundamental price. By the end of the year, the market price was $1150. Our call at the start of the year was right, and so was our call at the mid-year spike. |
Gold Weekly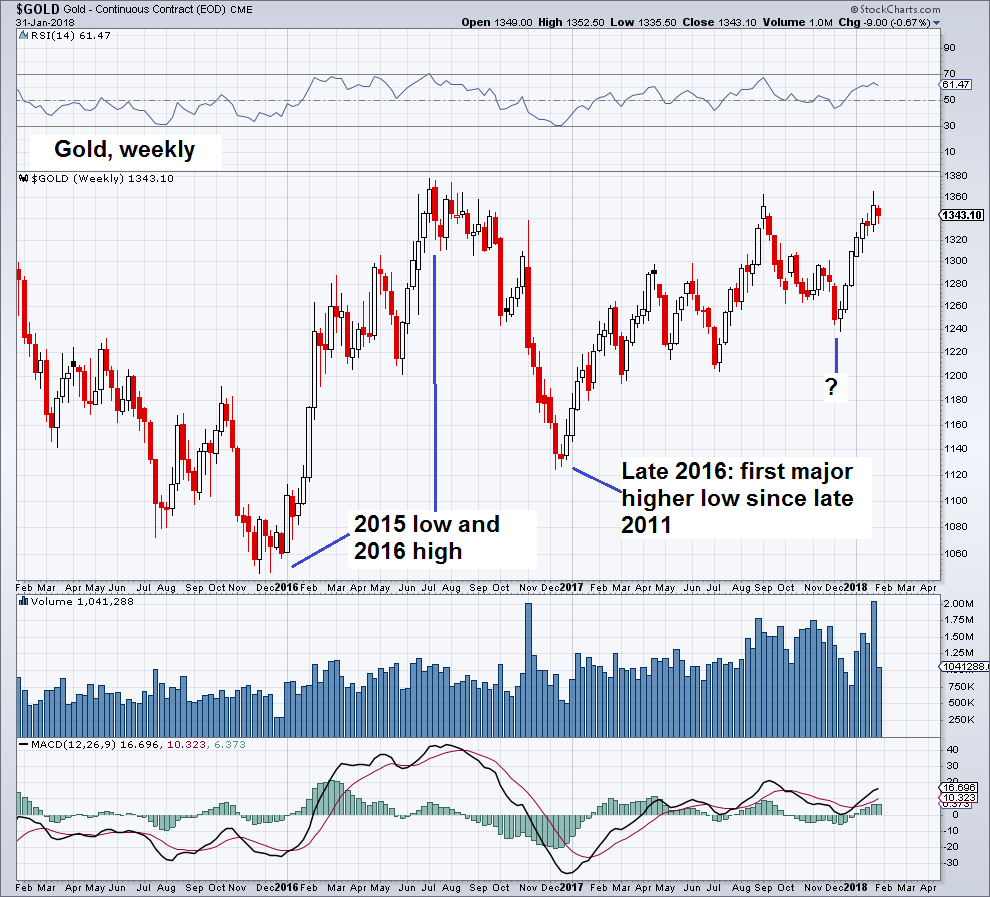 Gold, weekly – although skepticism remains fairly pronounced in view of the Fed having embarked on a rate hike cycle, the character of the gold market has clearly changed for the better since late 2015. - Click to enlarge It currently trades at the lower boundary of a strong resistance area between ~$1350 to ~$1400. The gold price has been rejected five to six times from this area since 2013 (depending on how one counts the breakout attempts, one could even argue it was seven or eight times – n.b., this is excluding the current attempt, the outcome of which is not yet known). As a general rule, the more often a lateral resistance or support area is tested, the more likely it will eventually give way. |
Gold:Silver RatioSilver ended 2015 just under $14, and spiked to over $21 in 2016 — a 50% gain. In our July 3 Report, we said it was $3 above its fundamental price. That is a call for a big drop. The market obliged us, with the price coming down to Earth. By year’s end, it was under $16, +$2. Not a bad dice roll in our Outlook 2016. The gold-silver ratio rose to a high of more than 83 in early 2016 (and again in 2017), also per our call. |
Gold:Silver Ratio(see more posts on gold silver ratio, )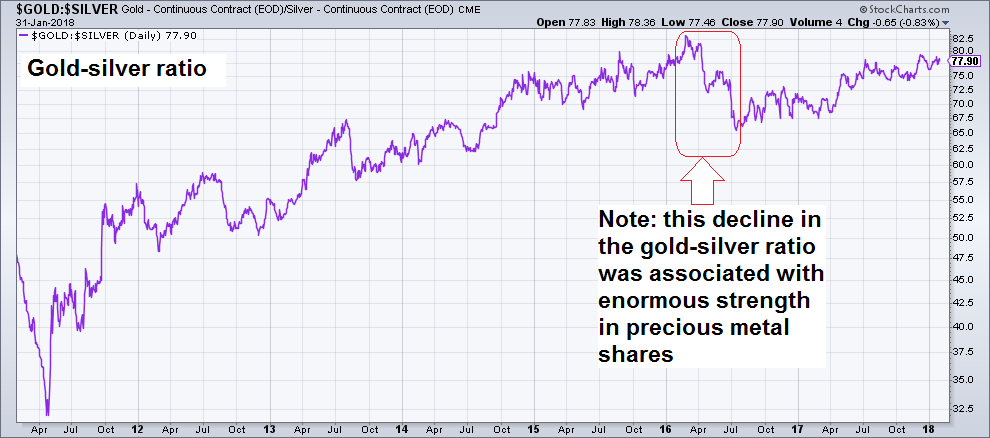 The initial decline in the gold-silver ratio from April 2011 to sometime in 2013 – 2014 erased much of the effects of extreme speculation that drove silver prices to nearly $50 in 2011. - Click to enlarge Since then, the weakness in the ratio seems to make little sense, as silver normally tends to rise relative to gold in times of increasing economic confidence (this is due to its far larger industrial demand component). A possible conclusion one could draw from this unusual behavior is that the precious metals markets believe said confidence to be just paper-thin and bound to come to grief. The same message is sent by the gold market itself, but the gold-silver ratio may be an even more relevant datum, as it is not distorted by exchange rate effects (i.e., the ratio will look the same regardless of which fiat currency is used to price the metals in). Whatever the precious metals markets are sensing to come down the pike is unlikely to be pleasant. |
How Not to Think about GoldThere are several popular approaches to analyzing gold. If you visit some alternative investing or gold sites, you will find conspiracy theories about price manipulation, rumors, out-of-context-factoids, and finally mining production and manufacturing consumption. Our view is that the dollar is indeed dying, but it is not via the instant white hot supernova of hyperinflation. It is by a long drawn-out asphyxiation, the drowning of a competent swimmer out at sea. We have written a lot to debunk claims of price manipulation (here is our recent open letter to Ted Butler, with graphs of our data going back to 1996). There are many others on our site. We would put rumors, Indian gold import numbers, and news into the same bucket. Even when factual, these items are the investing world’s equivalent of an attractive nuisance—they can lure you to financial harm. Finally, there is electronics and jewelry consumption, and mine production. We firmly insist that gold and silver cannot be understood by looking at small changes in production or consumption. The monetary metals cannot be understood by conventional commodity analysis. This is because virtually all of the gold ever mined in human history is still in human hands (to a lesser extent for silver). The World Gold Council estimates total gold stocks at 188,538 metric tons at the end of 2017 and reported mine production averaging 3,247 tonnes over the past three years. This is just 1.7% of then-existing stocks. In other words, it would take 58 years at current production levels just to produce the same amount of gold as is now stockpiled. If total gold mining is 1.7% of gold inventories, then small changes within that 1.7% are not likely to have much impact on the gold price.
How We Think About GoldThe implications of this are extraordinary. All of that stockpiled gold represents potential supply, under the right market conditions and at the right price. Conversely — unlike in ordinary commodities — virtually everyone on the planet represents potential demand. Why would people be willing — not just today, in the wake of the great financial crisis of 2008 and unconventional central bank response, but for thousands of years — to go on accumulating gold and silver? There is only one conceivable answer. It is because these metals are money. Compare gold to oil. The marginal utility of oil — the value one places on the next barrel compared to the previous — declines rapidly. For oil, it falls rapidly because once your tank is full, you have that storage problem — assuming you even directly use oil at all. However, the marginal utility of gold hardly declines at all. People are happy to get the 1,001st ounce, and accept it on the same terms as the 1,000th or the 1st ounce. We therefore think that changes in the desire to hoard or dishoard gold have a big impact on price and are more important than small changes in annual supply and demand flows.
How We Analyze the Gold MarketWe think of the market as the coming together of 5 different primary groups.
The five market participants interact to form a constantly changing dynamic. It is this dynamic that we study when we look at spreads between spot and futures, and changes to these spreads. Monetary Metals has developed a proprietary model based on this theory, which outputs the Fundamental Price for each metal. This is updated as the market changes every day. We have published more on the theory.
Our NumbersGold closed the year 2017 at $1,303. The Monetary Metals Fundamental Price was just about the same as the market price. Here is a graph of the market price overlaid with the Monetary Metals Fundamental Price. |
Gold Market Bid and Fundamental Price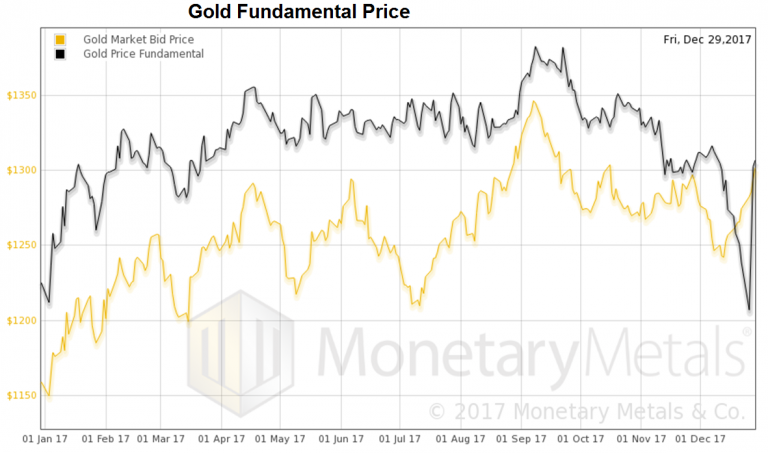 Gold – market price vs. fundamental price - Click to enlarge |
Silver Market Bid and Fundamental PriceSilver closed at $16.90. The Monetary Metals Fundamental Price closed the same. Here is a graph of the market price overlaid with the Monetary Metals Fundamental Price. |
Silver Market Bid and Fundamental Price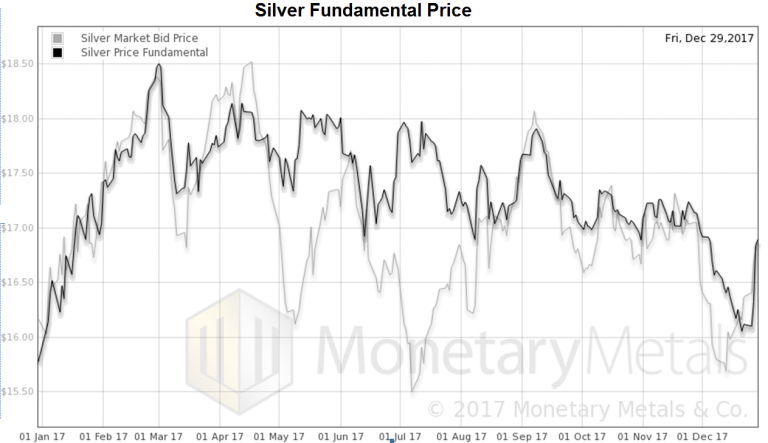 Silver – market price vs. fundamental price - Click to enlarge |
Gold Basis and Co-basis and the Dollar PriceIn both metals, the fundamental price rose, moving through the year with less volatility than the market price. This year is interesting, as the fundamental prices ended at the same level as the market prices for both metals. Whatever predictions we may make, cannot be made based on the fundamentals. Here is a chart of the price of the dollar in gold terms overlaid with the continuous basis (our measure of abundance) and co-basis (scarcity). |
Gold Basis and Co-basis and the Dollar Price(see more posts on dollar price, gold basis, Gold co-basis, )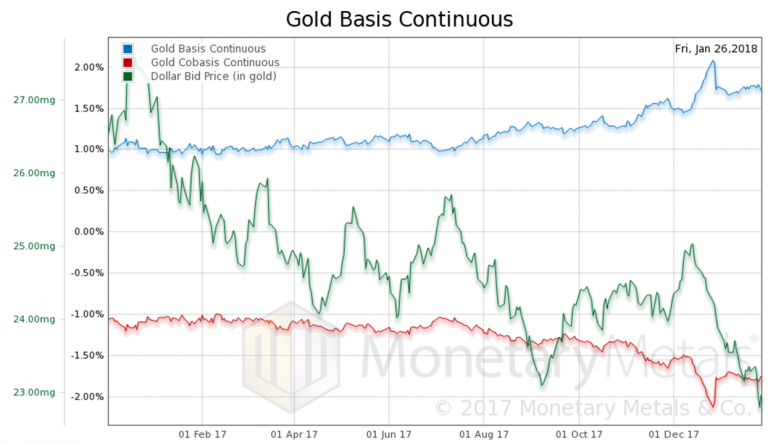 Dollar priced in milligrams of gold vs. continuous gold basis and co-basis - Click to enlarge |
Silver Basis and Co-basis and the Dollar PriceThe dollar is going down from almost 27mg gold to under 23mg (that’s $1,130 to $1360 stated in dollar-centric terms). There is an increased abundance of gold at the higher price, but the increase is not commensurate with the price move. In other words, the fundamentals of gold have strengthened during this move and likely were a driver (if not the driver). Still, it must be noted, there is no backwardation in sight in gold. In silver, the March contract has moved into what we call temporary backwardation—the tendency of the expiring contract to be pushed down due to selling pressure from traders who roll their positions to the next contract. Here is a similar graph for silver as shown for gold, above. The basis moves are similar. The price move, not so much. There is little trend. So what do we expect this year? |
Silver Basis and Co-basis and the Dollar Price(see more posts on dollar price, silver basis, Silver co-basis, )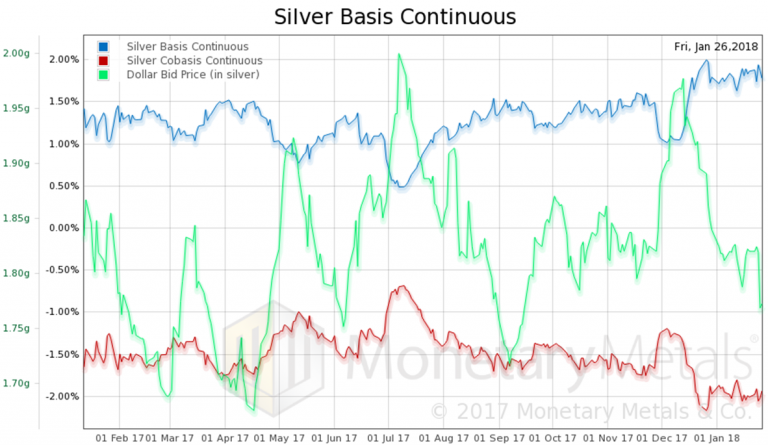 The dollar priced in grams of silver vs. continuous silver basis and co-basis - Click to enlarge |
Our Call
From the crisis through 2011, the prices of the metals ran up due to the inflation trade: “Oh my God, they are printing money to infinity! Buy gold and silver before they go to the moon!”
Then, that trend ended. While the money supply certainly did not collapse, supply and demand fundamentals caused lower prices in one commodity after another. Copper, for example, peaked in early 2011. Oil had an epic collapse. The decline in wheat is still ongoing.
The next several years were a period of despair alternating with hope as the prices of the metals fell and fell, and then rallied. It took from August 2011 when the price of gold hits its peak just under $2,000 until December 2015, when the price hit its trough a bit over half that level.
Conclusion
To anyone who does not yet own gold or silver, we offer the same advice as always. You should own some, period. Without regard to price. And we think that buying gold or silver now is likely to turn out to be a good deal.
For our gold and silver price forecast for 2018 and how we came to it, as well as an in-depth explanation of the points made above, read the full Monetary Metals Outlook 2018 (free registration required).
Full story here Are you the author?
Tags: Chart Update,dollar price,gold basis,Gold co-basis,gold silver ratio,newslettersent,Precious Metals,silver basis,Silver co-basis