Pater Tenebrarum
My articles My siteAbout meMy videosMy books
Follow on:TwitterSeeking AlphaFacebook
WhipsawedFrank Roellinger has updated us with respect to the signals given by his Modified Ned Davis Method (MDM) in the course of the recent market correction. The MDM is a purely technical trading system designed for position-trading the Russell 2000 index, both long and short (for details and additional color see The Modified Davis Method and Reader Question on the Modified Ned Davis Method). |
 The Nasdaq pillar… - Click to enlarge |
| As it turns out, the system was whipsawed, which is not a big surprise, as it attempts to minimize drawdowns (and it succeeds quite well at this task). Frank writes:
Frank also sent us two updated charts comparing the cumulative return of the MDM to that of the Russell 2000 and the S&P 500 Index in the medium term (starting in 2000) and the long term (starting in 1960). |
Cumulative return of the MDM, Russel 2000 Index and S&P 500 Index, 2000 - 2018(see more posts on S&P 500 Index, )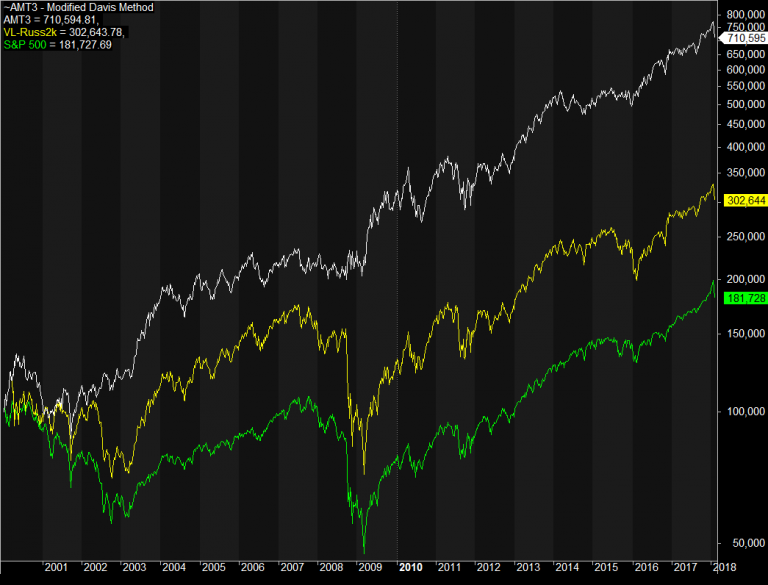 Cumulative return of the MDM (white line) vs. the Russel 2000 Index (yellow line) and the S&P 500 Index (green line) since 2000. - Click to enlarge |
| We are not surprised he isn’t overly concerned with fundamental rationalizations. 🙂 |
Cumulative return of the MDM, Russel 2000 Index and S&P 500 Index, 1965 - 2018(see more posts on S&P 500 Index, )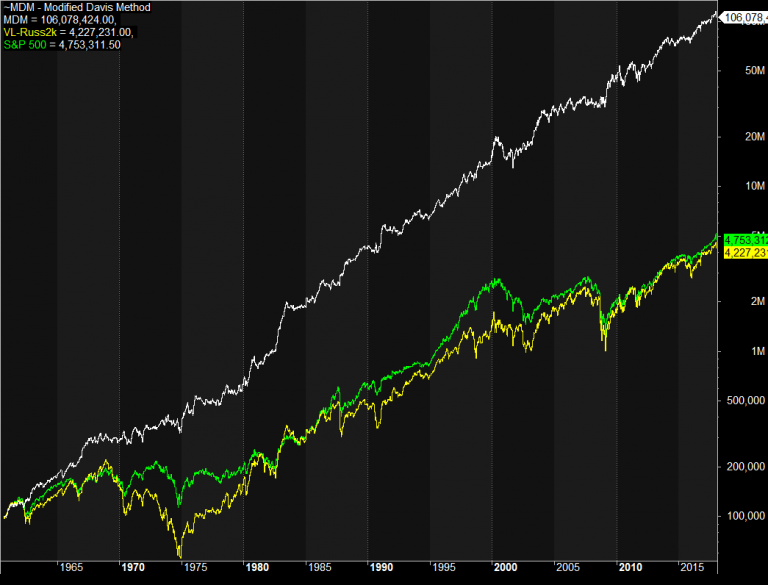 Cumulative return of the MDM (white line) vs. the Russel 2000 Index (yellow line) and the S&P 500 Index (green line) since 1960. - Click to enlarge |
A General Remark
We would note that these charts illustrate rather dramatically what a big difference avoiding large drawdowns makes with respect to long-term returns. The buy and hold mantra espoused by some people strikes us as absurd in light of these mathematical certainties. Even a very simple system (such as e.g. using the 200 dma as a demarcation for when to be in or out of a market) is better than having no system at all – despite the occasional whipsaw danger.
As an example of the potential pitfalls of the “buy & hold” approach, consider the stock market of Cyprus (n.b., this is a developed EU member nation). Someone who bought the market at its 2007 peak and decided to simply hold when it started to decline, would eventually have incurred a 99.29% paper loss over the next nine years (a decline from 5,676 points to 40 points based on the Main Index – in terms of the no longer existing Dow Jones Cyprus index, it would have been even worse). Let us assume that this market had subsequently rallied by 1,000% from its low. At that point, our hypothetical investor would “only” be down by 92.17% from his entry price. Hallelujah!
Admittedly, this is probably the most extreme example in the history of financial markets (leaving aside completely non-recoverable situations such as Dutch tulips), but it happened just a few years ago in a country that is a member of both the EU and euro zone. By the way – that 1,000% recovery? It was unfortunately just as hypothetical as our above mentioned buy & hold investor, i.e., it never happened. The stock market of Cyprus just retested its December 2016 all time lows in December of 2017. It is up a rather meager 6% since then.
Anyway, the point stands even for markets in which such a severe decline is considered unlikely. Keep in mind that a 50% drawdown requires a 100% rally just to return to break-even. That is not always an easy task – for example, Japan’s Nikkei remains some 45% below the ATH it put in almost three decades ago. After the peak of the tech mania in 2000, the Nasdaq Composite fell by 80% and took 16 years to regain its former high.
Since most of the stocks in the index pay no dividend, a buy & hold investor had no other means of catching up than to wait for Ben Bernanke’s printathon magic. And of course that break-even was merely in nominal terms. We don’t recall any WS analysts recommending to sell anywhere near the 2000 peak (on the contrary!). Conclusion: it is far better to have a system.
Full story here Are you the author?Tags: newslettersent,On Economy,S&P 500 Index,The Stock Market