Jeffrey P. Snider
My articles My offerMy siteAbout meMy videosMy books
Follow on:LinkedINTwitterSeeking Alpha
According to China’s official PMI’s, those looking for a boom to begin worldwide in 2018 after it failed to materialize in 2017 are still to be disappointed. If there is going to be globally synchronized growth, it will have to happen without China’s participation in it. Of course, things could change next month or the month after, but this idea has been around for a year and a half already.
| Without China, growth won’t be synchronized and it certainly can’t be global. The official index for manufacturing was estimated to have been 51.3 in January 2018, down from 51.6 in December, as well as its multi-year (but still not impressive) high of 52.4 published just ahead of the 19th Communist Party Congress. |
China Manufacturing PMI, Jan 2007 - 2018(see more posts on China Manufacturing PMI, )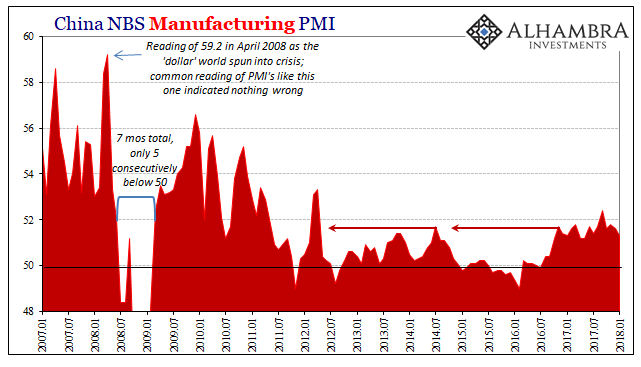 - Click to enlarge |
| The new orders component dropped to 52.6, the lowest level since last May. Those reporting increases to production levels were the least since last July. |
China Manufacturing PMI, Jan 2005 - 2018(see more posts on China Manufacturing PMI, )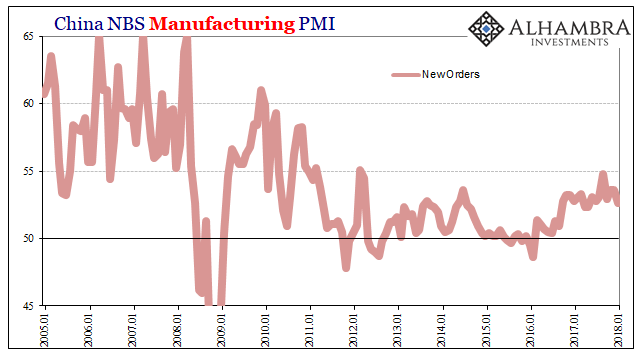 - Click to enlarge |
| None of these comparisons, however, really mean all that much anyway. They are relative only to levels recorded for recent years. That’s ultimately the value of these PMI’s, meaning that like others of China’s economic statistics, they show the Chinese economy remains in a low or no-growth state. What changes month to month is the variable condition of low-growth; a little more low-growth perhaps last fall, and a little less to end last year.
The downshift toward the last months of 2017 was apparently broad-based. The manufacturing PMI for large firms dropped to 52.6 in January, the lowest since May 2017. Small firms have been on the other side of 50 for seven straight months again, the part of China’s industrial sector that was devastated in the 2015-16 downturn. At 48.5 last month, small firms are suggesting the weakest level of growth (perhaps contraction, since the number is less than 50) and activity in a year. |
China Manufacturing PMI, Nov 2016 - Jan 2018(see more posts on China Manufacturing PMI, )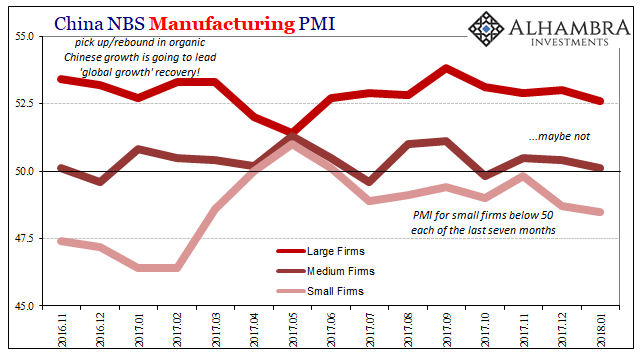 - Click to enlarge |
| To a small degree, the PMI’s are suggesting similar conditions to what some of the major economic stats have picked up. It isn’t a massive downturn or anything like late 2014, but given the relatively low levels at the peak last year a determined slowing here would seem to suggest, like FAI, that we may have seen the best out of China, and therefore global growth (unsynchronized as it ended up).
Part of that stems from what seems to be a more universal trait of late. Sentiment indices all over the world are overshooting related, or what should be related, statistics. It may be that sentiment is over-optimistic because of future expectations (that never materialize), or it may relate to a fundamental flaw in PMI’s. Whatever the case, it’s happening in China, too: |
China Industrial Production, Dec 1999 - 2017(see more posts on China Industrial Production, )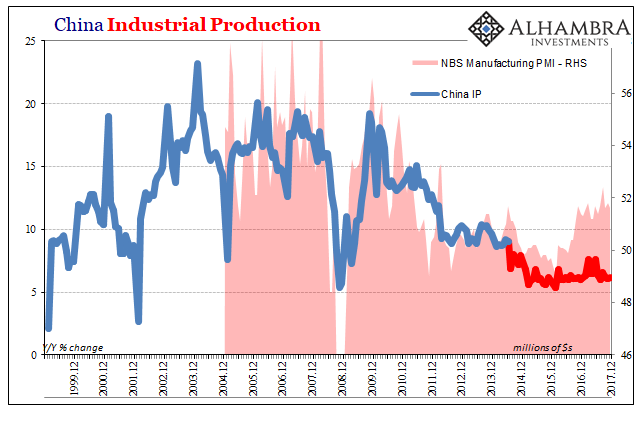 - Click to enlarge |
| We can point to several recent Chinese examples. When the NBS Manufacturing PMI was 51.4 in November 2013, Industrial Production was growing at 10%, not stuck around 6.2%. Toward the end of 2010, the index dropped from a high of 55.2 to a low of 50.7 in July 2011. IP slowed from around 18% to a low around 13%. But now 51.3 = ~6%? |
US Industrial Production, Jan 1985 - 2018(see more posts on U.S. Industrial Production, )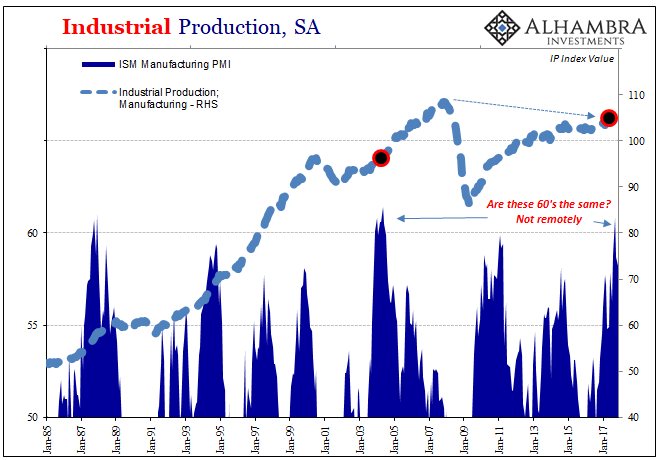 - Click to enlarge |
I doubt that these sentiment indicators are being manipulated by Chinese officials. Though there is good reason to suspect some level of “massaging” in other statistics, including both IP and retail sales blazing almost perfectly sideways in a three-year straight line, I think in this case it’s more so how PMI’s are simply unable to recalibrate to materially different conditions. A severe downturn followed by low-level growth is “read” by a PMI in the same way the anticipated cyclical case of a severe downturn followed by full recovery.
Nobody thought an “L” shaped cycle was possible let alone now common in place of the “V” shape that prevailed pretty much everywhere before 2007.
These statistics were never meant to match one to one, but the further time passes, the more it appears the differences remain, it leaves PMI’s to do nothing but overstate the upside; which, as noted by historical comparison, isn’t all that good to begin with. That means these indexes are the best of the best case, and still they indicate China’s economy is stuck in the 2012-slowdown mode and may be heading again in the wrong direction to begin this year.
Tags: China,China Industrial Production,China Manufacturing PMI,currencies,economy,Federal Reserve/Monetary Policy,globally synchronized growth,industrial production,manufacturing,Markets,newslettersent,non-manufacturing,PMI,U.S. Industrial Production