Jeffrey P. Snider
My articles My offerMy siteAbout meMy videosMy books
Follow on:LinkedINTwitterSeeking Alpha
| Industrial Production in the US was revised to a lower level for December 2017, and then was slightly lower still in the first estimates for January 2018. Year-over-year, IP was up 3.7%. However, more than two-thirds of the gain was registered in September, October, and November (and nearly all the rest in just the single month of April 2017). |
US Industrial Production, Jan 1995 - 2018(see more posts on U.S. Industrial Production, )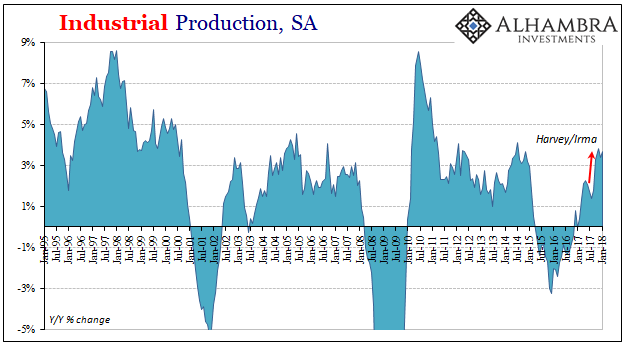 - Click to enlarge |
| It is very likely that what we are seeing for US industry is what has been slightly more apparent and further along in other places (like retail sales, for one). The big jump in production falls in the immediate aftermath of last summer’s vicious hurricane season. Rather than signal an organic acceleration in the goods economy, it was an anomaly, a one-time boost owing to cleanup and recovery from it. |
US Industrial Production, Jan 2011 - 2018(see more posts on U.S. Industrial Production, )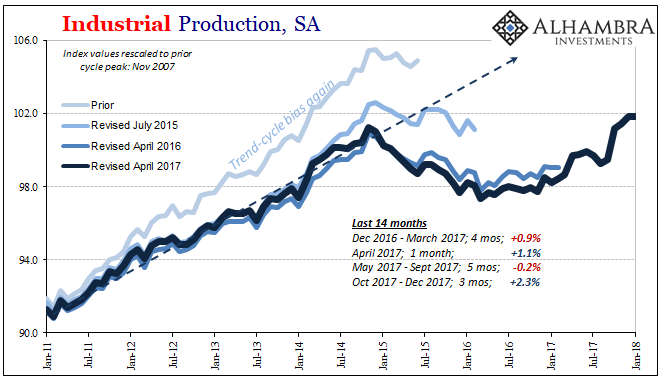 - Click to enlarge |
| If production does start to rollover, as we have expected, perhaps it will take some energy out of the inflation/boom hysteria currently in full force. I noted yesterday the coincidence in timing, this increasing economic confidence alongside what were predictably temporary gains. Intentional or not, the narrative risked from the start being unmasked for its obtuseness.
The Fed’s three diffusion indices bear out the further possible slowing ahead. While the 6-month comparison remains high (as we would expect), both the 3-month and especially the one-month have dropped considerably over the last two months. In December (these diffusion metrics are all one month further in arrears), the 1-month diffusion receded to 55.2 from a high of 61.5 back in October as the storm boost was in full swing. |
US Industrial Production, Jan 2015 - 2018(see more posts on U.S. Industrial Production, )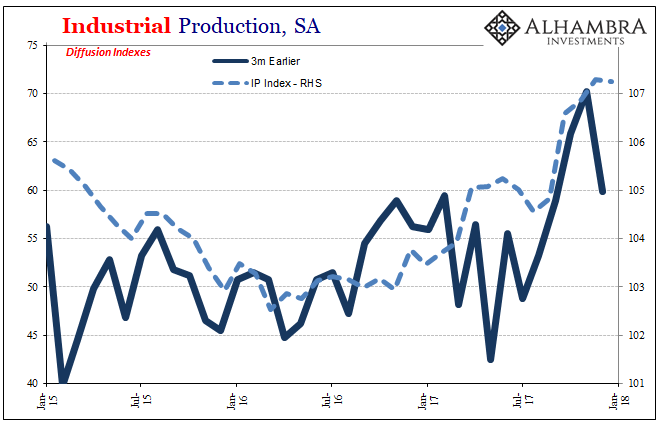 - Click to enlarge |
| The 3-month index had been 70.2 in November, but dropped to 59.9 in December indicating a greater likelihood of further weakness in the months ahead (like in the middle of 2017).
On the plus side remains oil production. For some reason, the IP estimates in this part of the mining segment were revised sharply higher for December against the overall revisions, which led to a lower January estimate than the month before. Whatever that was, statistical or real, IP in the oil patch continues to be actually robust. |
US Industrial Production, Jan 2006 - 2018 - Click to enlarge |
| What isn’t is automobiles. The Fed figures Motor Vehicle Assemblies rose slightly in January from December, but at just 11.2 million (SAAR) the sector is still struggling. |
US Motor Vehicle Assemblies, Jan 2013 - 2018(see more posts on U.S. Motor Vehicle Assemblies, )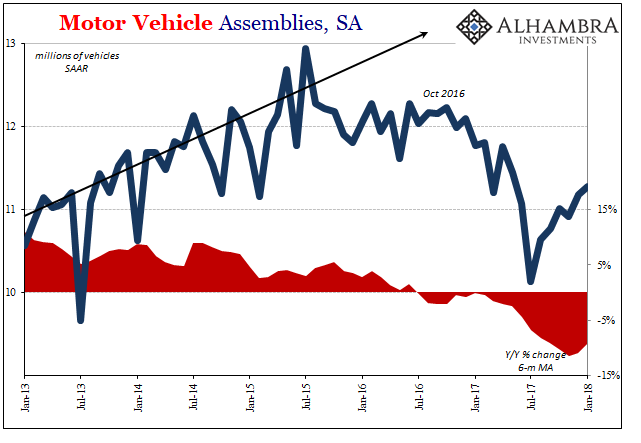 - Click to enlarge |
| Though there was a prominent sales boost again due to those severe hurricanes, that, too, has faded leaving automakers facing inventory prospects still too much like early 2017 than was likely hoped. |
US Motor Vehicle Sales and Production, Jan 2011 - 2018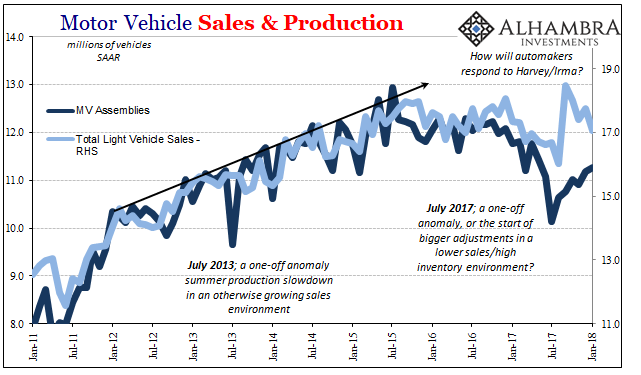 - Click to enlarge |
| As one indication for future demand, the Fed earlier this month reported continuing lower increases in the growth of consumer credit on the non-revolving side. The breakdown by lender category suggests risk aversion on the part of credit issuers. What we can reasonably interpret from other indications (available-for-sale homes, for one) posits caution on the part of consumers, too. |
US Motor Vehicle Sales and Credit, Jul 2011 - Jan 2018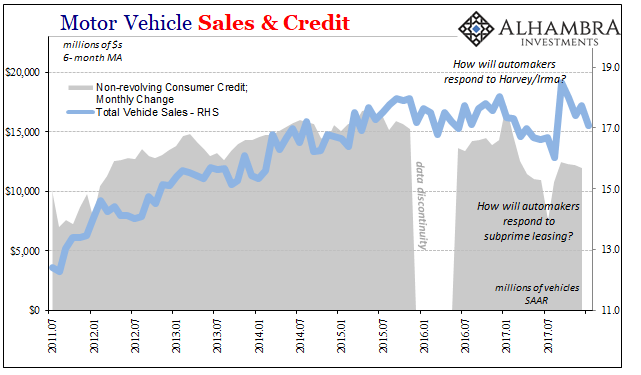 - Click to enlarge |
| Whether this is due to lenders or borrowers, or some of both, ultimately it may not matter. It portends continued weakness in auto sales, thus dealers carrying still higher levels of inventory, and therefore auto production to stay at best around these significantly lower run rates. It has been a clear drag on the manufacturing sector and US industry in general.
This is, of course, the opposite of what you would expect to find at the leading edge of an inflationary boom. Even with the hurricane boost during those few months, production levels never really achieved any significant momentum. It was an acceleration staving off perhaps what looked like looming contraction, led by autos, but unless something big changes US industry outside of mining and crude oil is going to have to face coming down from the unsupported highs of October and November. There are several appreciable “headwinds” already in 2018, starting with consumer credit (on the revolving side). We can add to that inventory in more than just autos that remains stubbornly high despite some positive movement following Harvey and Irma. And in those affected areas where cleanup led to this temporary lift in production and sales, there should very likely be a longer and prolonged negative effect for having gone through so much destruction. |
US Retail Sales, Jan 1993 - 2018(see more posts on U.S. Retail Sales, )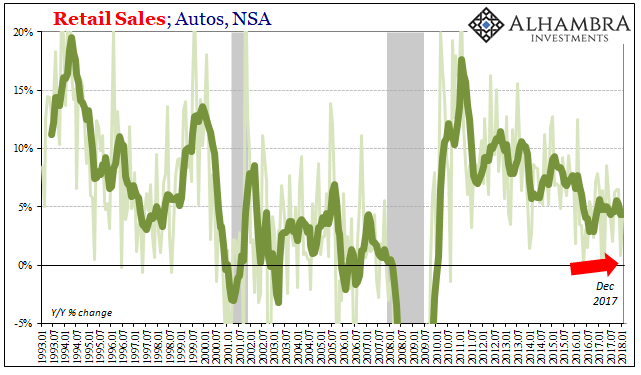 - Click to enlarge |
The big question outside of all that continues to be automakers. There have been signs that the OEM’s are running out of patience with incentives, with those record sized deals to customers really eating into profits given stagnant and lower sales. How will autos hold up without them?
A lot of perceptions begin to change if the industrial sector lags even further in 2018 than it did in 2017 (despite the storms). At least where they count; after all, the industrial or manufacturing recession of 2015-16 was discounted at every opportunity at the time in the mainstream. That’s ultimately indicative once more of the narrative skew that is still at work here; when IP was declining, we were told it didn’t matter when it surely did, that we should ignore the negatives; now that it’s rising at low levels, all that matters is supposedly the plus sign for this boom.
Full story here Are you the author?Tags: Auto Production,Auto Sales,Consumer Credit,Crude Oil,currencies,economy,Federal Reserve/Monetary Policy,industrial production,manufacturing,Markets,Mining,Motor Vehicle Assemblies,newslettersent,U.S. Industrial Production,U.S. Motor Vehicle Assemblies,U.S. Retail Sales