Mnuchin Gets ItUnited States Secretary of Treasury Steven Mnuchin has a sweet gig. He writes rubber checks to pay the nation’s bills. Yet, somehow, the rubber checks don’t bounce. Instead, like magic, they clear. How this all works, considering the nation’s technically insolvent, we don’t quite understand. But Mnuchin gets it. He knows exactly how full faith and credit works – and he knows plenty more. |
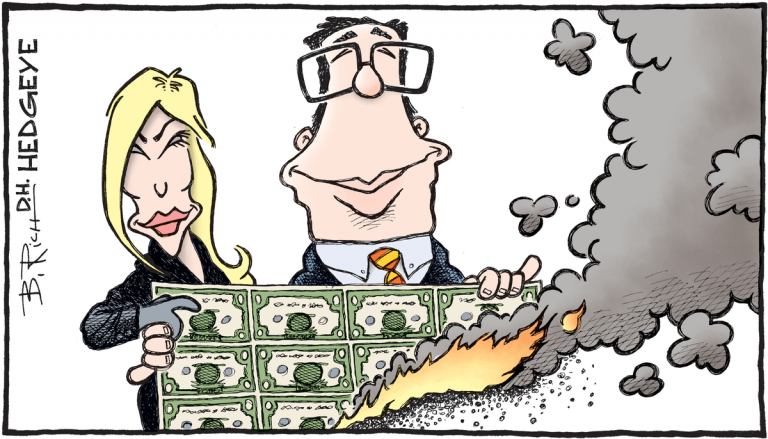 Master of the Mint and economy wizard Steven Mnuchin and his wife at the annual ritual greenback burning festival. - Click to enlarge |
| In fact, Mnuchin’s wife, Louise Linton, says she admires him because “he understands the economy.” And Mnuchin, no doubt, admires Linton, a Scottish actress 18 years younger, because “she loves SoulCycle Snapchat filters that make people look like puppies and piglets.” Naturally, Mnuchin gets the importance of puppy and piglet filters and how this bizarre fad fits into the big picture of the economy.
Unlike Mnuchin, we find the economy, and its infinite and dynamic relationships, to be beyond comprehension. But that doesn’t deter us from attempting to make some sense of it each week. When it comes to Snapchat filters we know nothing – and we could care less. Still, who are we to question Snap Inc.’s $24 billion market capitalization? What we do understand is simple arithmetic. So, too, we care a great deal about the increasingly precarious predicament the 115th U.S. Congress is putting the American people in. As far as we can tell, the approaching disaster is much closer than Mnuchin will publicly recognize. |
US Ratio of Federal Public Debt to GDP, 1968 - 2018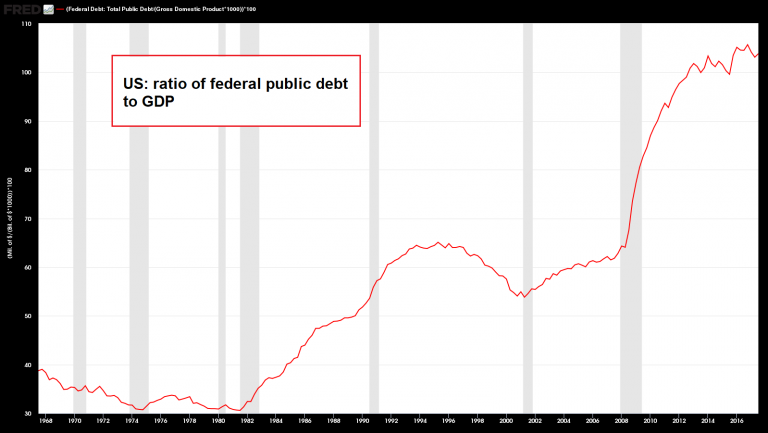 US public debtberg-to-GDP ratio – cruising for a bruising. - Click to enlarge The growth in public debt in recent years is unprecedented in peace time (arguably, the term “peace time” is not an accurate description of the current era). Lettuce not forget, this is just the debt they actually admit to, so to speak. It does not reflect what is known as “unfunded liabilities”, which best translated as “stuff that will never be paid, at least not in a form that remotely resembles the original contractual terms”. Anyway, purely from a technical perspective, the most recent wobbles in this ratio look like a “running correction”, i.e., another big leg up is probably imminent. |
Grim ParticularsThe growth of federal debt has been out of control for decades. The solution that’s commonly offered for reeling this back is for the economy to somehow grow its way out of the debt. This has yet to transpire despite a variety of policies over the years that have generally involved borrowing money from the future and spending it today. The simple fact is you can’t grow your way out of debt when the debt’s increasing faster than gross domestic product (GDP). For example, in 2000 the federal debt was about $5.6 trillion and real U.S. GDP was about $12.5 trillion. Today the federal debt is over $20.6 trillion and real U.S. GDP is about $17 trillion. In just 18 years the federal debt has increased by over 265 percent while real U.S. GDP has increased just 36 percent. This, by all practical means, is the opposite of an economy that’s growing its way out of debt. |
Total US Credit Market Debt, Gross Federal Public Debt and GDP, 1968 - 2018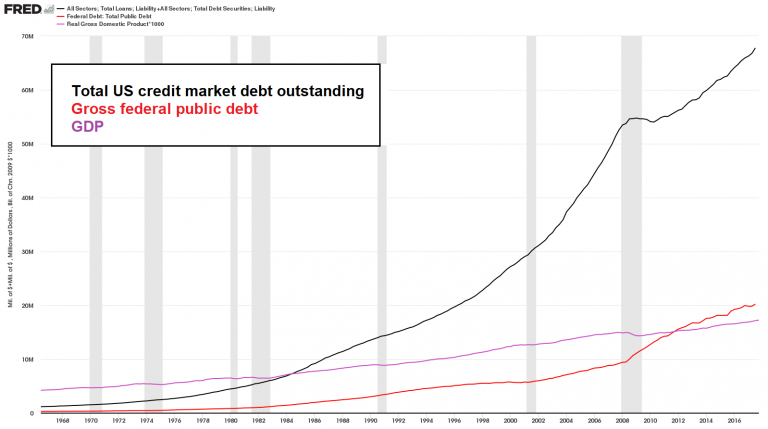 Mind the gap: total US credit market debt, gross US public debt and GDP. In the 1980s total debt outstanding crossed above total annual economic output, in 2011 public debt did likewise. - Click to enlarge Once upon a time, a fairly small amount of debt was supported by a much larger amount of economic output – nowadays a vertigo-inducing hyper-pile of debt is supported by economic output that represents a small and continuously shrinking fraction of it. It seems glaringly obvious that something will eventually have to break – if a trend cannot continue forever, it will necessarily stop and reverse at some point. In 2008 we witnessed a microscopically tiny interruption in the perennial growth of the debtberg generating economic upheaval on a scale that provoked comparisons with the darkest era in US economic history. Obviously, the above chart doesn’t inspire much confidence. It indicates that our vaunted central planners will eventually feel compelled to truly print the currency into oblivion, as it seems highly unlikely that they are ready and willing to stomach the alternative. Got gold? |
| But rather than adjusting spending to balance with the budget, or to at least structure debt growth to be more in line with GDP growth, the federal government is doubling down on its mistakes. Steven Rattner, former counsel to the Treasury Secretary, and a man who soiled his hands orchestrating the 2009 U.S. auto industry bailout, offers the grim particulars:
|
 Photo credit: Jonathan Fickies / Bloomberg via Getty Images - Click to enlarge Steven “car industry bailout” Rattner. We submit that neither he nor the CBO really know where the deficit will be a few years hence. The complaint about the recent tax cuts seems disingenuous though – this is like saying that a Mafia Don who has a debt of a billion dollars is suddenly in grave danger of insolvency because he decided to lower his annual take from the protection racket by $10,000 in order to grant his victims a little bit of relief. Perhaps it is time to consider spending cuts? Now that would be a refreshing change. |
When Budget Deficits Will Really Go VerticalWhen President Trump signed the GOP tax reform bill on December 22, the yield on the 10-Year Treasury note was 2.48 percent. As of market close on Thursday, the 10-Year Treasury note yield had increased to 2.89 percent. In less than two months the federal government’s borrowing costs have increased by over 16 percent. Similarly, a 30-year fixed residential real estate mortgage rate has increased over this period from 4.14 percent to 4.51 percent – or roughly 9 percent. Maybe this will finally take some of the gas out of the housing bubble. At the least, it has likely contributed to the decline in weekly mortgage applications. Several aspects that often coincide with the later stages of the business cycle include rising interest rates, rising price inflation, and rising trade imbalances. Like interest rates, consumer prices, as measured by the consumer price index, are now rising at an annual clip of 2.1 percent. |
US Treasury Yield Index, Jan 2017 - 2018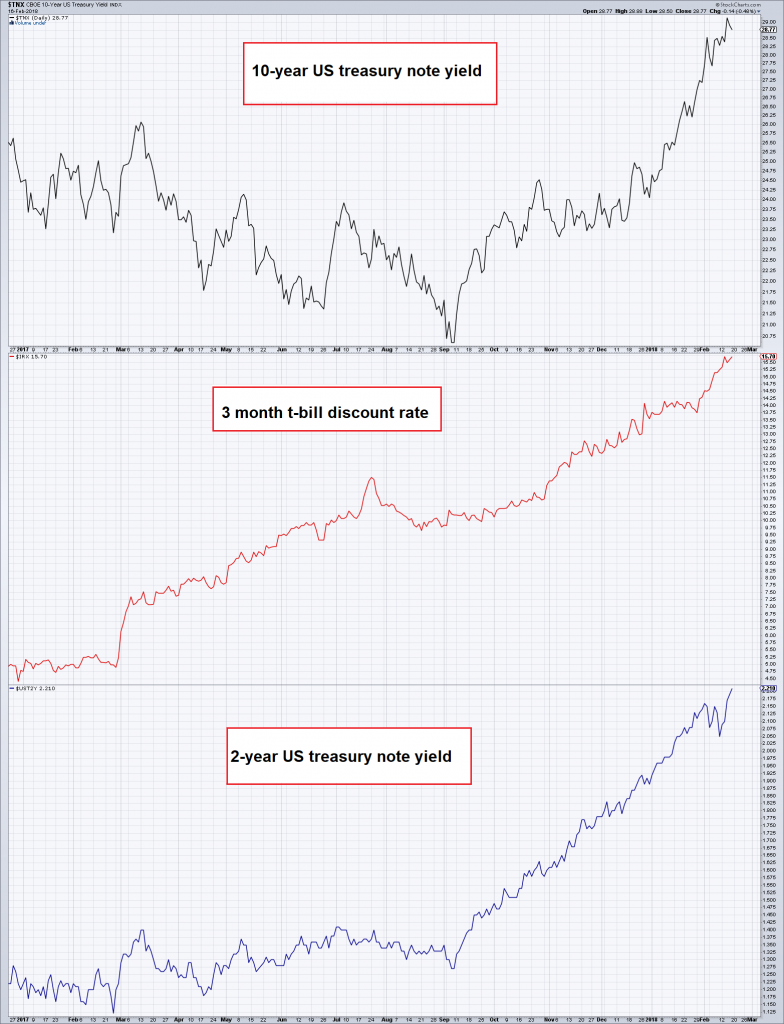 Up and away… yields on US treasury debt. - Click to enlarge To be fair, there is no 1:1 translation to the interest cost the government incurs, as these adjustments take time. The more long term debt was issued at very low rates, the longer it will take for the effect to take hold, as some time will pass before this debt matures and has to be rolled over. However, as could be seen in Japan, even if rates move lower again and become stuck at extremely low levels, at some point a threshold in terms of the size of the debtberg will be crossed and aggregate debt servicing costs will rise anyway. Japan seems to have found an interesting “solution” to this problem: the central bank simply buys up every last shred of outstanding government debt so as to keep yields at or near zero. So the government now not only truly owes the debt to itself, but the cost of servicing it is about to vanish as well (i.e., the government soon won’t have to pay any interest to itself anymore). We seem to have arrived in Bizarro-Land, where the perpetuum mobile apparently actually exists. The eventual discovery that this is not so will be interesting to watch, to say the least. |
| Trade imbalances are also on the rise. From our perch in Long Beach, overlooking the massive Port of Long Beach / Port of Los Angeles port complex, near the terminus of the Los Angeles River, we see plenty of action going on. Last year the Port of Los Angeles moved 9.34 million twenty-foot equivalent units (TEUs), the most in its 110-year history. Similarly, the Port of Long Beach moved 7.54 million TEUs in 2017, the most in its 107-year history.
So far, this year has picked up right where last year left off. Traffic at the Port of Long Beach in January reached 657,830 TEUs, a near 13 percent increase from January 2017. Indeed, the scope and magnitude of this trade is remarkable. Container ships loaded with consumer goods from China, Hong Kong, Japan, South Korea, Taiwan, and Vietnam, among others, queue up in San Pedro Bay for berth entry. Longshore workers offload the containers to rail and trucks with efficient competence. The ships are then figuratively stuffed with paper dollars and sent back to the Far East. |
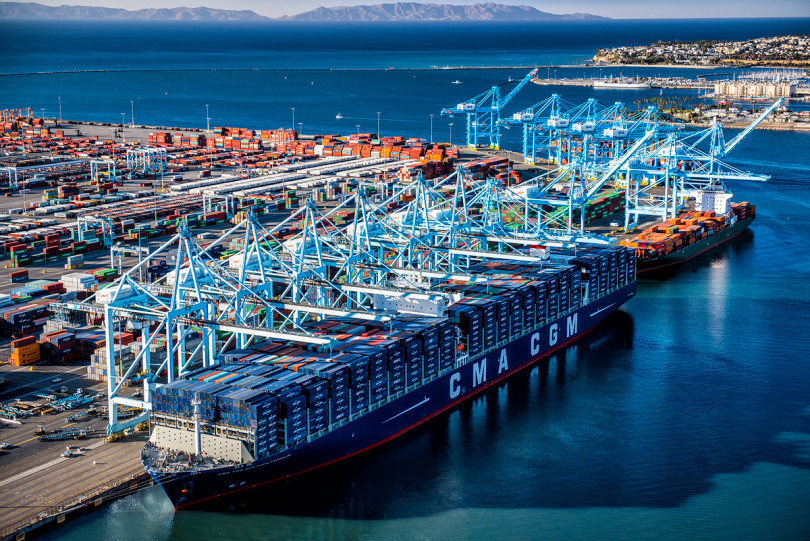 Photo credit: Port of Los Angeles - Click to enlarge The CMA CGM Benjamin Franklin, the largest container ship in the world, docks at the Port of LA. This behemoth is bigger than an aircraft carrier and about one third larger than the second-largest container ship. |
The U.S. trade deficit in December widened to $53.1 billion. The last time the trade deficit was this high was October 2008, one month after when Lehman Brothers vanished from the face of the earth.
Perhaps a decline in the U.S. trade deficit isn’t imminent just yet. But as credit markets tighten in the face of rising consumer prices something will have to give. The slowdown in economic activity will come soon enough. Then we’ll see budget deficits really go vertical.
Happy Lunar New Year!
Full story here Are you the author?Tags: newslettersent,On Economy,On Politics