Marc Chandler
My articles My offerMy siteAbout meMy videosMy books
Follow on:LinkedINTwitterSeeking AlphaAmazon
The US markets are closed on Monday, and many parts of Asia will continue to celebrate the Lunar New Year. The economic schedule is fairly light, and market psychology appears fragile after the dramatic activity in equities and what appears to be shifting macro-relationships. To help navigate the challenging investment climate, we identify four “numbers” that can illuminate the path ahead.
The equity market is center stage. The key number here is 2743. It is the 61.8% retracement of the S&P 500’s recent sell-off from record highs on January 26 near 2873. If last week’s impressive recovery, the largest weekly advance in six years, is “dead cat bounce” from the sudden drop, then this area should hold. It was teased before the weekend, but the S&P 500 closed below it (~2732).
In the starkest terms, the issue is whether the drop in equities was the beginning of the end of the bull market in equities. Many observers and analysts seem to think it is and welcome the increase in volatility ss chiefly a beneficial development. The argument is that the capital markets have entered a new era, and many seem to attribute it to the end of the extraordinary monetary policies of central banks.
We have offered an alternative hypothesis. Yes, the equities were stretched, with a substantial rally in the first several weeks of the year. The correction was overdue, which again underscores the hazards of market timing. However, that is all it was, and even that may have been exaggerated, we suggest, by the new products that profited from the continuation of low volatility. An echo-chamber was created that amplified the drop but the underlying drivers are still in place.
Rather than seeing the historical precedent for the stock market action in 2000 or 2008, we suggest it is 1987. US equities lost a quarter of their value in a single day. Coincidentally, a new Fed chief (Greenspan) had just taken his post. There was no recession, and the stock market did not see those October 1987 lows again. Then it took two years for the S&P 500 to make new highs, but if our hypothesis is correct, new highs will be seen much sooner.
More broadly, the consensus narrative puts the central banks at the center of its explanation for low interest rate environment and the elevated valuations in the equity market and low volatility. We respectfully demur. While recognizing an important role for central banks, the huge pools of capital that do not find a sufficiently profitable outlet in production remain in circulation and park in financial assets. Financialization is one of the key developments in the past generation, and the source of it is not central banks per se, but surplus capital.
United StatesThat leads us to the second key number: 3.0%. That is in reference to the US 10-year yield. Its importance, unlike the S&P 500, is more directly a function of psychology than technical factors. At the end of 2017, many expected the US 10-year yield to rise to 2.90% by the end of this year. That target has been met this month. Already, many investors recognize that the 30-year downtrend in long-term US yields has been broken, but a move above 3.0% could spur another wave of adjusting and hedging. The 10-year TIPS yield may be used a practical measure of the real rate. The yield had risen from about 42.5 bp at the end of last year to 79.5 bp last week. That 37 bp increase explains two-thirds of the increase in the nominal 10-year yield (from 2.40% to 2.94%). The rise in real rates has been impacted by the shifting expectations of Fed policy. The implied yield of the December Fed funds futures contract, which settles at the effective average Fed funds rate for the month, has risen 16 bp this year. The December FOMC meeting concludes on the 19th, so the 16 bp increase reflects actually a greater increase in overnight rate expectation. By nearly any measure, real interest rates remain very low. The average over the past 20-years is closer to 1.75% rather than the prevailing rate a little below 80 bp. This is remarkable given what appears to be an unprecedented amount of fiscal stimulus directed at an economy that is growing above trend. At the same time, the Federal Reserve has been quite transparent about its intention to buy $420 bln fewer Treasuries this year, just as the supply is increasing. Moreover, the tax changes may reduce corporate treasurers’ demand, while demographics will likely see Social Security buy fewer (non-marketable securities) as well. Market-based measures of inflation expectations have risen, but remain modest, given the fiscal consideration and now the new tariffs (solar panels, washing machines, and soon, likely aluminum and steel) that raise prices for consumers of those items. The recent string of reports, including average hourly earnings, CPI, PPI, and import prices was above expectations. The shift in expectations of Fed policy has not been dramatic. Several bank economists now forecast four hikes this year. There is much discussion that the updated forecasts by the Fed will see the median forecast increase from three to four hikes. What is the problem? The market has not even discounted three. Here is a way to conceptualize the issue. The Fed funds futures settle at the average effective rate over the course of a given month. Since the December hike, the effective average has been 1.42%. Three hikes would lift the effective average to 2.17%, while a fourth hike would generate an effective average of 2.42%. The January 2019 contract may give the best read of the end of 2018 rate. It finished last week with an implied yield of 2.09%. Our hypothesis in the equity market is that we have not entered a new investment paradigm that is a bizarro (or opposite) version of the current one. We do not believe that investors have been awoken from the Soma-like narcotic effect of central bank aggressive policy stance that blurred the distinction between monetary and fiscal policies, as the consensus narrative would have it. Nor in their awakened state will rationality will return, and equity prices will return to valuations closer to their long-term cyclically-adjusted price-earning ratio averages. Our hypothesis in the bond market is that the ample capital available, and the fact that the ECB and BOJ are buying the net new supply by their respective governments, will serve to keep US rates lower than what many macro models may suggest, given supply and demand considerations and rising inflation expectations. |
Economic Events: United States, Week February 19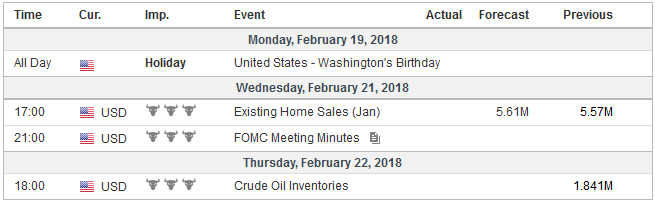 - Click to enlarge |
EurozoneThe third number to watch is the final read of the January eurozone CPI. The preliminary report is usually reliable. It said that the headline rate fell 0.9% on the month for a 1.4% year-over-year rate. Prices in Europe often fall in January. The 0.9% decline is at the smaller end of the -0.8% to -1.5% range over the past five years. Recall that the headline pace peaked at 2.0% last February, an inflation scare that did not lead to much of a euro rally, ahead of the Dutch and French elections. A Bloomberg survey shows a median expectation that the headline rate may be revised to 1.3%, which would match last year’s lows. After holding steady at 0.9% through Q4 17, the core rate edged to 1.0% in the initial estimate. The impulses coming from the exchange rate and oil prices suggest upward pressure on the headline rate and less pressure on the core rate going forward. The euro has appreciated around 5% against the dollar since the staff’s last forecast, while oil prices have risen around 2%. Good for German metal workers and engineers who fought for better pay increases and some flexibility in hours, but there are serious questions about how representative the settlement is going to be in Germany and Europe. The initial estimate for February CPI is due February 28, and that will be the last input ahead of the ECB meeting on March 8. That is a few days after the Italian election and the result of the SPD decision whether to accept the deal with Merkel’s CDU/CSU and enter a coalition government again. Investors are likely to be sensitive to eurozone inflation data. It is seen as important for the current differences between hawks and doves. That said, there appears to be a consensus currently that accepts a reduction of asset purchases after September, but to conclude at the end of the year. Since the first rate hike (from minus 40 bp deposit rate) will start sometime after the end of purchases, the implication is that pushing the QE to the end of the year means a rate hike likely no sooner than mid-2019. |
Economic Events: Eurozone, Week February 19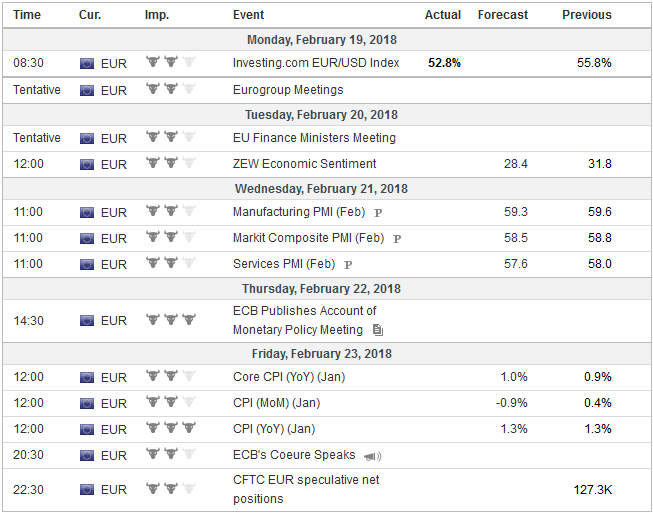 - Click to enlarge |
Switzerland |
Economic Events: Switzerland, Week February 19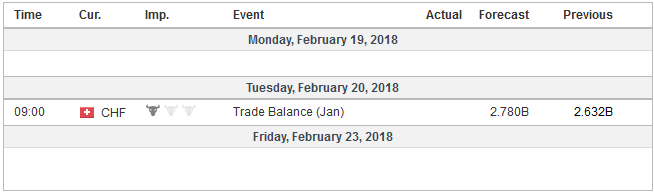 - Click to enlarge |
The fourth number is to be found in the foreign exchange market. It is $1.26 and represents a key area for the euro. There are two important technical levels. First, it is the last major retracement objective of the euro’s down move that began in mid-2014. Second, it is where a downtrend from the record high (2008 ~$1.60) is to be found.
A convincing move above there would likely spur action by some of the structural long dollar positions. Technically, a move to $1.32-$1.35 would seem likely, if not a bit higher. The OECD’s PPP model puts fair value near $1.33.
Speculators in the futures market have already begun taking liquidating long euro positions. The week ending February 13 was the third in a row that the gross long position was trimmed. The gross shorts eased 7k to about 103.5k, they have been fairly steady in a narrow around 100k.
With the US debt ceiling lifted, the Treasury Department will dramatically increase it T-bill issuance. Next week, nearly $200 bln bills will be sold. This includes $50 bln four-week bills and the same about of 55-day cash management bills. This raises $70 bln in new cash. Then the Treasury will auction a record amount of three-month ($51 bln) and six-month ($45 bln) bills. The anticipation of such supply is already begun lifting short-term rates.
The hypothesis is as the Treasury replenishes its T-bills it will drain some of the high dollar liquidity. In turn, this will push up the premium for dollars in the liquidity markets, like cross-currency swaps. This is also part of a broader explanation of last year’s dollar decline–namely the running down US T-bills due to debt ceiling maneuvering–flooded liquidity markets with dollars, driving down the price.
Full story here Are you the author?Tags: #USD,$EUR,$JPY,$TLT,ECB,newslettersent,SPY