Keith Weiner
My articles My offerMy siteAbout meMy videosMy books
Follow on:LinkedINTwitterSeeking AlphaFacebookAmazonGoogle +
Beginning of Post: See the introduction and the video for the terms gold basis, co-basis, backwardation and contango.
Fundamental DevelopmentsIn this New Year’s holiday shortened week, the price of gold moved up again, another $16 and silver another 29 cents. Or we should rather say the dollar moved down 0.03mg gold and 0.03 grams silver. It will make those who borrow to short the dollar happy… Let’s take a look at the only true picture of the supply and demand fundamentals for the metals. But first, here are the charts of the prices of gold and silver, and the gold-silver ratio. |
Gold and Silver Price(see more posts on gold price, silver price, )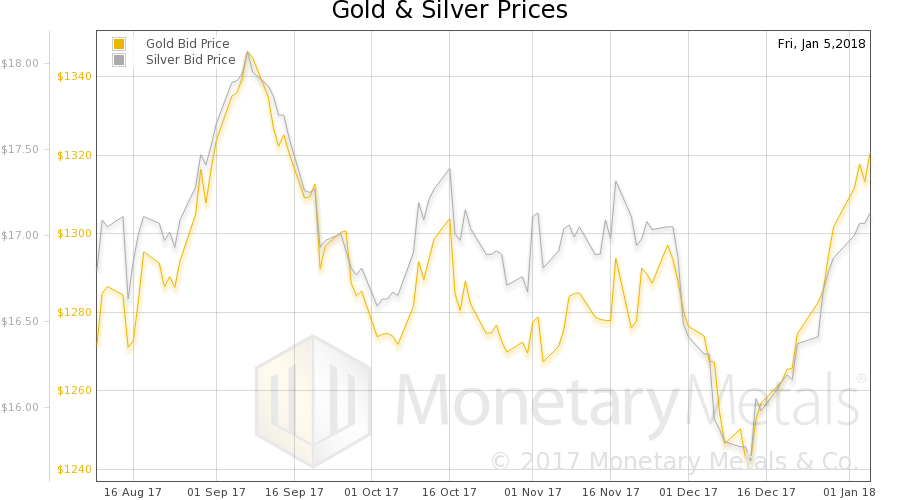 Gold and silver prices in USD terms - Click to enlarge |
Gold:Silver RatioNext, this is a graph of the gold price measured in silver, otherwise known as the gold to silver ratio. The ratio dropped.
|
Gold:Silver Ratio(see more posts on gold silver ratio, )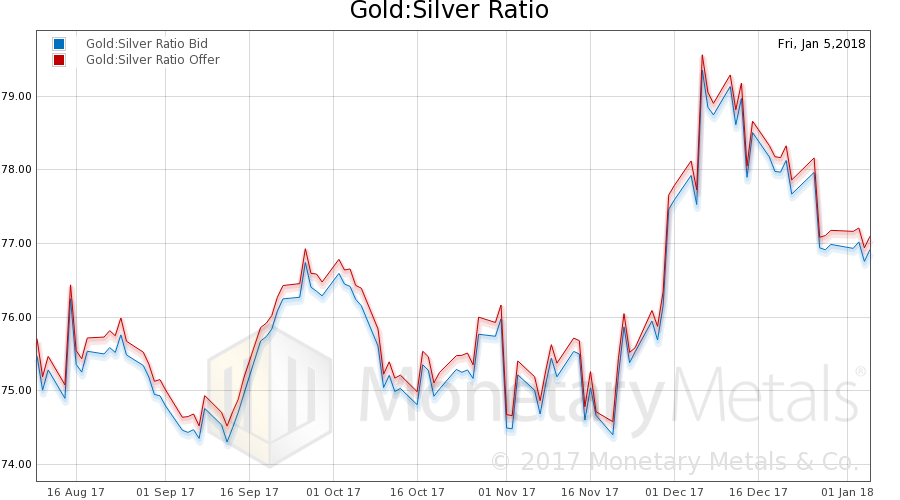 Gold-silver ratio, bid and offer - Click to enlarge |
Gold Basis and Co-basis and the Dollar PriceHere is the gold graph showing gold basis and gold price. Look at that quantum change after Christmas. The basis (i.e., the indicator of abundance) had peaked, and the co-basis (i.e. scarcity) had bottomed. Up until it reversed, those moves were tracking the price. As the price of gold was rising (the green line shows the inverse, the price of the dollar!), gold was initially becoming more abundant, less scarce. But after Christmas, something snapped. Gold started to become less abundant as its price kept rising. This violates no economic law, though it has been a rare occurrence of late. Until Christmas week. It should be no surprise that our Monetary Metals Gold Fundamental Price rose $29 this week, to $1,336. |
Gold Basis and Co-basis and the Dollar Price(see more posts on dollar price, gold basis, Gold co-basis, )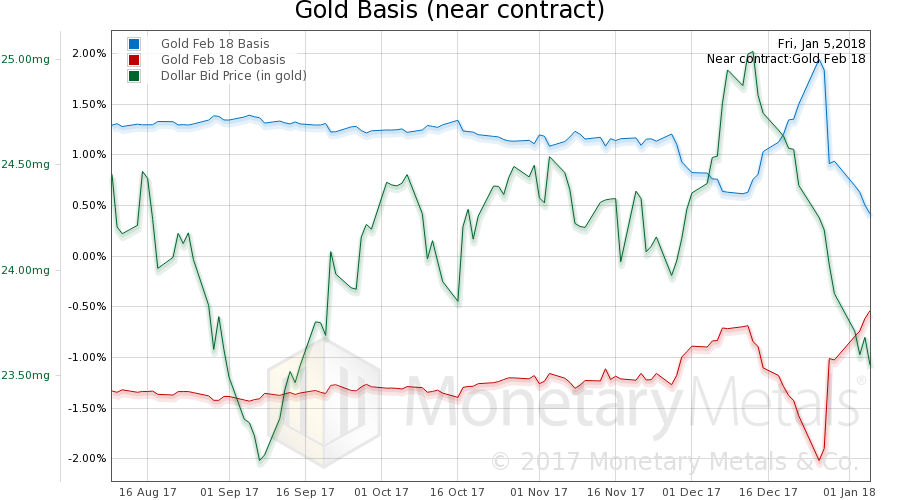 Gold basis, co-basis and the USD priced in milligrams of gold - Click to enlarge |
Silver Basis and Co-basis and the Dollar PriceNow let’s look at silver. The same pattern occurs here, though it is more muted. This is a bit unusual, as price and basis moves tend to be bigger in silver due to this metal’s lesser liquidity. The Monetary Metals Silver Fundamental Price rose 31 cents from last week, to $17.20.
© 2018 Monetary Metals |
Silver Basis and Co-basis and the Dollar Price(see more posts on dollar price, silver basis, Silver co-basis, )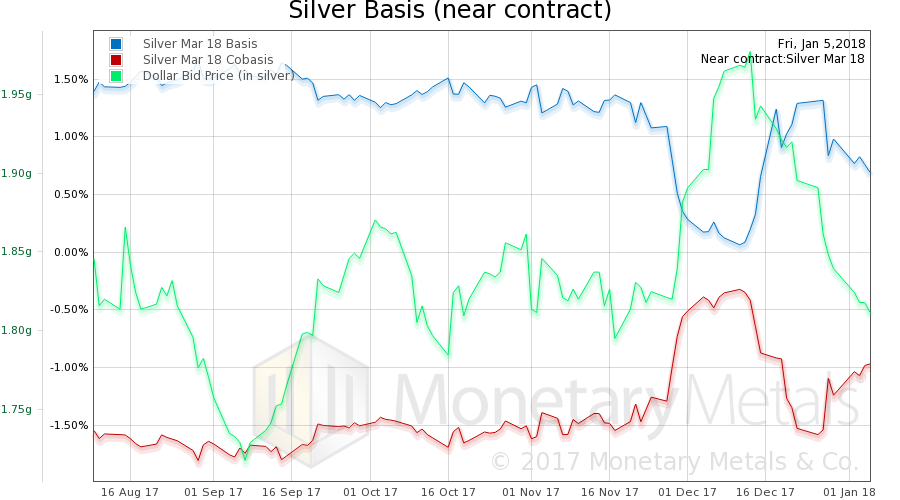 Silver basis and co-basis, and the USD priced in grams of silver - Click to enlarge |
Addendum by PTThese are quite interesting developments in light of what we have discussed in late December regarding the technical and sentiment backdrop as well as time cycles and seasonal trends in precious metals (see: Gold and Gold Stocks – Patterns, Cycles and Insider Activity, Part 1 and Part 2). Readers may recall that we mentioned in passing that the most important macroeconomic drivers of the gold price were actually incongruously skewed to the negative side, seemingly contradicting the price action and the other evidence we presented. Occasionally the gold market preempts future fundamental developments though, and that may well be the case here. We will shortly post an update looking at this situation more closely. In the meantime, here is another “technical” tidbit with respect to the current market structure. The following chart (which was recently published by EWI/Elliott Wave International) shows the positioning of the “managed money” category in silver futures according to the disaggregated commitments of traders report. It is quite intriguing and clearly confirms what Keith indicates above – the recent buying pressure in gold and silver was apparently not a reflection of the actions of speculators in the “paper” markets. |
Silver and Managed Money, 2013 - 2017 The “managed money” net position in silver futures and options. - Click to enlarge The red and blue vertical lines show previous occasions when the positioning of this group became very one-sided. Needless to say, the herding instincts are strong among these market participants, as most of them simply employ trend-following strategies. They will tend to be correctly positioned during major trending moves, but near turning points their timing is absolutely terrible. Note also the instances of price/positioning divergences in 2015 and 2017 we have highlighted. Such divergences are frequently seen near turning points. |
Charts by Monetary Metals, Elliott Wave International
Chart captions by PT
Full story here Are you the author?Tags: Chart Update,dollar price,gold basis,Gold co-basis,gold price,gold silver ratio,newslettersent,Precious Metals,silver basis,Silver co-basis,silver price