In one of those rare turns, the term “globally synchronized growth” actually means what the words do. It is economic growth that for the first time in ten years has all the major economies of the world participating in it. It’s the kind of big idea that seems like a big thing we all should pay attention to.
In The New York Times this weekend, we learn:
A decade after the world descended into a devastating economic crisis, a key marker of revival has finally been achieved. Every major economy on earth is expanding at once, a synchronous wave of growth that is creating jobs, lifting fortunes and tempering fears of popular discontent.
It’s that last one where the narrative takes on its current tinge of desperation. After the “unexpected” downturn in 2015-16 that sparked widespread global “discontent” at the ballot box, many in the so-called establishment wish for it to have been illegitimate; nothing more than the world’s xenophobic racists allowing their xenophobia and racism to undermine tighter and beneficial globalizations.
That’s ultimately the problem, though. There wasn’t supposed to have been any downturn at all; in 2015-16, or any other period. In fact, what really sparked populism is that to this day there isn’t any official acknowledgement that anything was wrong at the time, a microcosm of whole last decade. Even this “globally synchronized growth” is an attempt at a whitewash; the populists were wrong, it is now claimed, when they tried to turn “transitory” negative factors into something more than they were.
But it’s always the optimistic side that does that, the very thing many people at the electoral margins are simply fed up with. In fact, we’ve been here before. Just three years ago in late 2014 and early 2015 the explicit idea of “global growth” was just as ubiquitous. We are supposed to notice the difference, this later addition of synchronized economies as if that was the temporarily missing piece.
The problem with that view is the same one as we’ve witnessed all along. Does it matter whether eight of the ten largest economies are growing at a slow, painful rate, while two are contracting, or instead where all ten are now growing at the same slow, painful rate? The occasional minus sign is what many believe is key, but that’s the wrong focus. There is a meaningful difference between positive numbers and growth. There is no difference between lackluster, low-level plus signs and lackluster, low-level minuses.
Swinging back and forth between them over the period of several years would drive any population to seek alternatives. Doing so especially where the upturns are every single time characterized as the big one simply demonstrates nobody has any real answers. It’s the same fingers crossed strategy that has been implicit from the day Ben Bernanke told Congress subprime was contained. Almost eleven years later, it still isn’t.
There are several ways to check these assumptions. Given what is supposed to be behind any of them, monetary policy, inflation is one important weak spot.
|
Inflation Europe, Jan 2007 - Oct 2017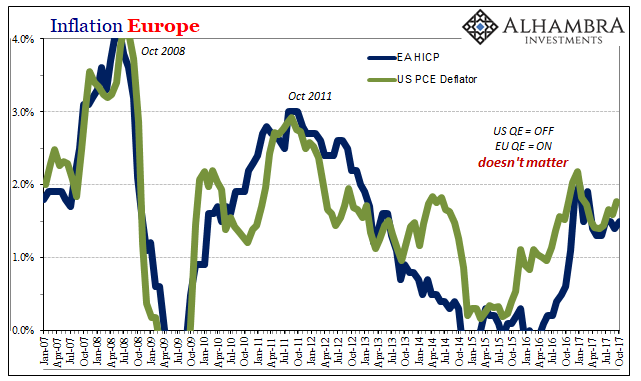 - Click to enlarge |
| As noted on numerous occasions before, Europe’s inflation rate is far too closely correlated with the American (or Chinese). Thus, if Europe’s “cheap money” is working, then it’s spillover should be apparent there and here. It isn’t. |
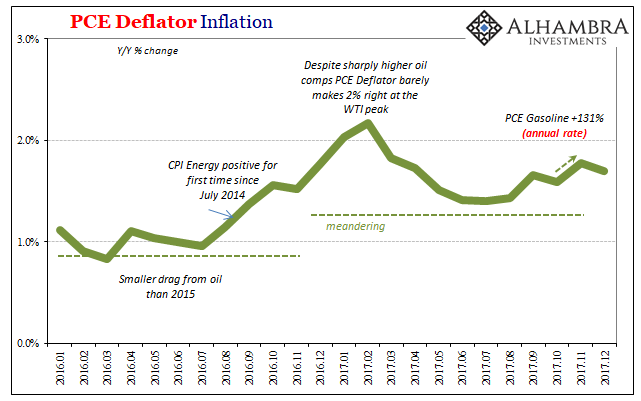
PCE Deflator Inflation, Jan 2016 - 2018 |
| The BEA reported last week that the US PCE Deflator slowed slightly in December 2017 despite another healthy (seeming) contribution from energy. At just 1.70% year-over-year (compared to 1.77% in November), that’s the 66th time out of the last 68 months the PCE Deflator has failed to register 2%. Given the Fed’s actual mandate, sustained 2% inflation, they are coming up on 6 full years of continuous failure. That’s some really cheap cheap money. |
PCE Chain-Type Price Index, Jan 2004 - 2018 |
| More important than past failure is that there really isn’t any indication this is about to change. |
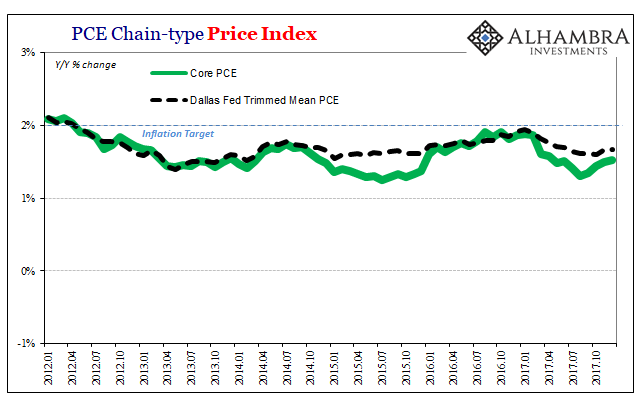
PCE Chain-type Price Index, Jan 2012 - 2018 |
| The addition of the term “synchronized” is intentional on that count. Core inflation rates like the PCE Deflator exclusive of food and energy, or the Dallas Fed’s trimmed mean measure, clearly lack for price momentum no matter all that. |
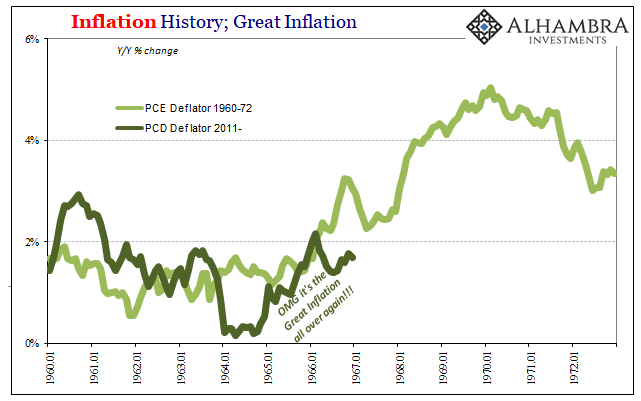
Inflation History, Jan 1960 - 1973 |
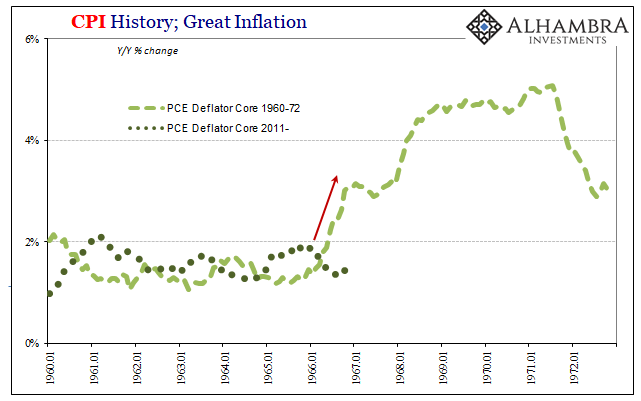
| This is an important omission, because in the past bouts of significant inflation have all been broad-based. If “cheap money” was working, these would all be really moving. |
CPI History, Jan 1960 - 1973 |
| What’s really going on is much simpler, and it’s the same as has been going on since 2007. The media, driven by economists, is making more out of what is relative improvement than is warranted. In other words, 2015-16 was bad; in many places around the world 2008 bad. Last year, 2017, wasn’t as bad. Minus signs disappeared over that interim. |
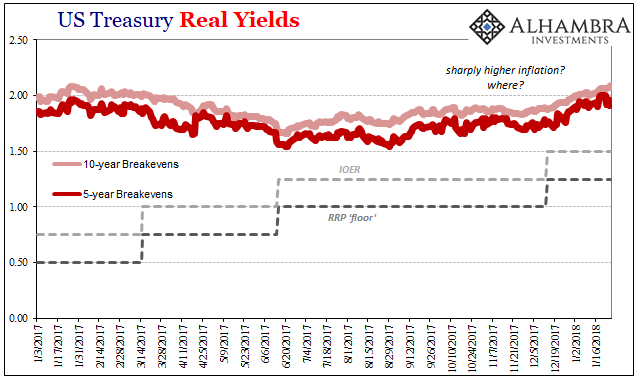
US Treasury Real Yields, Jan 2017 - 2018(see more posts on U.S. Treasuries, ) |
| Market prices understand the difference. Even though inflation expectations have risen since the middle of last year, that’s not the same as rising inflation expectations. |
US Treasury Real Yields, Jan 2007 - 2018(see more posts on U.S. Treasuries, ) |
| TIPS yields and breakevens still register expectations for persistently low and undershooting inflation. What’s changed is that these markets now price less of an undershoot than they did two years ago. |
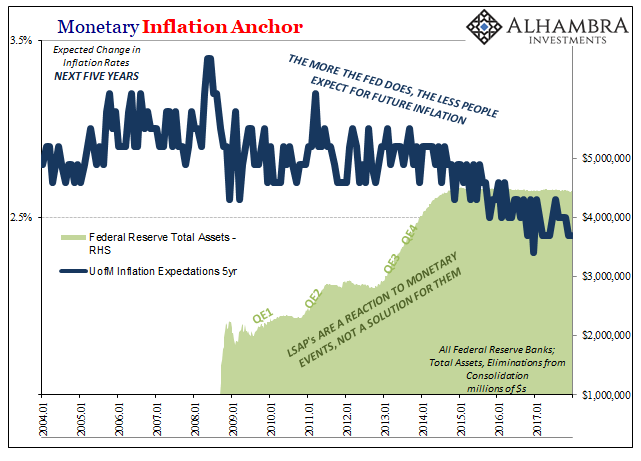
Monetary Inflation Anchor, Jan 2004 - 2018 |
| In other words, what changed in markets was an outlook that was less bad, not one that became good. Throughout 2017, economic statistics including those for published inflation rates (again, US as well as Europe) confirmed that view month after month. Economists and the media were confused; markets understood the big difference.
As worrisome as all that is, there are quite a few indications that last year was the best we might see in terms of this upturn mini cycle. Not only have the Chinese reported concerning economic results lately, there are widespread indicators flashing another second derivative change. That doesn’t mean recession is ahead, though it’s not ruled out, but it does suggest that lackluster, low-level growth is proving yet again the ceiling for the upside.
|
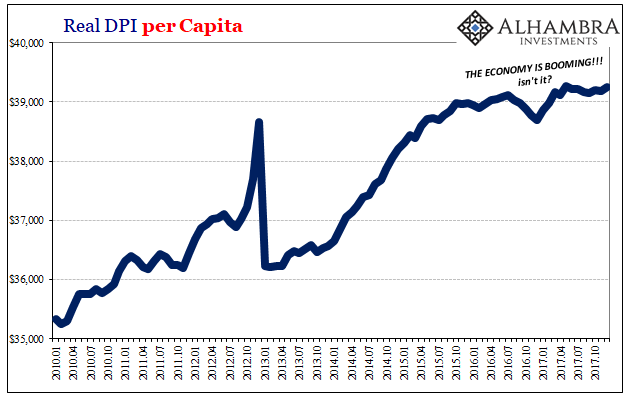
Real DPI per Capita, Jan 2010 - 2018 |
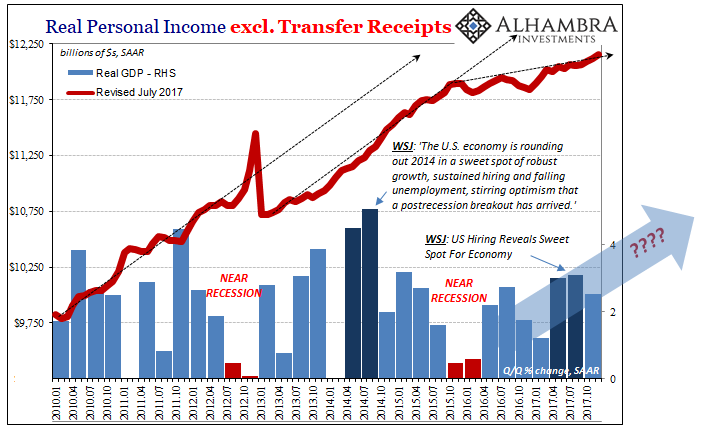
| It’s a disappointment all-too-consistent with non-excitable views on inflation. The story of the PCE Deflator last year is one conspicuously devoid of momentum. As noted earlier today, in the very same Personal Income and Spending report from the BEA it took a collapse in the savings rate just to keep the US economy in low-level positive GDP. The reason for a decade low in savings is the dramatic, and persistent, slowdown in the labor market. |
Real Personal Income, Jan 2010 - 2018 |
If there is a basis for “tempering fears of popular discontent”, I just don’t see it. I see, in fact, quite the opposite. Unlike inflation rates, the rhetoric heats up but the global economy never does. People are tired of being told how things are getting better when they aren’t; especially when the case for the positive is never reasonably supported. It’s all based entirely on what the economy “will do” when over the last ten years it never did.
Something substantial and meaningful will have to change to make the outcome different this time. The absence of minus signs while nice isn’t nearly as significant as it is made out to be.
Tags: Core Inflation,CPI,currencies,economy,Europe,Federal Reserve/Monetary Policy,hicp,inflation,inflation breakevens,inflation expectations,Markets,Monetary Policy,newslettersent,pce deflator,QE,TIPS,U.S. Treasuries


