Joseph Y. Calhoun
My articles My siteAbout meMy videosMy books
Follow on:LinkedINTwitterSeeking AlphaAmazon
Economic Reports
Production
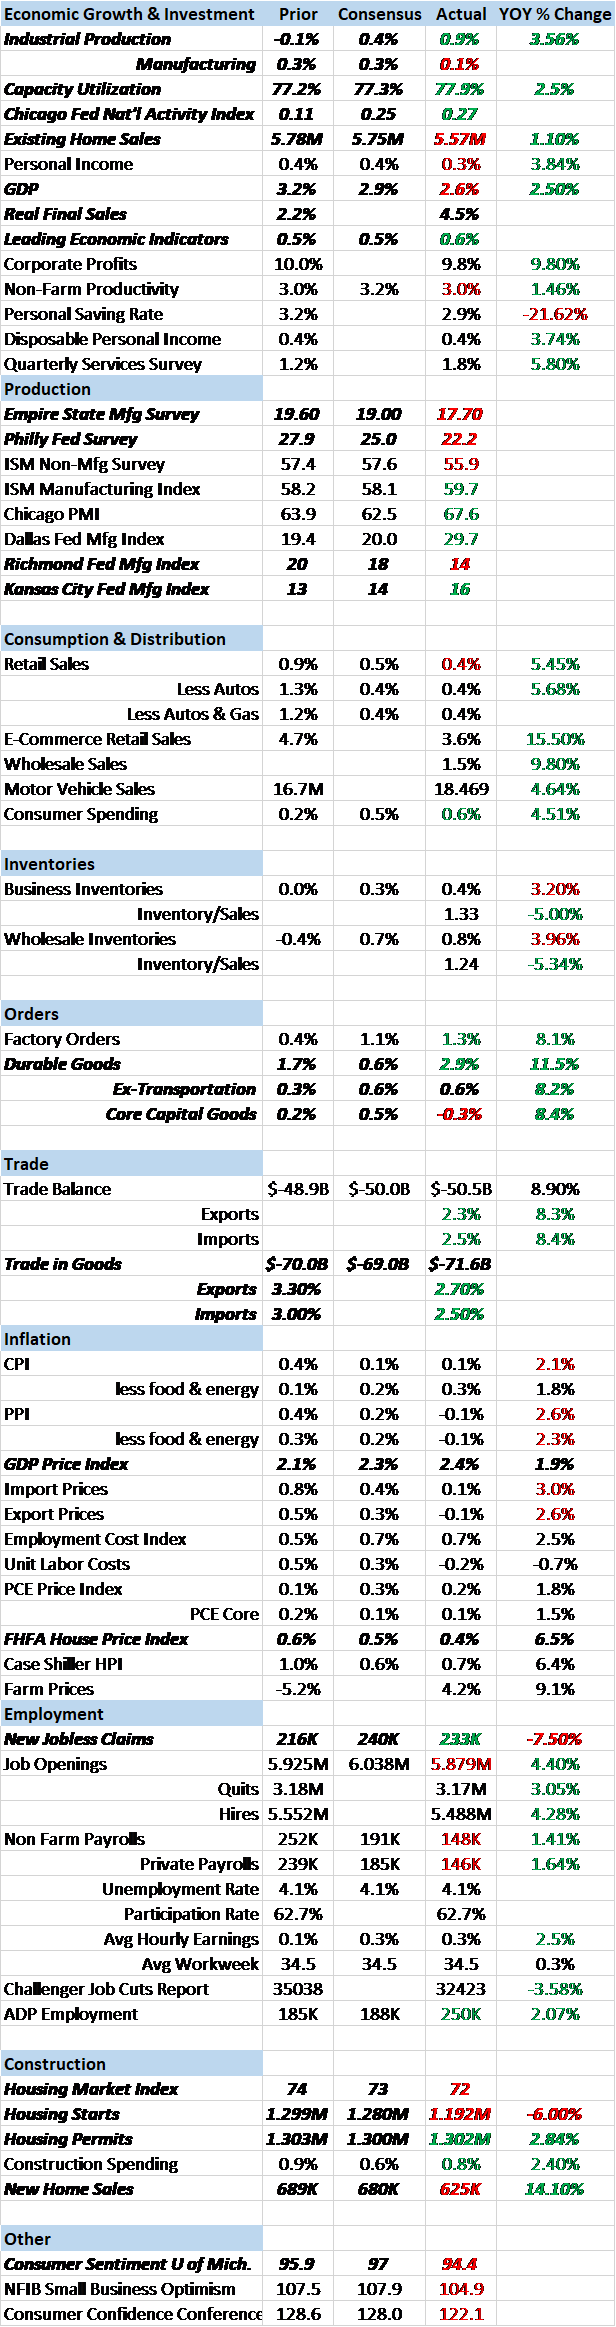
Production ended the year on a strong note but early readings from January are not as positive. The December industrial production report headline was strong at a 0.9% gain but a lot of that strength was in the mining (oil drilling) and utility sectors. Mining has actually led the way the last year as rig count has risen with drilling activity. I’d love to see our economy less dependent on the price of oil but that is what we’ve become over the decade or so. Utility output was obviously up due to some severe cold weather up north so that isn’t indicative of anything except the desire to stay warm. The manufacturing part of the IP report was much more subdued and, like a lot of reports recently, less than expected.
The IP report was less than inspiring but durable goods orders were quite a bit more positive. The headline was skewed form Boeing’s orders at the Dubai Air Show but are up a very healthy 11.5% year over year which is the best of this cycle (excepting the outlier of 7/14) and solidly above the peak of the last cycle. Ex-transportation was also strong, up 8.2% year over year for the best reading of this cycle if still slightly less than the last peak in 2008. The laggard in the report was core capital goods orders, a big miss at -0.3% versus expectations of +0.5%. Year over year looks better at +8.4% but the reading is still less than the 2000 peak so there is still a long way to go for a healthy investment outlook.
The regional Fed surveys released over the last two weeks (Empire State, Philly, Richmond and KC) were less than expected with the exception of KC which is influenced more by shale activity.
Overall, production ended the year on a fairly strong note, especially durables. But the regional Fed surveys are mostly pulling back from their best levels and frankly, the very positive sentiment of these reports over the last year never showed up in the actual economic reports. I think the most disturbing aspect of these reports is that they are being driven by oil drilling activity. If oil prices fall – and there are technical reasons to believe that may be in the offing – economic growth is going to take a hit. President Trump would be well advised to pay more attention to oil prices and less to stocks.
Housing
The reports on the housing sector were uniformly disappointing. Housing starts were less than expected and down 8.2% from November to December, some of which might be fairly blamed on cold weather. For a change it was single family starts leading the drop, down 11.8% versus a 1.4% gain for multi-family. Permits were stronger but as I’ve noted before, permits don’t mean a lot if sales start falling. They permit building not mandate it. New home sales are still in an uptrend even with December’s disappointing numbers; November was revised lower while December dropped another 9.3% from that reduced level. But, as I said, sales are in an uptrend and at 625K are gaining on single family completions which are running at about an 800K rate. Inventory is now at 5.7 months. The increased activity is reflected in the Housing Market Index, a builder’s sentiment index which was less than expected at 72 but still quite strong.
Existing home sales don’t have as much impact on the economy as new building but are still important as economic indicators. What they seem to be saying recently is that people aren’t much interested in moving. Sales were down 3.6% month to month and are up only 1.1% year over year. That may be because prices are rising a lot faster than incomes but even prices rising at a 6% annual rate aren’t enough to lure in new sellers. Inventory is at just 3.2 months, a 19 year low.
Economic Growth
The economy ended the year on a down note with GDP coming in at a less than expected 2.6% annual growth rate in the fourth quarter. The headline number was pulled down by inventory growth that was less than last quarter and a widening trade deficit, but neither of those items are actually all that negative. Inventory/sales ratios have fallen a bit recently as sales outstripped the inventory build so if sales growth stays up we may see more production not less. And on trade, exports and imports are both rising, a pretty good sign for the global economy. Real final sales to domestic purchasers were up at a 4.5% rate in Q4.
Still, year over year economic growth is 2.5%, the top of the recent range and not particularly robust. The Chicago Fed National Activity Index says that isn’t likely to change much. The CFNAI came in at 0.27 and most of the gain above zero – which indicates growth at trend – was from the aforementioned mining and utilities. In other words, outside of the shale patch and some cold weather, we’re growing at trend which has been a plodding 2% for the last several years.
The leading economic indicators were solid at 0.6% but a lot of the gain was from the new orders component of the ISM report so I think it is just another indication that we are growing at the previous trend. On the other hand, as far as I know we’ve never started a recession with the LEI rising so there doesn’t seem to be any danger of that right now.
Inflation
The GDP price index showed inflation at a 2.4% annualized rate in the Q4 with the year over year change at 1.9%. That would seem to point to continued Fed tightening.
And as I noted above, house prices are rising at robust rate with the FHFA price index showing a 6.5% year over year gain in the most recent report.
Trade
International trade in goods showed healthy gains of 2.7% and 2.5% for exports and imports respectively. While the increase in the trade deficit reduces reported GDP, rising imports does not a weak economy make. But frankly, these numbers are irrelevant for now as we wait to see what else the Trump administration trade team has up its sleeve. More importantly maybe will be how our trading partners – a phrase that seems oddly quaint with this administration – respond to increased tariffs and weak dollar talk.
Employment
Jobless claims continue to trend at lows not seen since the 1970s. We tend to pay more attention to the year over year change in the 4 week average which is still slightly negative (meaning fewer claims). The year over year change generally turns positive prior to or at the onset of recession.
Sentiment
The U of Michigan consumer sentiment survey was less than expected and at a six month low at 94.4. Current conditions are at a 15 month low. A curious result given the recent passage of the tax bill. Reality setting in?
Market Indicators10 Year Treasury Note YieldThe 10 year Treasury note yield rose 11 basis points over the last two weeks and is now at the highest level in four years. This indicates a rise in nominal growth expectations that, in this case, is dominated by a rise in inflation expectations. I was a bit surprised that we didn’t see a more rapid sell off after breaking above 2.63%, a widely watched technical level. We have, however, seen speculators shift their position in the 10 year from net long to net short in recent weeks so maybe the bulk of the selling was done in advance of that level. |
US 10 Year Treasury Yield, Sep 2013 - Jan 2018(see more posts on U.S. Treasuries, ) - Click to enlarge |
10 Year TIPS YieldThe yield on 10 year TIPS were also higher but only by a couple of basis points. Since mid-November the yield on the 10 year note is up about 30 basis points while the TIPS yield is up about 5. As I said, the gain in the 10 year note yield is primarily about inflation expectations, not real growth. And that in turn is probably mostly a function of the falling dollar and rising oil prices. |
10 Year Treasury Inflation - Indexed Security, Jul 2013 - Jan 2018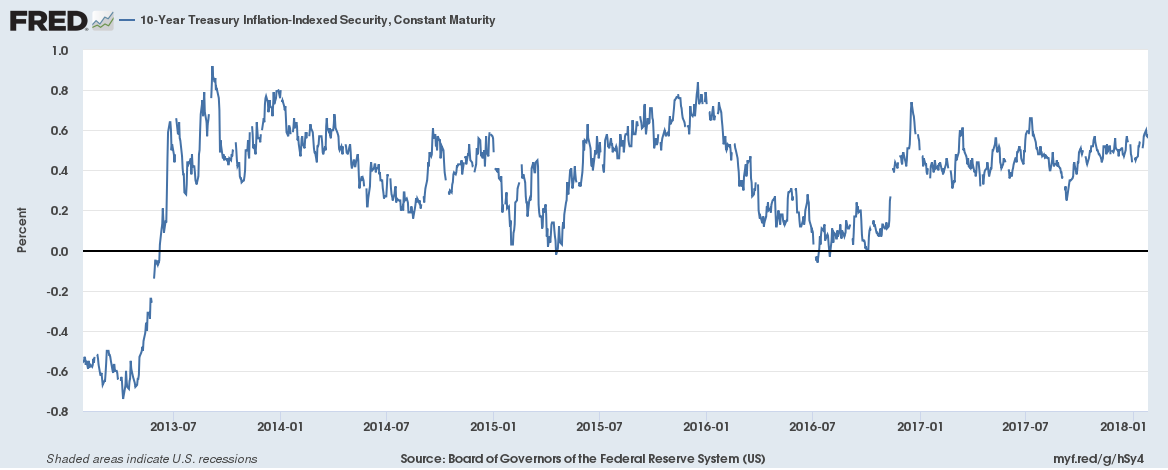 - Click to enlarge |
10/2 Yield CurveThe yield curve continues to flatten, the difference between the 10 year and 2 year yield falling another 3 basis points since the last update. The continued flattening of the curve defies the accelerating growth narrative that seems to be driving the stock market. But flattening does not mean flat and it doesn’t mean recession. It just means we continue to move through the business cycle and the Fed is likely going to keep pushing short rates higher until they invert the curve. Or at least, that’s what history says. |
Yield Curve - 2 Year Bonds, 1993 - 2018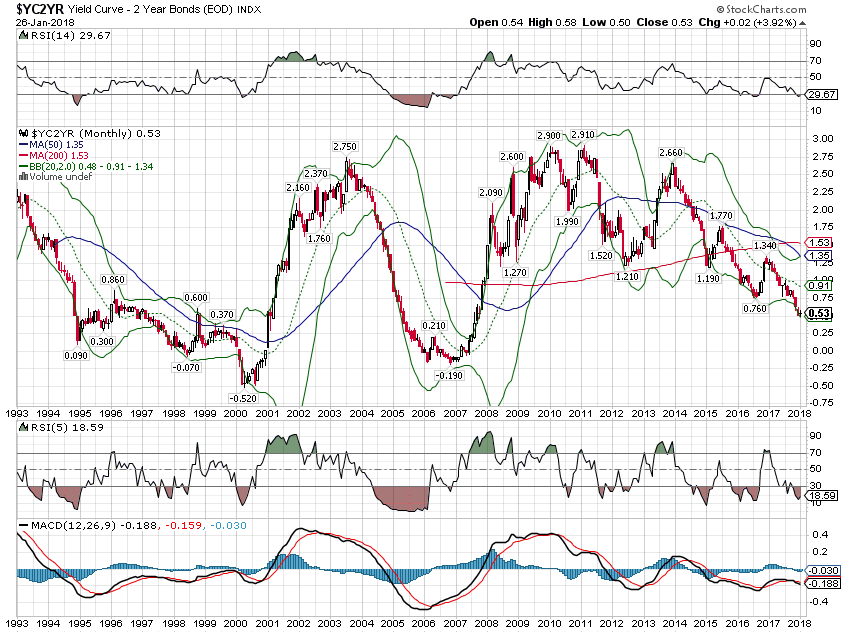 - Click to enlarge |
Credit SpreadsSpreads continue to narrow, risk appetite apparently insatiable. We are now at the lowest spreads of this business cycle but still over 80 basis points from the lows of last cycle. Don’t think risk taking can’t take another leg higher. We are unlikely to see spreads widen until there is more indication of slowing growth. |
BofA Merrill Lynch US High Yield Option, Jan 2007 - 2018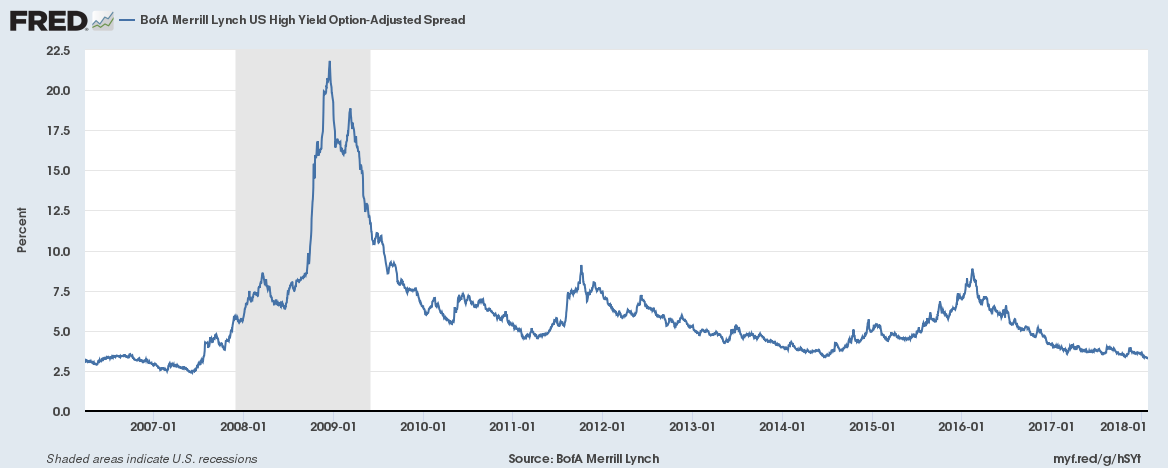 - Click to enlarge |
US DollarI’ve said it since the election and I will keep saying it. A President gets the dollar he wants and this one wants a weak one. He has said so directly and indirectly since taking office and his Treasury Secretary, like everyone else on the planet, has taken it to heart. Last week in Davos, Mnuchin made about as clumsy a statement on the dollar a Treasury Secretary has ever made without causing a crash somewhere. Yes, I know he says his comments were taken out of context and the President tried to walk it back the next day, but the world already knows what they want and they are giving it to them good and hard. The administration’s trade policy just reinforces the message as they raise the importance of the trade balance to a level it doesn’t deserve. There is a perception that the weak dollar is a reflection of the world’s view of President Trump and there may be some truth to that. But, to be blunt, Mnuchin is clueless on economic policy and inspires zero confidence. Despite the Trump administration, the dollar is approaching support and seems likely to bounce soon. Speculators have warmly embraced the Euro rally and are now holding record long positions versus the dollar. Positioning isn’t as one-sided in other currencies though so a Euro correction probably won’t be enough to change the dollar downtrend. |
US Dollar Index, 1998 - 2018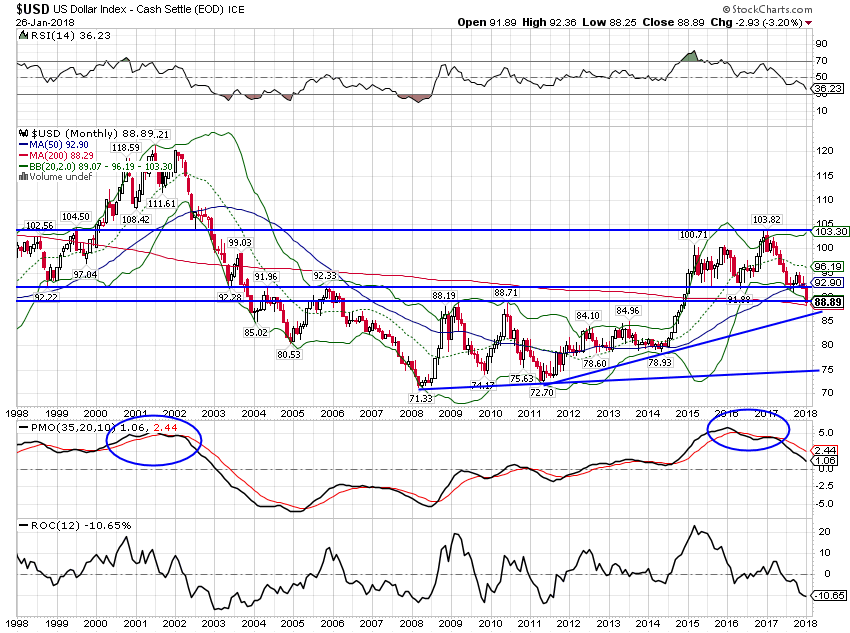 - Click to enlarge |
CommoditiesAs the dollar falls, commodities tend to move in the opposite direction. Gold, especially, responds positively to a weakening dollar and the last two weeks were not an exception. Gold prices rose nearly $30 before pulling back slightly last Friday. That outcome directly undermines the goal of the recent corporate tax changes. Investments in gold are not going to move the needle on productivity or economic growth. |
Gold Daily, Jul 2017 - Jan 2018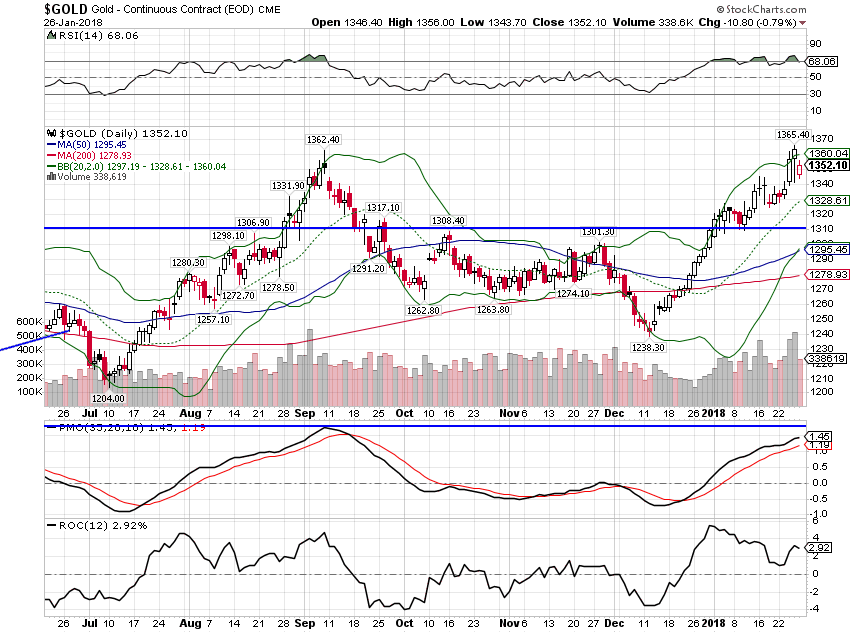 - Click to enlarge |
| The more general commodity index is also climbing, pushing up costs for US companies. Ford recently cited higher metals costs for a disappointing earnings outlook. |
Bloomberg Commodity Index, Jul 2017 - Jan 2018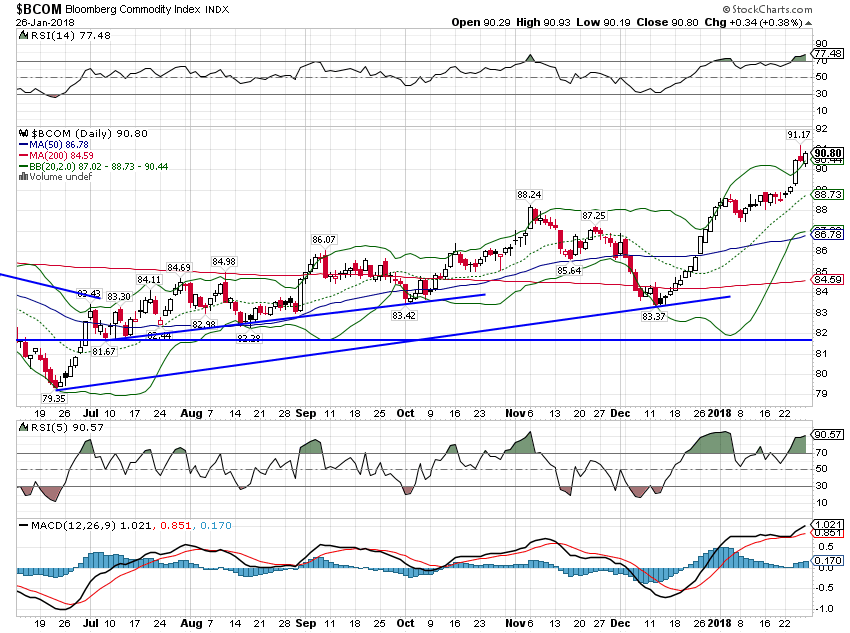 - Click to enlarge |
| American Airlines reported lower earnings last week as fuel costs rose over 20%. American talked fare hikes but based on expansion plans from other carriers, a fare war seems more likely. Like a lot of recent trends, the one in crude is getting quite extended. As with the Euro, speculators have built a huge long position in crude oil futures so if it starts to fall, expect a rapid selloff. |
Light Crude Oil Daily, Jul 2017 - Jan 2018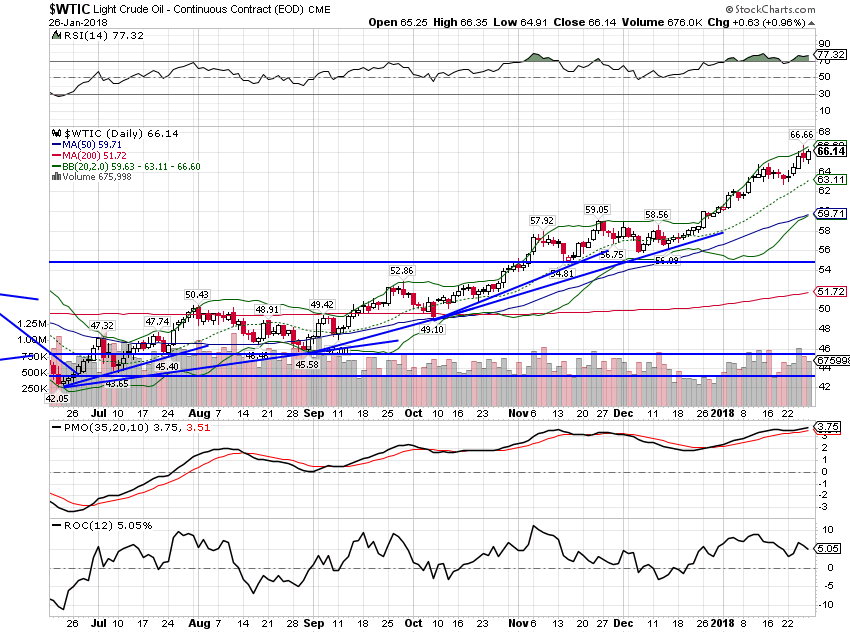 - Click to enlarge |
| From an economic growth perspective, the copper/gold ratio provides more guidance and it is somewhat negative. The ratio has fallen since the beginning of the year as the two metals have moved in opposite directions, gold up and copper down. The fall, if it continues, should pull bond yields back down as well. |
Copper:Gold Daily, Jul 2017 - Jan 2018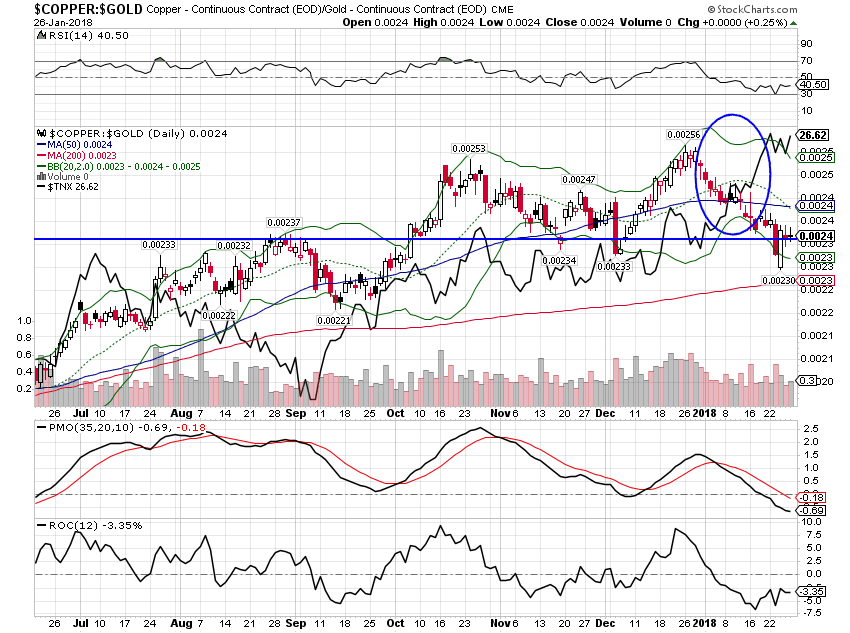 - Click to enlarge |
Despite the enthusiasm of US stock punters, the economic outlook really hasn’t changed all that much. Further, the biggest, most obvious changes are not necessarily positive. The falling dollar is pushing up inflation expectations and if it continues will likely spur the Fed to take a more hawkish approach to monetary policy. That would likely offset, to some degree, the positives of the recent corporate tax reform. In addition, the falling dollar does not support the administration’s narrative of increased US investment. Indeed, capital would appear to be flowing out of the US, not in as expected. And if it continues it will just further deter future direct investment in the US.
As I noted several times above, some of these trends are quite stretched and due for, at least, some kind of correction. Three markets in particular look ripe for short term reversals: the dollar, crude oil and bonds. The dollar is a key driver of many of the trends we see today in our market based economic indicators. A correction in the trend seems likely as speculative positioning is overwhelmingly short dollars with the exception of versus the Yen. The Euro market is particularly one-sided and the fundamental support seems weak. The same could be said of crude oil where speculators have built record long positions. The futures positioning for the 10 year Treasury note is not as extreme as these other markets but speculators are net short. And a reversal of the dollar and crude oil trends would probably be sufficient to generate a rally in bonds. As for stocks, well nothing else has dented this bull market, but if doubts creep in about future growth that might change.
Having said that, I don’t try too hard to anticipate these moves. Markets at extremes can easily get more extreme – and have repeatedly over the last two decades. And even if these corrections happen as I expect, it won’t change the economic outlook all that much. There is nothing in the yield curve or credit spreads that indicates imminent recession and a dollar rally back up to the downtrend line won’t change that. The US economy is tracking at the high end of its recent growth range but has yet to break out. Will it? As you know if you’ve been reading these for a while, I have my doubts but I’d be happy to report that I’m wrong. So far, there is nothing in markets that makes that necessary.
Tags: Alhambra Research,Bi-Weekly Economic Review,Bonds,commodities,Consumer Sentiment,copper/gold ratio,credit spreads,Crude Oil,currencies,dollar,economic growth,economy,Euro,Gold,inflation,jobless claims,Markets,newslettersent,stocks,TIPS,trade deficit,U.S. Treasuries,Yield Curve