Joseph Y. Calhoun
My articles My siteAbout meMy videosMy books
Follow on:LinkedINTwitterSeeking AlphaAmazon
The economy ended 2017 with current growth just slightly above trend. In general the reports of the last two weeks of the year were pretty good with housing a standout performer going into the new year. We are still trying to get past the impact – positive and negative – from the hurricanes a few months ago though so it is probably prudent to wait for more evidence before making any definitive pronouncements about the economy. While the data has been good lately the reaction in our market based indicators remains fairly subdued. For now, those indicators continue to point to a continuation of the previous 2% growth path. Maybe tax reform and the optimism it has engendered can move the needle short term but with expectations so high, disappointment seems likely. Any change in policy takes time to impact the economy and this one is no different.
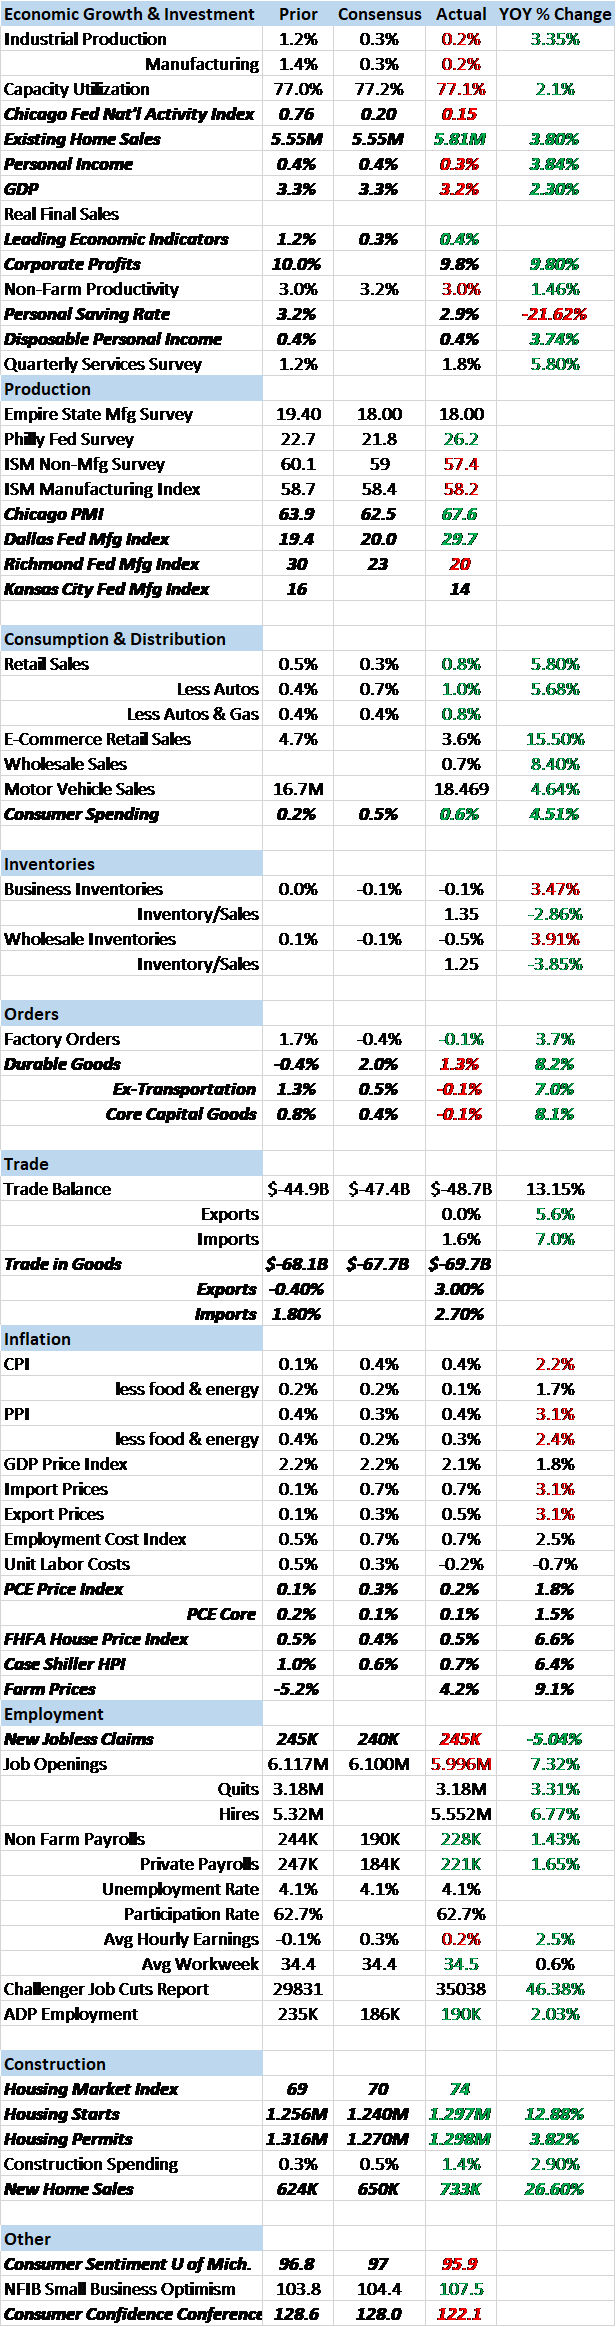
The most recent GDP revision shows the US economy to have grown 2.3% year over year. That is consistent with the reading we got from the Chicago Fed National Activity Index, which came in at a slightly less than expected 0.15. The CFNAI tracks the broad economy relative to trend so a positive number means the economy is growing above trend. But 0.15 means it is growing only a little above trend. The 3 month moving average of the indicator is at 0.41 which is a little better. Most important is that a 3 month average of -0.75 is considered the warning sign for recession and we obviously aren’t even close to that.
As you might expect with national activity around trend, the economic reports are mixed, some doing well and others not so much. In the former category falls most anything related to housing these days. Housing starts and permits, new home sales and existing home sales were all better than expected and are trending nicely higher right now. Starts and permits are still below the peaks for this cycle but the recent trend is definitely higher. And new home sales are at the high of this cycle and back to the middle of the old trend. Still, adjusting for population, I’d like to see a higher number so this is good news but qualified. The Housing Market Index, an indicator of sentiment at the builder level, shows a lot of optimism coming into the new year.
House prices are also on the rise with both the FHFA and Case Shiller indexes showing gains of roughly 6% year over year. Interestingly, new home prices were actually down on the month and barely changed over the year. That is partially a function of inventory with just 3.4 months of supply in existing homes at the current sales pace. The rise in prices is a double edged sword of course. Great if you already own a home but not so much if you are looking to buy.
And making that equation a little more difficult is that incomes are not rising nearly as fast as house prices. Personal income was up a less than expected 0.3% for the month but only 3.8% year over year. There may be some hurricane distortions in the numbers the last few months though as transfer payments were down sharply on the month while wages and salaries were up 0.4%. The transfer payment drop is probably in the food stamp area. Here in Florida, for instance, the state provided food assistance to 2.7 million people who don’t normally receive food stamps. And about all you had to do to get it was show up and show a driver’s license. Total tab? About $900 million. That assistance was one time though and didn’t repeat in November.
Consumer spending was a little better than expected but that was at least partially due to higher gas prices. Sales of durable goods were unchanged as vehicle sales softened, again an artifact of hurricane distortions. With spending up more than incomes, the difference is seen in the savings rate, down to 2.9%. The rate is down over 21% year over year. There are two ways to look at that. The positive interpretation is that individuals are so confident they don’t see the need to save. The negative view is that they couldn’t save because they didn’t have the income. The answer, as with so many things, is likely in the middle. The consumer confidence is still at a high level arguing for the positive but incomes are growing at less than 4% annually confirming the more dour view.
On the negative side of the ledger, durable goods orders were up a less than expected 1.3% and that was only because of a 31% surge in orders at Boeing. Ex-transportation, orders were down 0.1%. Durable goods orders are still running less than the peak for this cycle in June of 2013. Ex-transportation orders are still well below the peak of the last business cycle and core capital goods orders are less than they were in June of 2000. Still, last month’s report was revised higher and total orders are up 8.2% year over year. Capital goods orders are up 8.1%. Will the short term trend be extended in the new year? It is something to keep an eye on for sure. We will eventually break the old highs but whether that is this cycle or next is something I can’t answer.
| More positive was the trade report which showed both exports and imports rising. On the export side, capital goods and vehicles were big winners. The import side was more evenly spread with most categories up. One thing that must be considered though is the price of oil which now affects both numbers. Also, the way GDP accounting works, because the deficit was wider (exports up more than imports) Q4 GDP will be reduced. Also of note were several regional Fed surveys with Dallas up and KC and Richmond down. That isn’t surprising when one considers oil over $60/barrel. And it raises the question of how much of the recent rise in investment (non-residential investment was a pretty big positive in the GDP report and was revised higher in the most recent report) is related to drilling oil wells. As we found out in 2015 and 2016, US economic growth has become more positively correlated with oil prices. Not a good thing in my opinion since our ability to affect oil prices is limited.
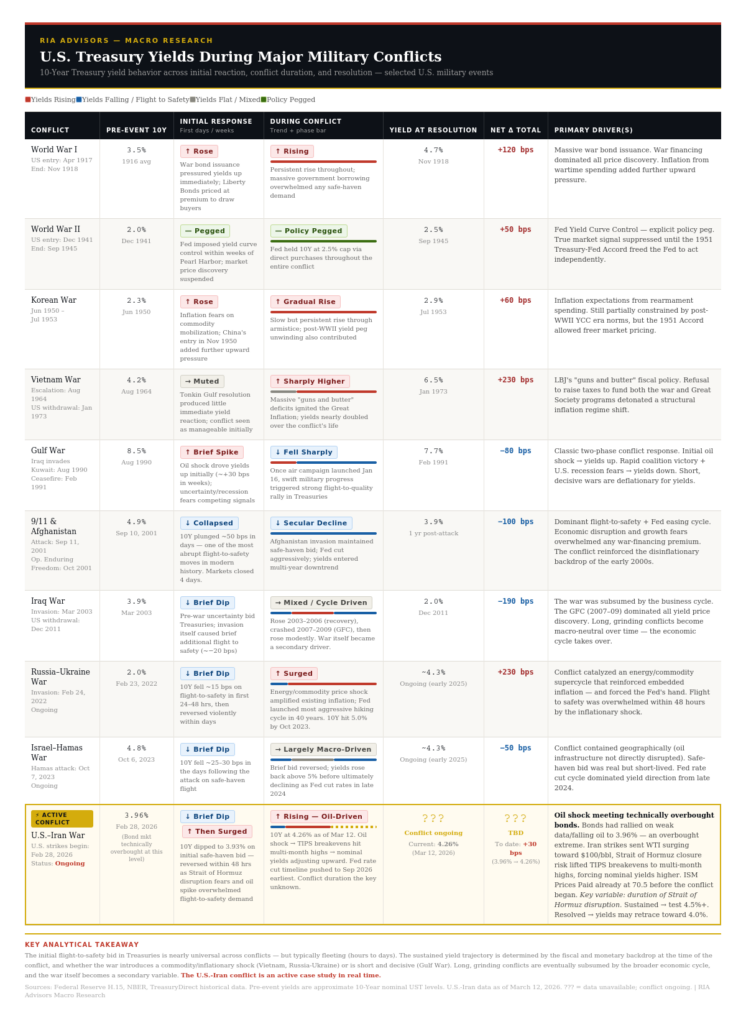
Our market based indicators basically confirm what we see in the individual economic reports and the CFNAI (an aggregate of a bunch of individual reports). The 10 year Treasury yield was basically unchanged for the year but it is much higher than the low set in 2016 when year over year growth was closer to 1%. With growth now a tad over 2%, the 10 year yield is trading in the top half of the range that has prevailed since 2013: |
US Treasury Yield Index, Apr 2014 - Dec 2017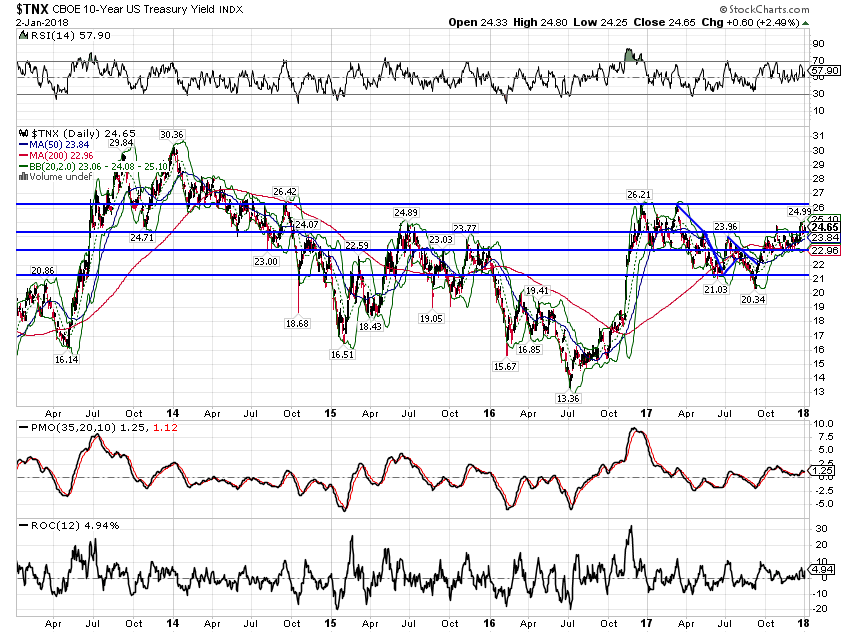 - Click to enlarge |
| The yield curve spent all of 2017 flattening and that tells us, more than anything else, that the Fed is more optimistic about the economy than the market. Greenspan’s conundrum is still around and no more a conundrum than when he first uttered the phrase. In short, the long end of the curve isn’t buying the growth acceleration story. |
10 Year Treasury Constant Maturity, 1990 - 2017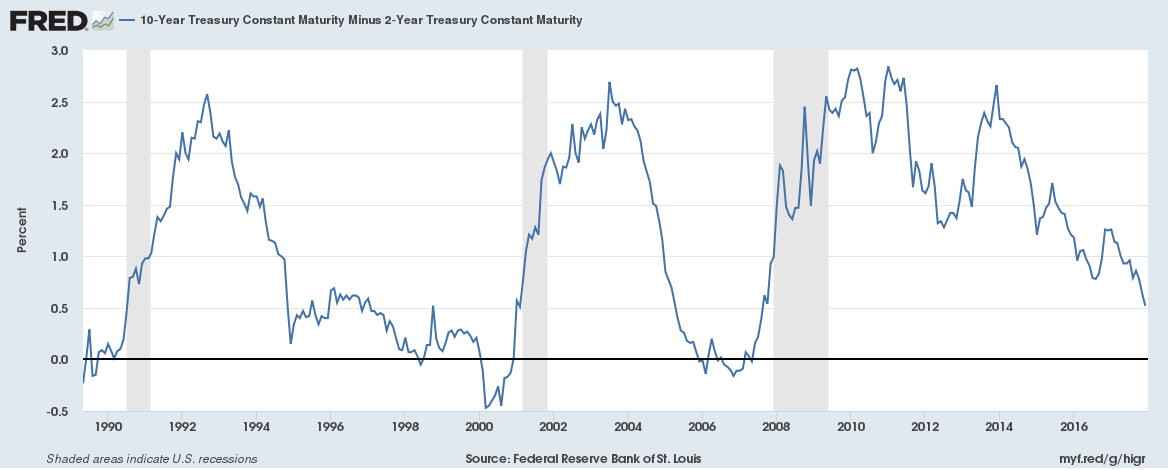 - Click to enlarge |
| Real interest rates tell a similar story about real growth. 10 year TIPS yields are remarkably stable, indicating little change in long term real growth expectations. 5 year TIPS yields have risen in anticipation of more Fed tightening. |
10 Year Treasury Inflation Indexed Security, Jan 2013 - Dec 2017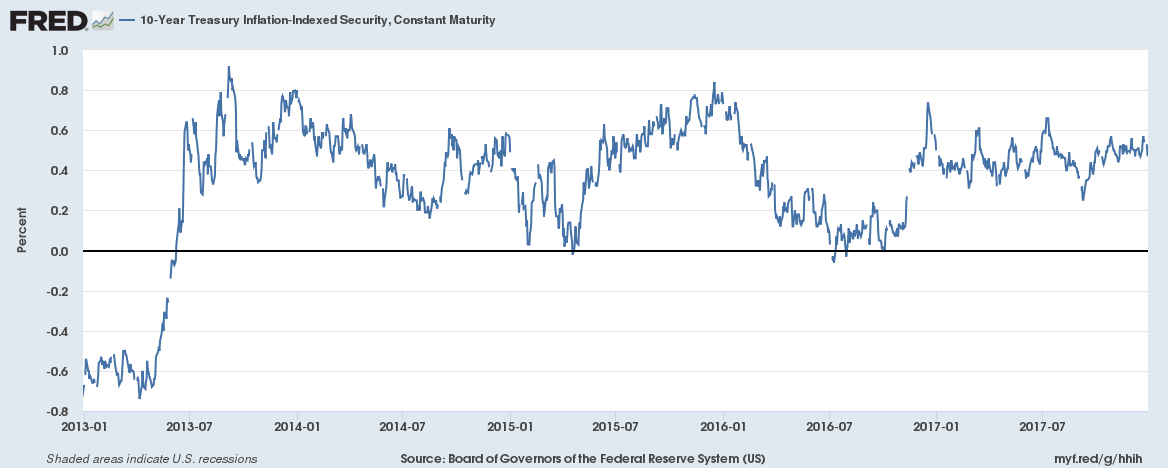 - Click to enlarge |
| The US dollar ended the year on its back foot, closing just a little above the lows (and has moved lower again to start the new year). As I’ve said repeatedly, if the market was anticipating a surge in US investment, a surge in US growth, the dollar would be acting better. Instead, it spent all of 2017 falling and appears to be extending the trend into the new year. Having said that, a negative view of the dollar isn’t the contrarian play it was a year ago; the bull herd has been thinned considerably. Technically I would expect to see mid to high 80s but probably not a lot lower – at least for now. |
US Dollar Index, Apr - Dec 2017(see more posts on U.S. Dollar Index, )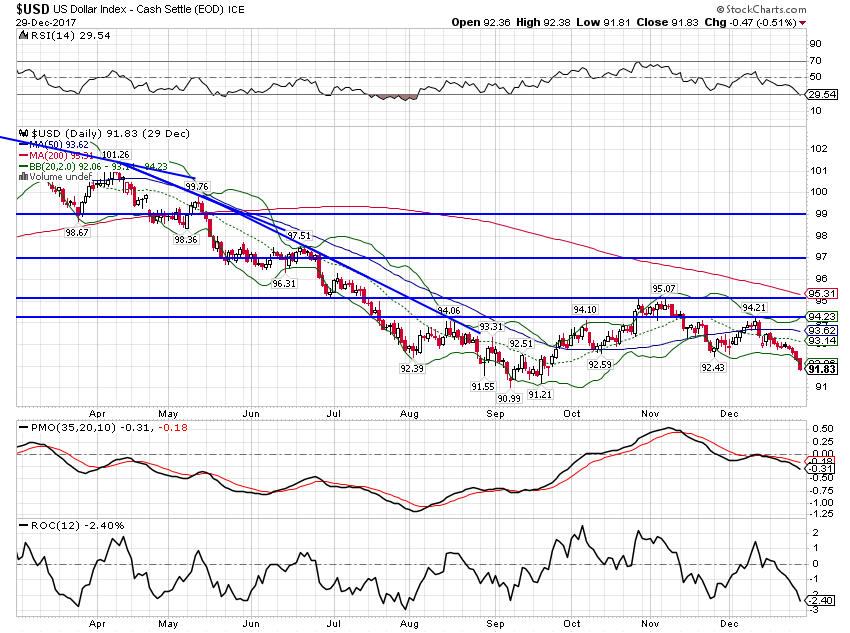 - Click to enlarge |
| The fall in the dollar is also driving gold prices up, another negative indication for growth. As I’ve said many times, people don’t buy gold when they have better investments available to them. |
Gold Daily, Jun - Dec 2017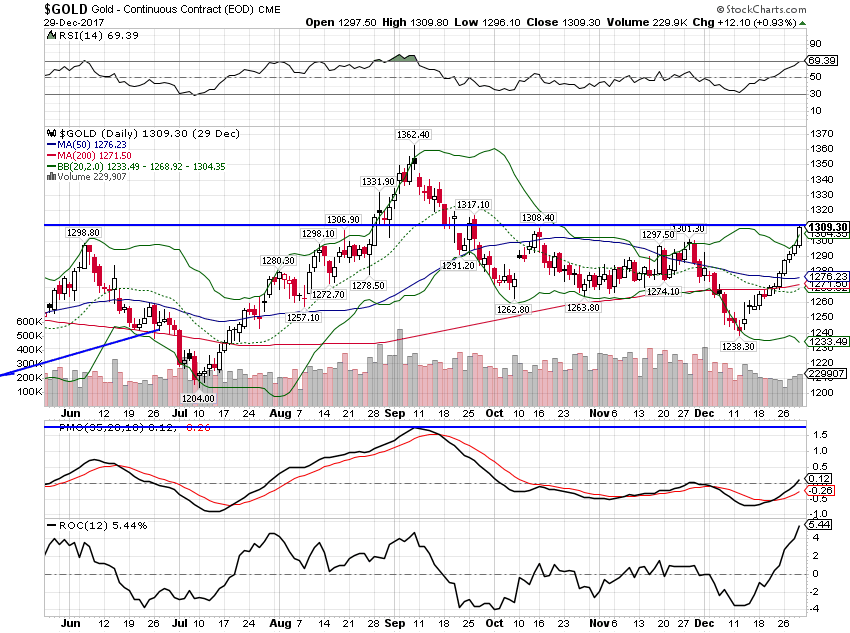 - Click to enlarge |
| The weak dollar impacts all commodities and while gold has been rising recently, it hasn’t risen as fast as copper. If the dollar keeps falling, it will eventually translate into higher inflation rates and that in turn will impact bond yields. I suspect though that it will primarily impact nominal rates while real yields remain tame. We may get a rise in nominal growth expectations but with a weak dollar it will primarily be driven by a rise in inflation. This cycle may turn out little different than the last one when the Bush administration enacted a tax cut and paired it with a weak dollar policy. That didn’t turn out very well with oil at nearly $150/barrel but that doesn’t appear to be a deterrent to the Trump administration. They might want to look up that Einstein definition of insanity. |
Copper : Gold Continuous Contract, Feb 2015 - Dec 2017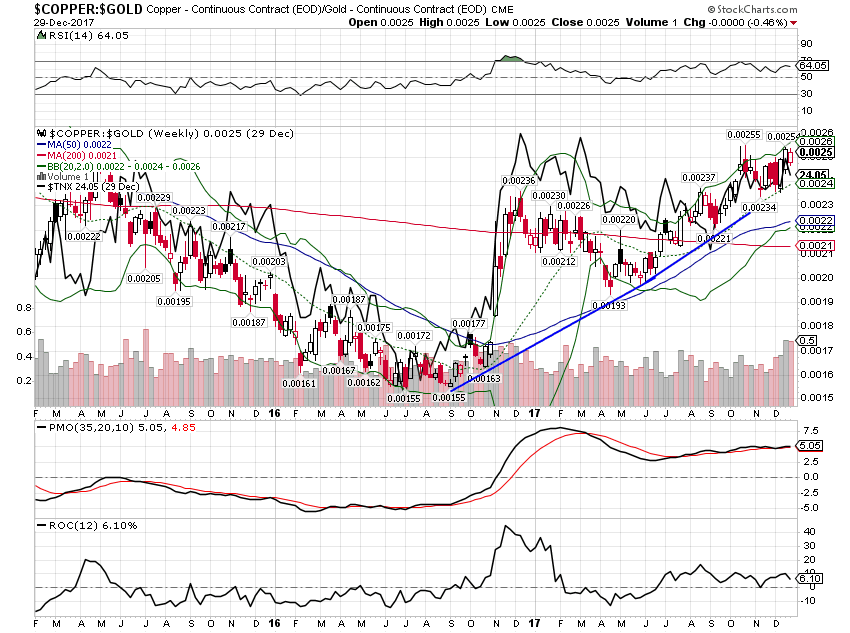 - Click to enlarge |
| Last of our market indicators are credit spreads. Junk bonds have recently been acting a bit toppy but spreads actually narrowed a little since the last update. Overall, spreads do seem to be trying to trace out a rounding bottom but as long as they aren’t widening significantly, there is no reason to be concerned. There will come a point in this cycle when no one wants to own credit bonds but we obviously aren’t there yet. |
US BofA Merrill Lynch High Yield Option, Jan 2013 - Dec 2017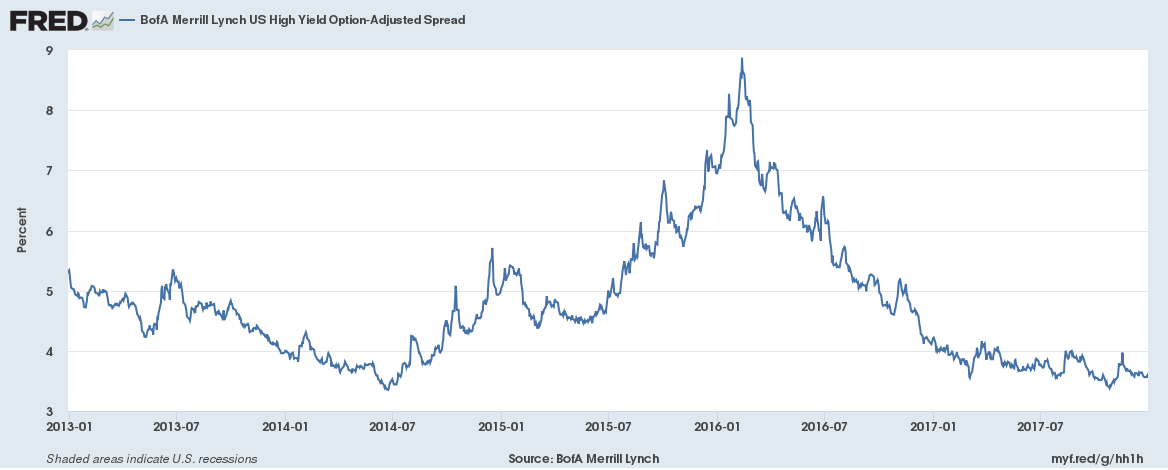 - Click to enlarge |
The US economy continues to grow at a sluggish pace but the rate of growth is up from the worst levels in 2016. Still, right now, I see nothing in our indicators that points to a further acceleration. Tax reform is done and with expectations sky high everywhere but the bond market, disappointment with the results seems likely so some kind of setback in stocks would not be surprising. But the most important take away from our indicators and the economic reports is that we aren’t close to recession and as long as that stays true, the odds of a bear market are pretty low. This has been one of the longest cycles in US history and it appears it will get even longer. One hopes the recession that follows it isn’t symmetrical.
Tags: Alhambra Research,Bi-Weekly Economic Review,Bonds,capital goods,cfnai,commodities,copper to gold ratio,credit spreads,currencies,economic growth,economy,Federal Reserve/Monetary Policy,GDP,Gold,Housing,income,inflation,Investing,Markets,newslettersent,real interest rates,stocks,Taxes/Fiscal Policy,TIPS,U.S. Dollar Index,US dollar,Yield Curve