See the introduction and the video for the terms gold basis, co-basis, backwardation and contang
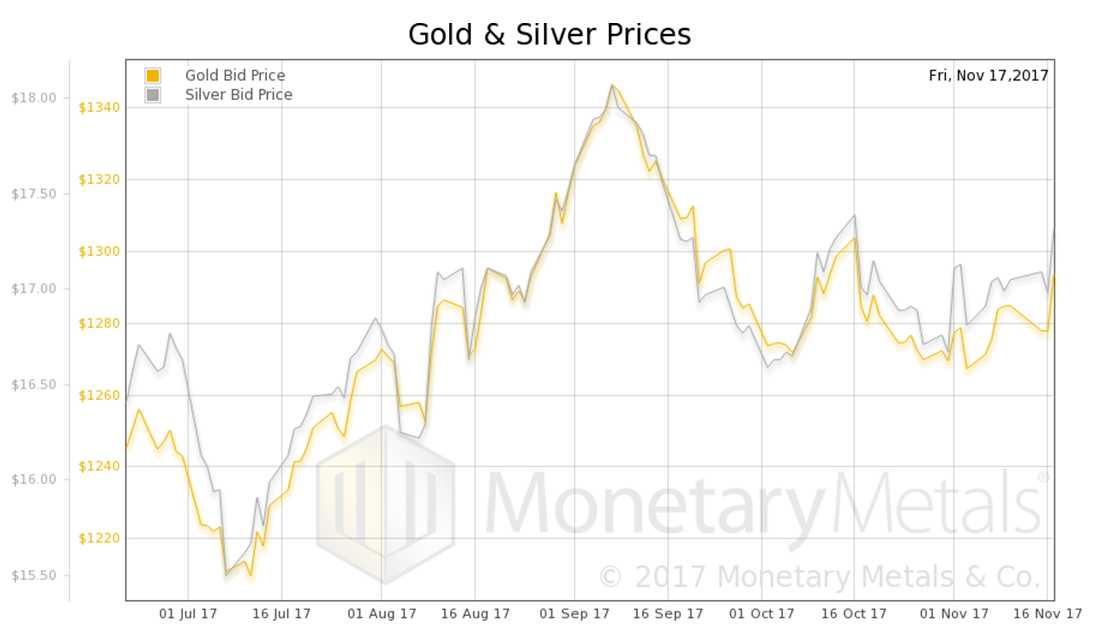
Reasons to Buy GoldThe price of gold went up $19, and the price of silver 42 cents. The price action occurred on Monday, Wednesday and Friday though so far, only the first two price jumps reversed. We promise to take a look at the intraday action on Friday. |
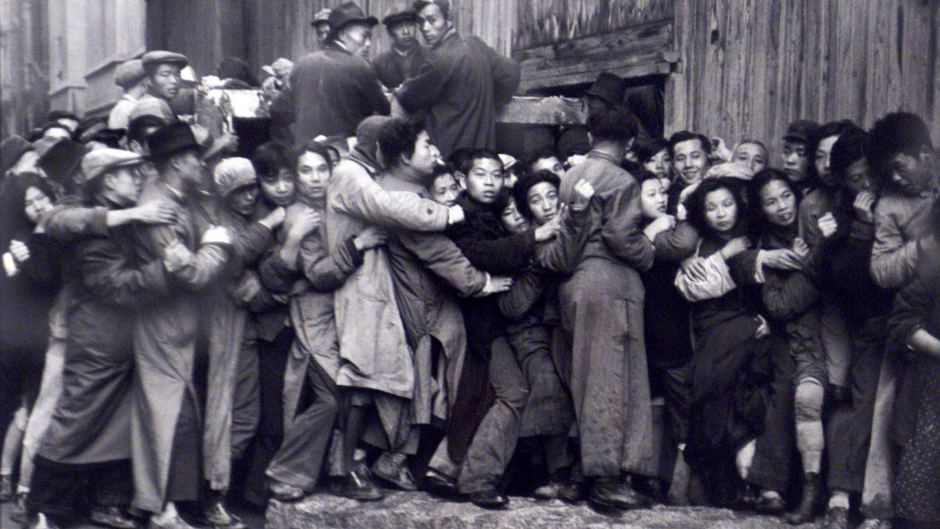 File under “reasons to buy gold”: A famous photograph by Henri Cartier-Bresson of a rather unruly queue in front of a bank in Shanghai in 1949 in the final days of Kuomintang rule. - Click to enlarge When it dawned on people that the communists couldn’t be stopped, they frantically tried exchange their government-issued paper money for gold. In preparation for its exodus to Taiwan, the Kuomintang regime had forced everyone to exchange their gold, silver and foreign exchange for a new paper currency, the Jingyuanquan in 1948 (“golden yuan”) – which it promptly inflated with gay abandon, belying its name. It then tried to combat rising prices with price controls – a strategy that has reliably failed since at least the times of the Roman Empire. It reversed the policy a few months later, as even its main supporters became thoroughly fed up. The people in the picture above were among those who had clearly waited too long to take advantage of this policy reversal. |
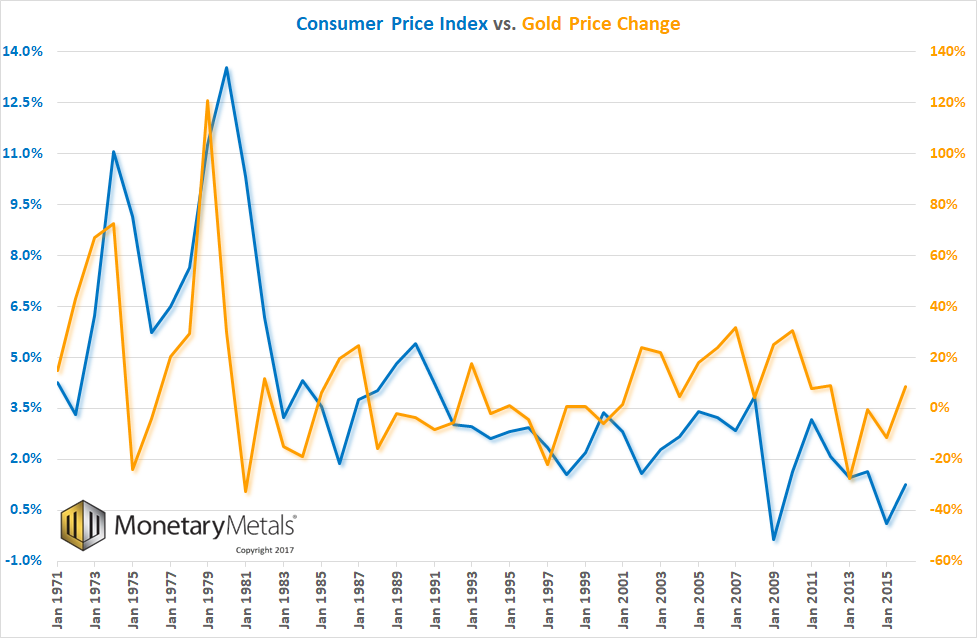
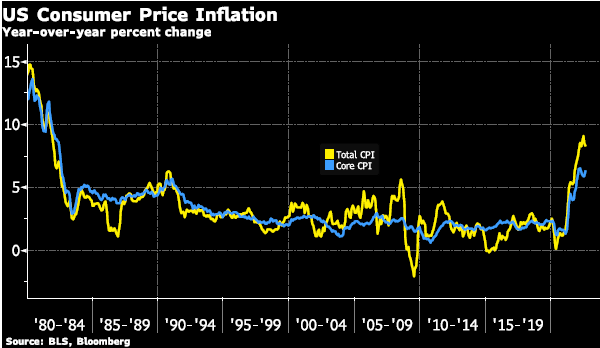
Consumer Price Index and Gold PriceBut first, we want to clarify something in light of our ongoing commentary about the struggles of the debtors and the lack of drivers for rising consumer prices. Just because farmers and restaurateurs are frantically producing and selling like mad, which results in soft prices, does not mean that people cannot begin to buy gold in earnest again. There is no causal relationship between consumer prices and the price of gold. At times, they can be highly correlated, but then the correlation ends. For example, did you know that the age of Miss America correlated with the number of murders by steam and hot things for 10 years? Let’s look at a chart. |
Consumer Price Index and Gold Price(see more posts on Gold prices, ) |
Gold and Silver PricesNB: we had to put the two numbers, change in consumer prices and change in gold price on two different axes. Though both are percentage changes, gold changes are so much larger that if plotted on the same axis, consumer prices look almost like a flat-line. You can see a tantalizing relationship between the two traces, at least for a time. At first (we began the graph in 1971 when President Nixon cut the dollar loose from gold), there is a striking correlation. But then there is a marked change post-1981, and if there is a correlation (we have not done the math), it looks much more tenuous. This is when Reagan and Volcker beat inflation (in the mainstream Narrative), or objectively when interest began to fall, when marginal productivity of debt began its uncanny correlation with interest (which we believe is causal), and when yield purchasing power begins to show a kind of hyperinflation. Offhand, we can think of two reasons to buy and own gold: participate in speculative mania and avoid default risk. Right now a speculative mania is occurring in crypto-currencies so that may (but not necessarily, beware correlation!) shunt such capital flows away from gold. As to default risk, there are signs of rising stress in high yield credit markets, but it’s early yet.
Fundamental DevelopmentsHere are the charts of the prices of gold and silver, and the gold-silver ratio. |
Gold and Silver Prices(see more posts on Gold and silver prices, Gold prices, silver prices, ) |
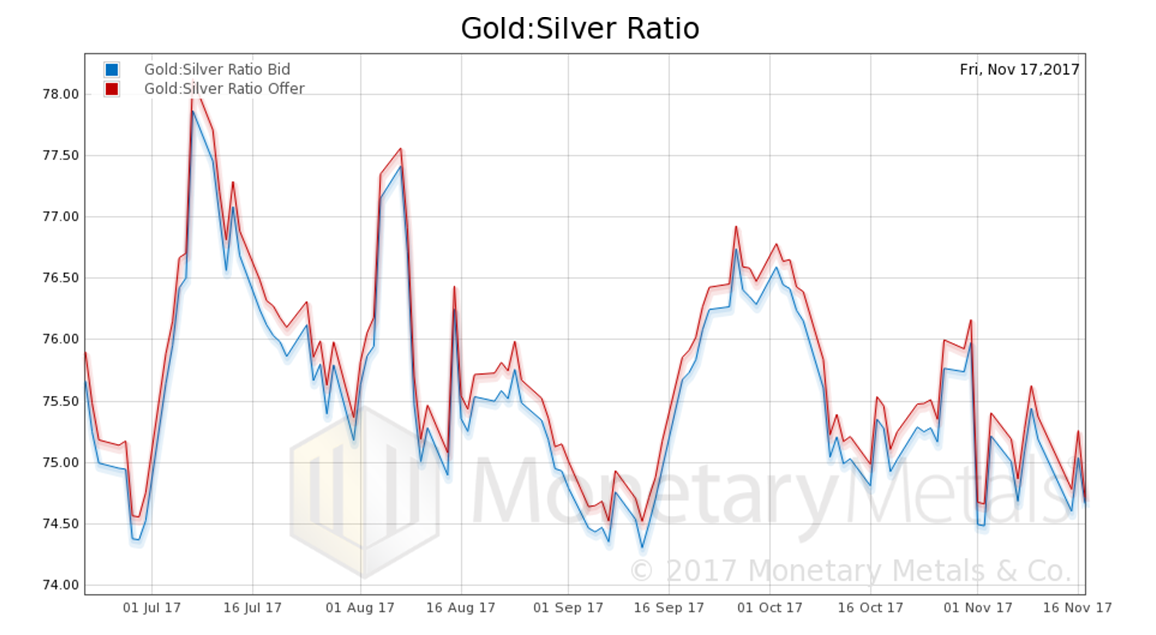
Gold:Silver RatioNext, this is a graph of the gold price measured in silver, otherwise known as the gold to silver ratio. The ratio fell. In this graph, we show both bid and offer prices for the gold-silver ratio. If you were to sell gold on the bid and buy silver at the ask, that is the lower bid price. Conversely, if you sold silver on the bid and bought gold at the offer, that is the higher offer price. |
Gold:Silver Ratio(see more posts on gold silver ratio, ) |
Gold Basis and Co-basis and the Dollar Price
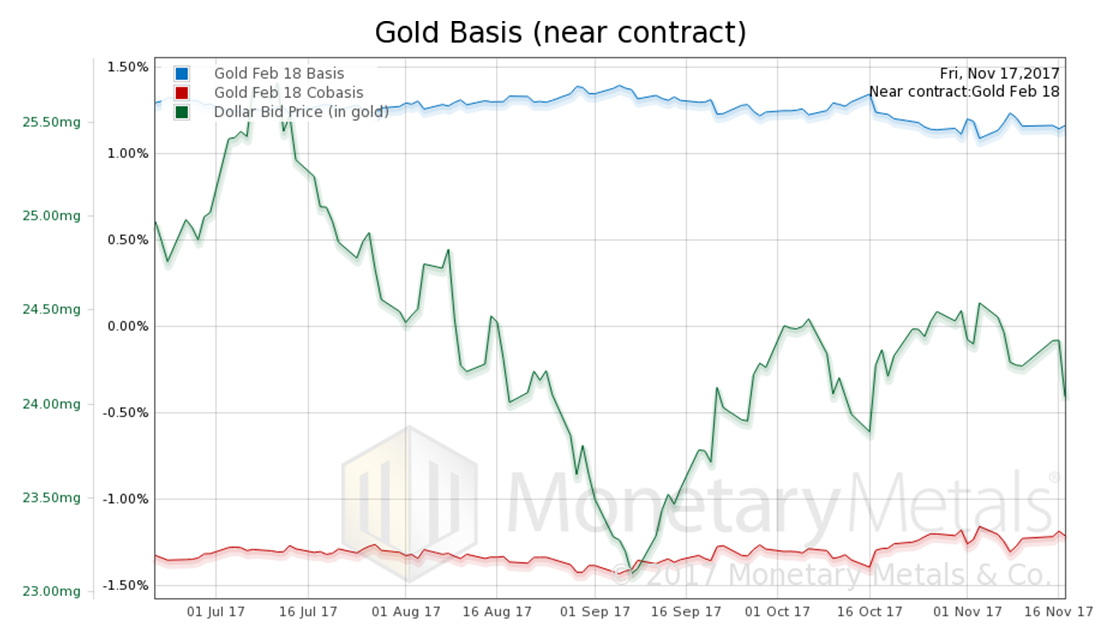
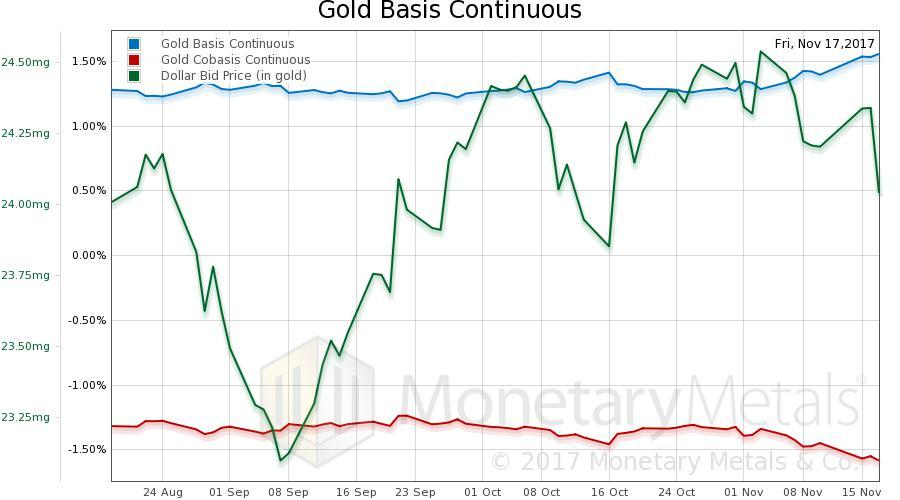
Here is the gold graph showing gold basis and co-basis with the price of the dollar in gold terms. |
Gold Basis and Co-basis and the Dollar Price(see more posts on dollar price, gold basis, Gold co-basis, ) |
Gold Basis and Co-basis and the Dollar PriceWe switched from the December to February contracts. The co-basis (our measure of scarcity) of the Feb contract does not show much. Let’s take a look at the continuous basis. |
Gold Basis and Co-basis and the Dollar Price(see more posts on dollar price, gold basis, Gold co-basis, ) |
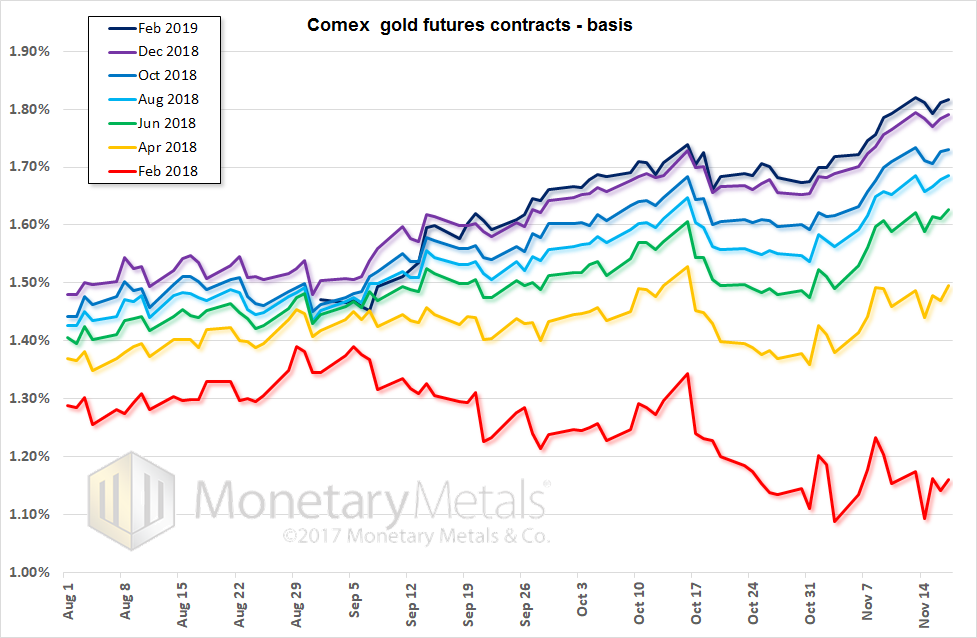
Comex Gold FuturesHere, we do see a tracking with the price of the dollar (inverse of the price of gold, in dollar terms). So what’s going on? Why does the near basis not show what the continuous basis does? Here is a graph showing the basis of all gold contracts. |
Comex Gold Futures |
Silver Basis and Co-basis and the Dollar PriceWe see a noticeable widening of the spread between near and far contracts. This is a steepening of the forward curve. At the end of August, there was less than 20bps difference between the Feb 2018 and Feb 2019 contracts. Now, there is 65bps, and 35bps between Apr 2018 and Feb 2019 contracts. When a price changes, it may or may not be significant (which is rather the meta-point of this Report). But one thing is for sure. When a spread changes, it is telling you something. What is this telling us? Since bottoming about a month ago, farther-out contracts have a rising basis. The Feb contract, by contrast, does not. We think it’s a bit early for the contract roll dynamics (and this is gold, not silver, which generally waits longer). The obvious answer is that speculators are bidding these contracts up. But in this case, it is not relative to spot but relative to the near contract. We are skeptical that speculators would suddenly switch their preference longer-dated contracts. We don’t know the answer but we suspect it may be the lifting of hedges either in the gold mining sector, or perhaps more likely, the bullion dealers. We know that retail product premiums are low, due to low retail demand. It seems plausible that dealers would reduce their hedge positions. Since hedging involves buying physical metal product and selling futures (which tends to compress the basis), lifting a hedge involves selling the product and buying the futures. Which tends to push the basis up, and not necessarily the near contract basis. The basis of whichever contracts were used for hedging. It could be longer contracts. We welcome reader input to explain this phenomenon. Now let’s look at silver. |
Silver Basis and Co-basis and the Dollar Price(see more posts on dollar price, silver basis, Silver co-basis, ) |
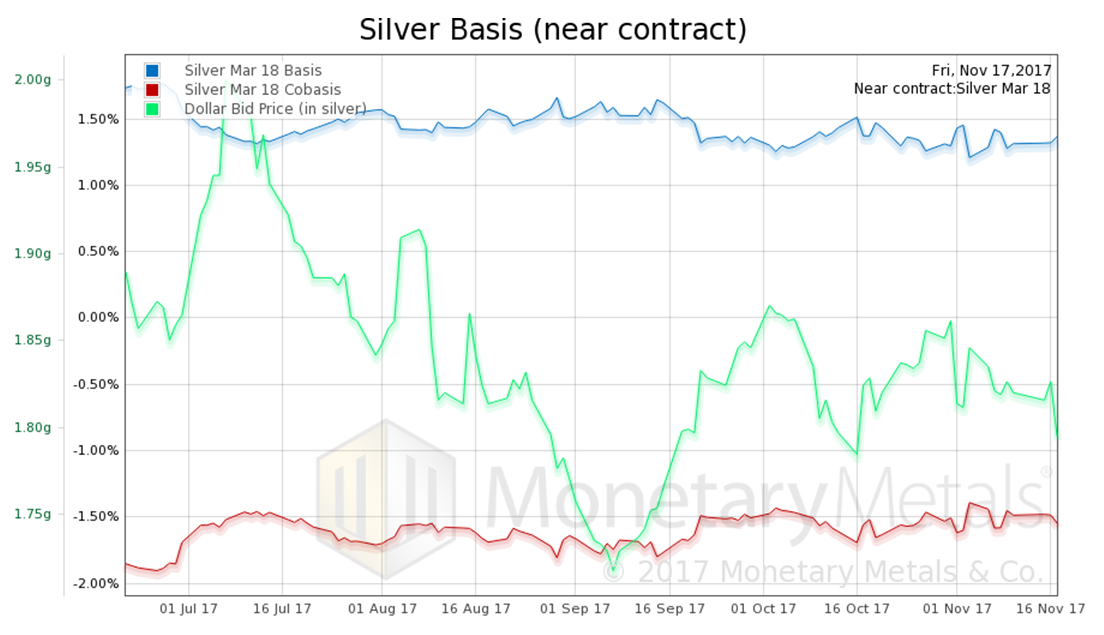
Comex Silver FuturesThe story is the same in silver. The graph below of all the silver contracts shows some widening of the spread between near and far contracts but not to the same magnitude as gold. |
Comex Silver Futures |
| In contrast to gold, the basis is flat across all the silver contracts with possibly some increase developing in the further out contracts from November onwards.
Now, on to Friday’s spike. Is it like last Friday’s crash, i.e. speculators repositioning? In Part II of this article, we show intraday graphs for both metals.
|
Tags: Chart Update,dollar price,Gold and silver prices,gold basis,Gold co-basis,Gold prices,gold silver ratio,newslettersent,Precious Metals,silver basis,Silver co-basis,silver prices


