Japanese Market About to Break OutThe Japanese stock market is quite unique: it would need to rally by approximately 80% to reach its former historical peak. What’s more, said peak was attained on the final trading day of 1989, more than 25 years ago. In short, Japanese stocks have been anything but a good investment in recent years. Conversely this means that the market has a lot of potential if it were to return to its former heights. It also means that the Japanese market hasn’t mirrored the excesses evident in many other stock markets. The chart below shows the Nikkei 225 since its late 1989 peak. |
Tokyo Nikkei Average, 1989 - 2018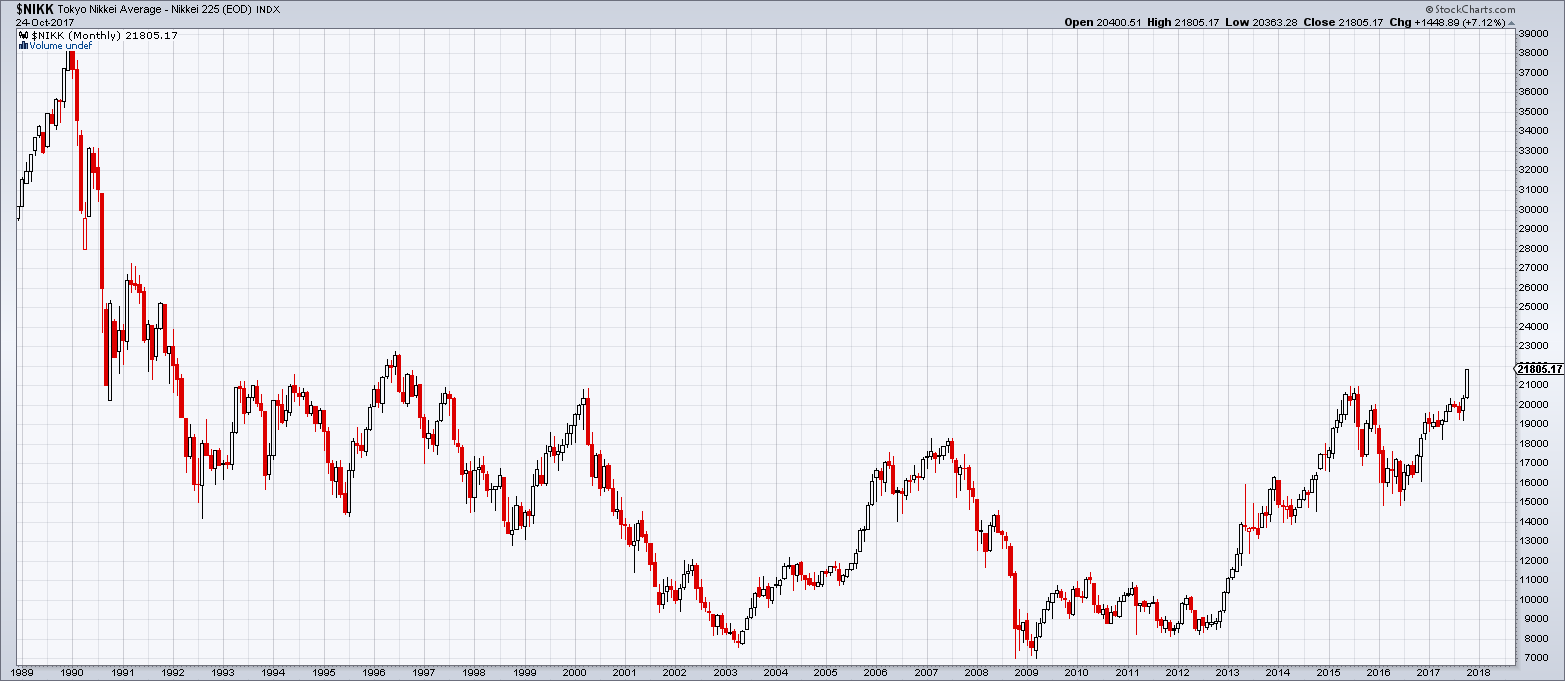 Nikkei 225, 1989 – 2017. Japanese stocks have entered a new uptrend. - Click to enlarge Japanese stocks are actually still quite cheap compared to current global standards. The advance looks quite good so far from a technical perspective, but unfortunately the same could be said of the 2003 to 2007 rally, which eventually fell prey to the bursting of the mortgage credit bubble in the US. While Japan’s market decoupled from foreign markets in the 1990s and remained mired in a secular bear market, it has shown no ability to decouple in the other direction since the 1970s (in the global bear market decade of the 1970s, it outperformed the DJIA roughly by a factor of 7.5). Since the BoJ is currently the biggest major currency molester in the world, a decoupling of the Japanese market in the event of a bear market taking hold elsewhere can probably not be ruled out – but we would expect that the market would at least be dragged down initially as well. This caveat has to be kept in mind when contemplating the (otherwise powerful) seasonal tendencies of the Nikkei discussed below. |
Seasonal Strength in Japan Lasts Until Early MayIn addition to this, the Japanese market displays a period of pronounced seasonal strength until early May. The seasonal chart below depicts the typical pattern of the Nikkei 225 in the course of a year, calculated by averaging the returns of the past 47 years. The horizontal axis shows the time of the year, the vertical axis the seasonal performance of the index. Nikkei 225, seasonal pattern based on 47 years of data. Japanese stocks typically rise until early May. As can be seen, the Nikkei typically rallies from late October until early May of the next year. The interesting seasonal period is highlighted in blue on the chart. It begins on October 26 and ends on May 6. The average return generated by the Nikkei 225 in this time period over the past 47 years was 9.18 percent. This amounts to an impressive annualized gain of 18.18 percent.
Keep in mind that numerous bear market years are included in the statistic (the details can be seen further below). If Japan had experienced an extended bull market similar to other major global stock markets, one would expect to see even better performance figures.
|
Nikkei 225, Jan - Dec 1970 - 2017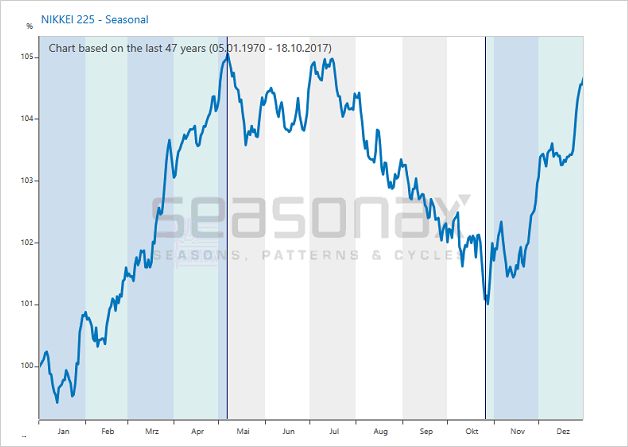 - Click to enlarge |
Gains of up to 58.74 Percent in the NikkeiDespite the post 1989 bear market, investors in Japanese stocks enjoyed positive returns in the time period between October 26 and May 6 in 36 of 47 years. The bar chart below shows the return the Nikkei delivered in this time period in every single year since 1970. Red bars show years in which the market lost ground, green bars indicate gains. Positive returns clearly predominate. The strongest seasonal pattern return was delivered in 2012 and amounted to a stunning 58.74 percent. Evidently, the upcoming strong seasonal period in the Japanese stock market could potentially prove highly lucrative – the Japanese stock market may be on the cusp of a large seasonal rally.
|
Nikkei 225, Oct 1970 - May 2017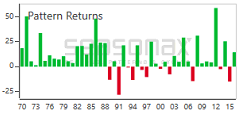 Nikkei 225, percentage return generated between Oct. 26 and May 6 in every year since 1970 - Click to enlarge |
Examine the Annual Seasonality of your Favorite Instruments on Your Own
With the Seasonax app you can retrieve seasonal charts and the associated statistics in seconds. Simply call up Seasonax on your Bloomberg Professional Terminal by typing in “APPS SEASON” or call it up via the App Studio in the menu of Thomson-Reuters Eikon. The app allows you to determine the optimal points in time for buying or selling your favorite financial instruments on your own. Readers who have no access to Bloomberg or Reuters systems can check out a collection of calendar-accurate free seasonal charts at www.seasonalcharts.com.
Full story here Are you the author?Tags: newslettersent,The Stock Market