Keith Weiner
My articles My offerMy siteAbout meMy videosMy books
Follow on:LinkedINTwitterSeeking AlphaFacebookAmazonGoogle +

Left: the first IKEA store located in Älmhult in Sweden, near the residence of the company’s founder (nowadays the store is a museum); right: a Task Rabbit car. - Click to enlarge
Amassing Unproductive Debt
Last week, we discussed the marginal productivity of debt. This is how much each newly-borrowed dollar adds to GDP. And ever since the interest rate began its falling trend in 1981, marginal productivity of debt has tightly correlated with interest. The lower the interest rate, the less productive additional borrowing has in fact become.
Given the valuations at which TaskRabbit was able to raise funds recently, it is a good bet IKEA paid a small fortune to take it over (waiting for the QE-induced bubble to burst may have been cheaper).
Let’s look at a recent event: the Ikea acquisition of TaskRabbit. You might wonder, why does a home goods company need to own a freelance labor company? Superficially, it seems to makes sense. Ikea products notoriously come in flat packs, but consumers don’t want to fuss with all the little parts. They just want finished furniture. Ikea has been using TaskRabbit to hire people to assemble it in their homes.
Isn’t this like that caricature of the billionaire who buys, say, the Planters Peanut company because he likes to eat salted nuts? Ikea could be a customer of TaskRabbit, hiring its temporary workers as needed, without owning the company. In fact, it had been doing that for years.
The acquisition price was not disclosed, however, we can guess that it was high. TaskRabbit was a Silicon Valley darling with a bright future. Its value proposition is right for this economy. It had raised $50 million, presumably at rich valuation multiples.
How much would Ikea be willing to pay? We don’t know how many dollars TaskRabbit was earning, so we will have to pass on total price. However, we can ask how much Ikea would be willing to pay for each dollar of earnings. There are two metrics to help answer this question.
One, Ikea can compare to the price that its own investors are willing to pay for a dollar of Ikea earnings. If it can buy a dollar of earnings via TaskRabbit for less than the market pays for a dollar of Ikea earnings, then it’s a good deal. Ikea is not publicly traded (but we suspect management has an accurate internal estimate of enterprise value).
Two, Ikea can compare the return on its investment to the cost of borrowing. If it expects to earn 5% on its investment for example, but borrows at 3%, then it’s a good deal.
The price to earnings of a large company, and its cost of credit, are both related to the prevailing rate of interest. As interest falls, price to earnings rises and cost of credit falls. So a falling interest rate, all else being equal, creates the opportunity for such acquisitions.
This fuels a process of capital destruction that we have written about extensively (see Keith’s series on Yield Purchasing Power). With Ikea we don’t know the company’s debt or cost of borrowing. But typically, acquisitions are funded by borrowing. The debt of the acquirer replaces the equity of management and investors of the acquired. Total debt goes up, but production does not increase.
And the exquisite madness of this is that it makes sense! By every principle of rational business management, these deals should be done. If you can borrow at 3%, then you can pay perhaps up to 20 or 25 times earnings to make acquisitions. If you can borrow at 1%, then you may pay up to around 50 times earnings, or a bit more.
This process, of course, makes billionaires out of the founders of many a start-up and makes the venture capital firms and their investors a lot, too. The source of their profits is the debt, borrowed by the acquirer. They may spend their profit and consume it.
The more the rate of interest falls, the more fuel is added to accelerate this consumption process.
Giving in to Temptation
We don’t want to drill any deeper into this here. Instead, let’s move on to address the question we left from last week: why is the marginal productivity of debt after 2010 at a higher level than before the crisis, despite interest rates that continued their inexorable collapse?
In the Theory of Interest and Prices Part I, I state:
“These processes and forces [that lead to the formation of the bid and ask prices of credit] are nonlinear. They are also not static, not scalar, not stateless, and not contiguous.”
The question last week was a bit unfair, in that these five ideas were embedded in how it was framed. We showed a graph showing falling interest and falling marginal productivity of debt. And asked why the discontinuity in the correlation post-2010?
We think the key idea that explains the post-2010 situation is: people are stateful. What does this mean? It means they have internal state. Their behavior is not a simple function of quantity of money or interest rates.
For example, they have balance sheets. A business with low debt to equity has plenty of capacity to borrow to buy more assets. However, we know that in 2010, asset values were way down compared to 2007, but of course the debt persists. Therefore, the capacity to borrow was reduced.
Stateful also refers to the fact that people have memory. What could people possibly have been remembering in 2010? It’s a real head-scratcher…
Sarcasm aside, the major corporations in 2010 or 2012 had less appetite to borrow to buy the TaskRabbits of the day. No matter that the cost of credit was lower than it had been pre-crisis, their assessment of the risk was much higher.
Deals like the Ikea acquisition of TaskRabbit are a sign that the temptation to buy earnings with dirt cheap credit once again outweighs the fear of a liquidity crisis or a crash of asset prices. Besides, if your company is the only one not partaking in the Fed’s largesse, and all your competitors are, then you will certainly lose out.
Has the Trend in Interest Rates Reversed?We are aware that many believe that interest rates have reversed course. That they will go back to normal. We wonder where, on a line that has been falling for 36 years, is the normal point? Yes, rates have ticked up a bit recently. So let’s just show interest rates for the period 1981-present to put this perspective. There is no sign of a major trend change just yet. That would change if market-based price inflation expectations of were to increase or if doubts about the Treasury’s creditworthiness were to arise. Both appear highly unlikely at the moment, but as a caveat to this one should perhaps keep in mind that such things always appear to be highly unlikely at turning points. The future is ultimately unknowable, but the fact remains that at this juncture no major trend change is in evidence. |
US 10 Year Treasury Yield, Jan 1981 - 2017(see more posts on U.S. Treasuries, )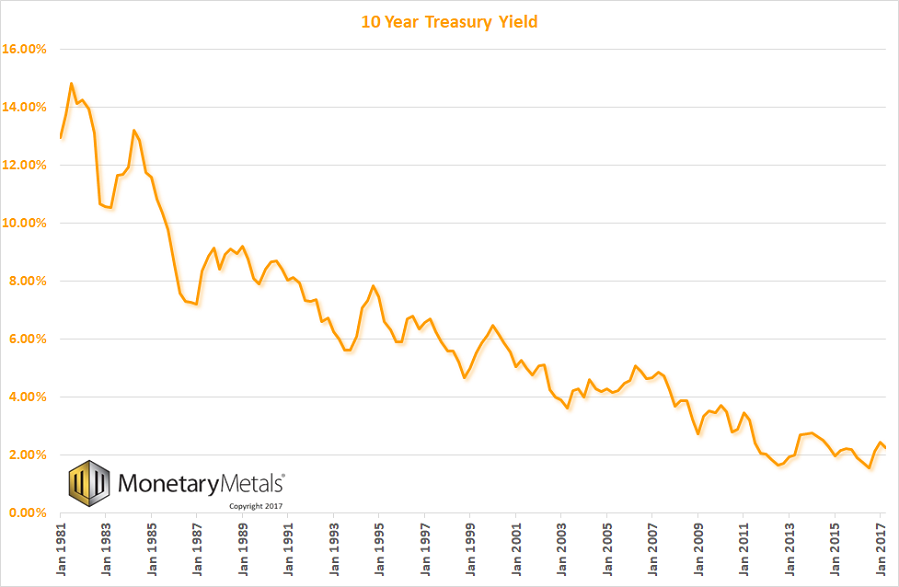 10-year treasury yield 1981 – today. - Click to enlarge |
| Do you see the alarm bells, the red flags, the warning signs that this trend has reversed and interest is about to begin heading up in a serious way? Do you see the clear point where the bottom was put in, and the reversal occurred? We don’t.
Nor does the junk bond market. Here is a graph of the spread between junk and Treasury bonds. As an aside to this: the spread of euro are junk bonds over treasuries is currently zero. Even in today’s central bank-created financial theater this one stands out. It is interesting that US high yield spreads are not yet at or below the 2007 trough – this could turn out to be a meaningful divergence. As a brief remark to what follows below: social time preference, i.e., the originary interest rate, is not measurable. We are not sure how one is supposed to know what it is, apart from guessing. Moreover, gross market rates not only reflect risk premiums in addition to the natural rate, but also a price (“inflation”) premium. The latter can conceivably become negative (in fact, we know that this occasionally happens from observing market-based expectations of future CPI rates). |
US BofA Merrill Lynch High Yield Option, 2007 - 2017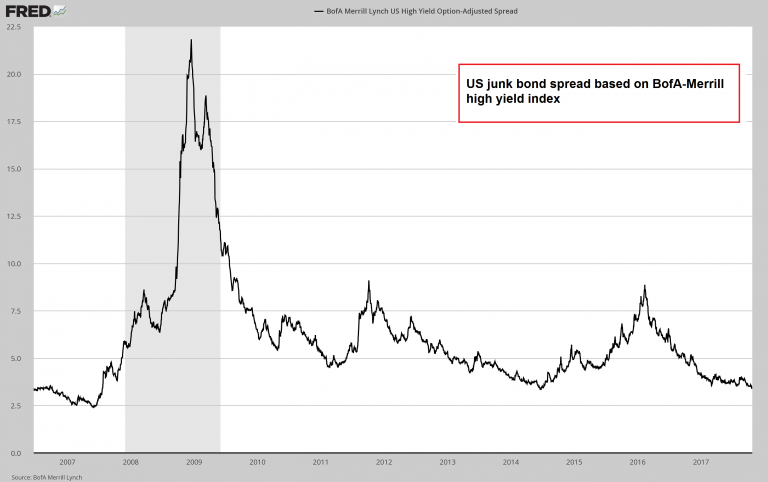 US junk bond spreads over treasuries based on the BofA Merrill Lynch US high yield Master II Index. - Click to enlarge |
We started the chart in 2007 to show several important features: the all-time low, the incredible spike during the crisis, the mini spikes in 2011 and 2016, and the present trend. We are currently near the all-time low (3.48% today compared to 2.41% in June 2007).
This graph really shows a measure of risk perception. It is germane to our discussion of rates, because issuers of junk bonds are already on shaky ground. If their cost rises (as in rising interest rates), they are likely to default. In a true rising interest environment, junk issuers are headed to default en masse. Right now, the market is predicting the opposite result.
Maginot Line
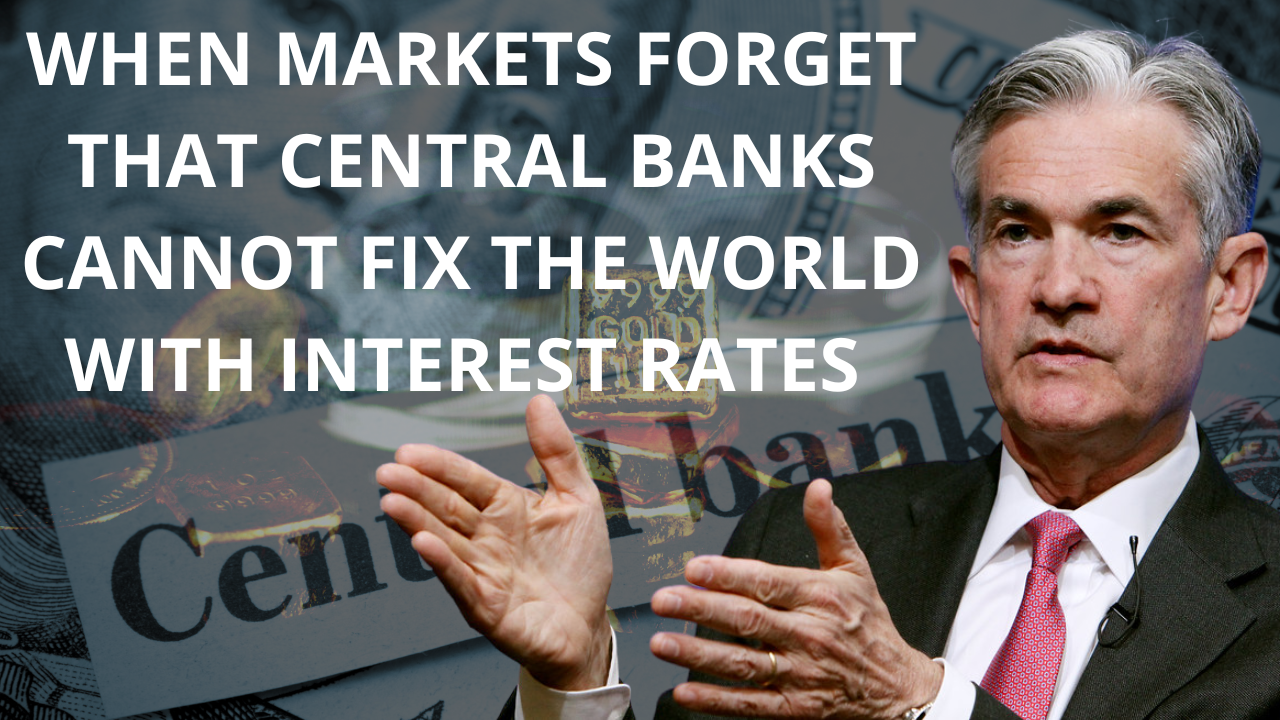
We, of course, have a reason to think interest rates are not in a rising trend but a falling trend. Central banks exist to enable more government (and crony) borrowing. They seek to push down the interest rate. However, the market is bigger than even the biggest central bank.
In my theory of interest and prices, I ask what happens if the interest rate is pushed down below marginal time preference. Governments can pass legislation, but they cannot repeal economic or natural law (just ask King Canute). They can try to push interest down, but they cannot control how people will react.
Normally, interest is greater than time preference. That’s because people don’t lend, if they don’t get the compensation they want. However, with irredeemable paper currency, central banks can push interest rates below time preference. They can cause this spread to invert, with impunity. Or so they believe (if they are even aware of the Austrian concept of marginal time preference at all).
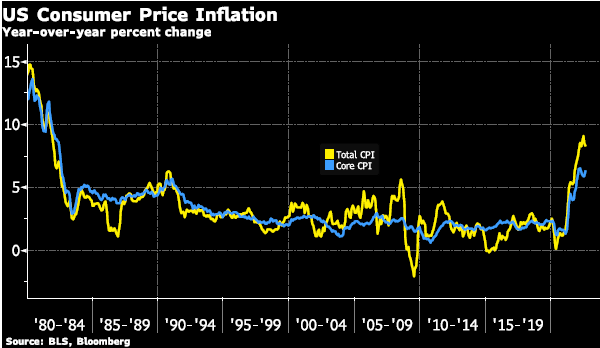
This inversion causes the rising cycle of interest and prices. The symptoms should be quickly recognizable to anyone familiar with the gold bug argument: the quantity of money is increasing, and prices are rising commensurately. Interest rates rise to compensate lenders for declining purchasing power.
We dub this theory the Maginot Monetary Theory. The Maginot Line was an attempt to fight WWII based on an understanding of WWI. And the Maginot Monetary Theory is an attempt to deal with today’s falling cycle based on a (superficial) understanding of the rising cycle of 1947 through 1981.
The cause of that rising cycle was interest below time preference. Interest, of course, was moving up. That might almost have set things right. Unfortunately, time preference was rising also. This cycle kept iterating until 1981, when interest spiked and finally got above time preference.
Since then, interest has certainly remained above time preference. That spread has been normalized. However, interest is also above marginal productivity. Not the marginal productivity of debt that we showed in the graph last week, but the rate of return on capital of the marginal business. So long as this spread is inverted, interest falls (and this puts downward pressure on prices).
One informal proof of this is to watch the marginal use of debt go into nonproductive uses, such as acquisitions of businesses that are only superficially synergistic to the corporation. When interest rates pause, borrowing becomes more anemic and GDP slows down, until the next shot of juice obtained by the next drop in interest.
In order for interest rates to go into a durable rising trend, the marginal productivity of capital would have to rise above interest and then marginal time preference would have to rise above interest also. With profit margins under continued pressure, and with debt levels rising everywhere, we don’t see how either of these conditions could be met.
Advantage of the Gold Standard
The main advantage of the gold standard is not static prices, which is neither possible nor desirable. It is that the rate of interest cannot be manipulated like what has been done since 1981. If time preference is violated, savers can just withdraw their gold and put it under the mattress. The preference of the savers has real teeth, as it ought to.
In the gold standard, the savers are empowered as the stewards of capital. They do not allow it to be consumed as it is today. This is why Monetary Metals is working to reestablish the market for gold interest.
We have one postscript to add to our long series on the unsoundness of bitcoin and the money-out-of-thin-air madness known as forking. A new bitcoin fork is planned. Bitcoin gold combines all the virtues brand recognition of gold with all the stability speculative upside of bitcoin.
Full story here Are you the author?Tags: Chart Update,newslettersent,On Economy,Precious Metals,U.S. Treasuries