Jeffrey P. Snider
My articles My offerMy siteAbout meMy videosMy books
Follow on:LinkedINTwitterSeeking Alpha
| Retail sales were added in September 2017 due to the hurricanes in Texas and Florida (and the other states less directly impacted). On a monthly, seasonally-adjusted basis, retail sales were up a sharp 1.7% from August.
|
US Retail Sales, Jun 2011 - Aug 2017(see more posts on U.S. Retail Sales, )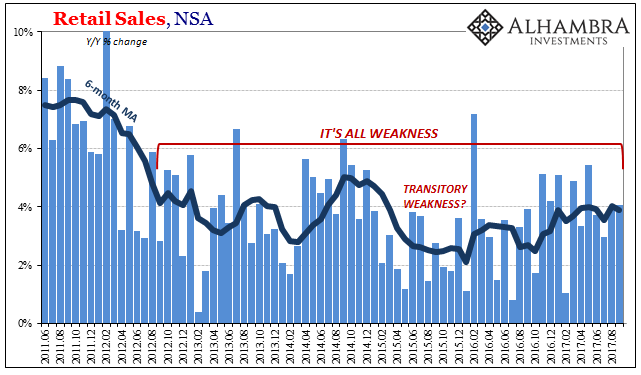 - Click to enlarge |
| The vast majority of the gain, however, was in the shock jump in gasoline prices. Retail sales at gasoline stations rose nearly 6% month-over-month, so excluding those sales retail sales elsewhere gained a far more modest 0.6%. |
US Retail Sales, Jan 1993 - Jul 2017(see more posts on U.S. Retail Sales, )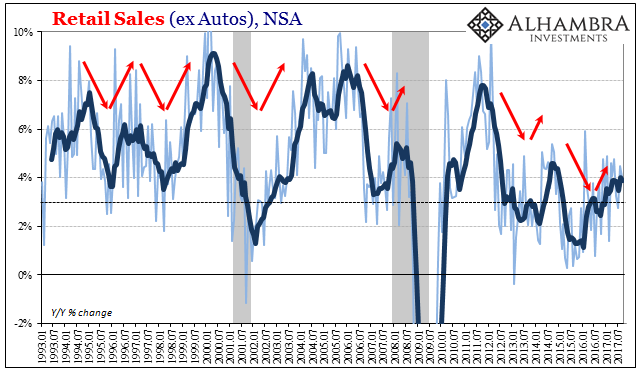 - Click to enlarge |
| Despite all that, on a yearly basis there wasn’t much effect at all. Unadjusted retail sales in September were just 4.05% more than in September 2016. That compares to a 3.89% rate of growth (revised) in August. |
US Retail Sales Trade, Jan 1993 - Jul 2017(see more posts on U.S. Retail Sales, )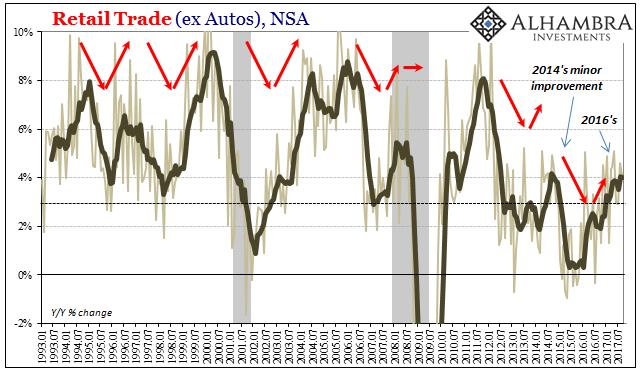 - Click to enlarge |
| It’s the same story repeating; since the 2012 slowdown, a period long enough to be labeled structural, there is a very clear “speed limit” of sorts where even these larger monthly variations don’t do anything to change that. |
US Retail Sales, Jan 1993 - Jul 2017(see more posts on U.S. Retail Sales, )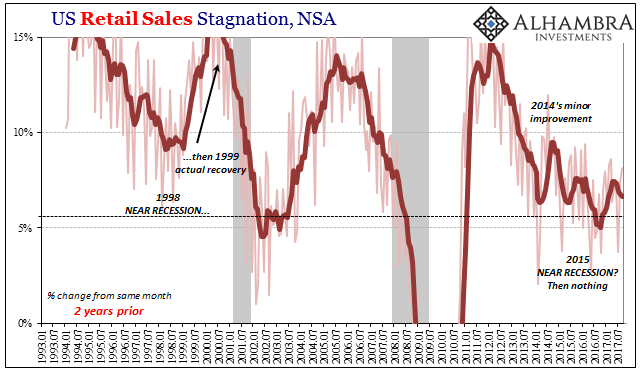 - Click to enlarge |
| Six percent growth used to be the level for concern, the lower range of average. Only three times since May 2012 have retail sales been above that level, just slightly so in each case. Of the remaining 61 months, the rate of growth has tended to be around or less than 3%, which is consistent with past recessions (the average rate in those 64 months is just 3.5%).
Because of that, 4% is practically indistinguishable from 3% especially where it is consistently that way – as it has been throughout this year. The 6-month average for retail sales is just less than 4%, not even matching the average gain in 2014 (a year most comparable to the current circumstance). Excluding gasoline, retail sales year-over-year (NSA) rose by just 3.5%. |
US Retail Sales, Jan 1993 - Jul 2017(see more posts on U.S. Retail Sales, )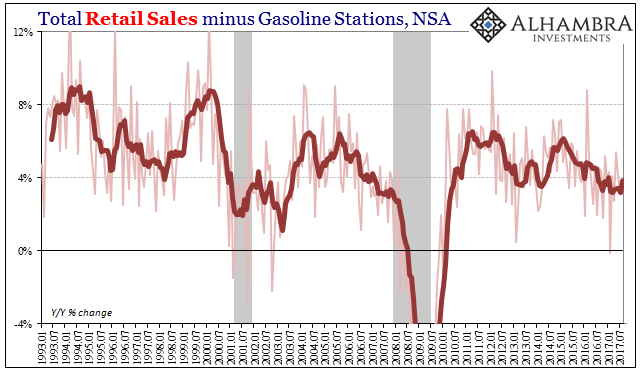 - Click to enlarge |
| There are several reasons to believe that underlying consumer spending is in much worse shape than it may otherwise appear, particularly in the monthly, seasonally-adjusted view. One of the more fascinating and perhaps important marginal shifts over the past almost year and a half has been the sudden appreciation for online shopping (or, more likely, the prices offered via these non-store outlets).
Those sales came at the direct expense of the traditional so-called brick and mortar stores. The change in preference was not an isolated case, certainly one that has been building more slowly over time and affecting the whole retail industry. However, the timing and degree suggested something else likely related to the macro environment. |
US Personal Savings Rate, Dec 2013 - Aug 2017(see more posts on U.S. Savings Rate, )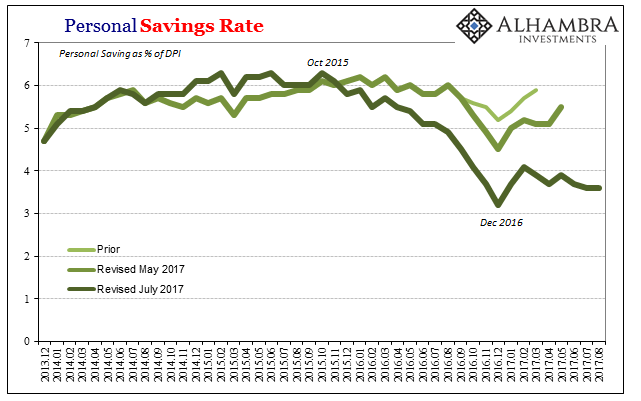 - Click to enlarge |
| I think the Personal Savings Rate especially its behavior during this transition further demonstrates that consumers turning to their computers instead of their feet were doing so, at the margins, more so out of necessity. The sharp drop in the second half of last year was a function of lower income growth as a result of the economic effects of the “rising dollar”, a significantly weaker labor market, leaving workers to either cut back in spending or spend more of their savings. |
US Retail Sales, Jan 1993 - Jul 2017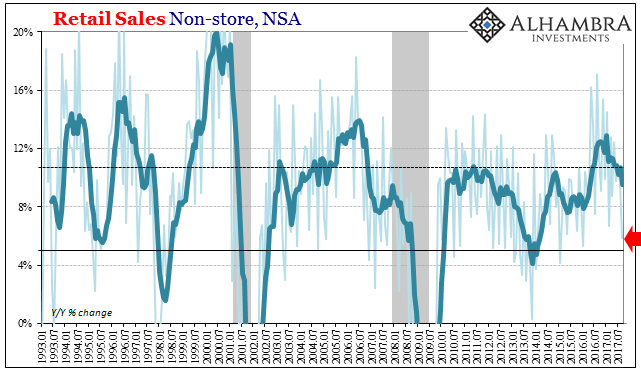 - Click to enlarge |
| They did, of course, a little of both but more so the latter than the former. But in September 2017, retail sales at non-store outlets grew by just 5.8% year-over-year (NSA). That’s the lowest rate since January 2016 and the worst of the near-recession and global turmoil. At the same time, also in September 2017, retail sales at general merchandise stores rose by nearly 5%, the best growth rate since April 2014.
It wasn’t department stores that saw any of those gains, the traditional brick and mortar competition to non-store, online behavior. Retail sales here were down on the monthly, and even on a yearly, basis. Instead, the pickup in general merchandise was almost surely related to storm spending – in advance of them as well as in their aftermath. As such, it appears as if that rather intense burst of what would be non-discretionary spending (general merch, but not department stores) took a sizable chunk out of aggregate discretionary spending (non-store). Considering that the storms didn’t affect the whole country, really geographically limited, it’s a possibly significant story. Retail sales do vary often widely on a monthly basis, so it might be that online sales are suggesting no more than regular variation. This is, though, their first stumble in the twenty months or so since the trend changed. |
US Retail Sales, Jan 1993 - Jul 2017(see more posts on U.S. Retail Sales, )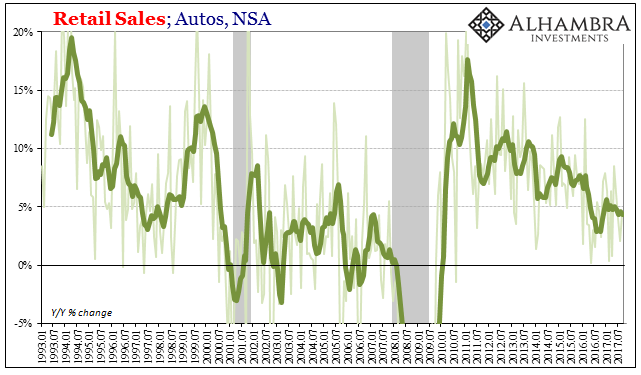 - Click to enlarge |
| The other sector greatly affected by the hurricanes was autos. Retail sales of motor vehicles and parts were up 3.6% (SA) in September from August, a rather big jump that is suggested in other data. Year-over-year (NSA), like overall retail sales, sales of vehicles are only 4.5% higher. Even with a short-term boost, it’s not much of one, turning what might have been really bad sales growth into just plain concerning. |
US Retail Sales, Jan 2014 - 2017(see more posts on U.S. Retail Sales, )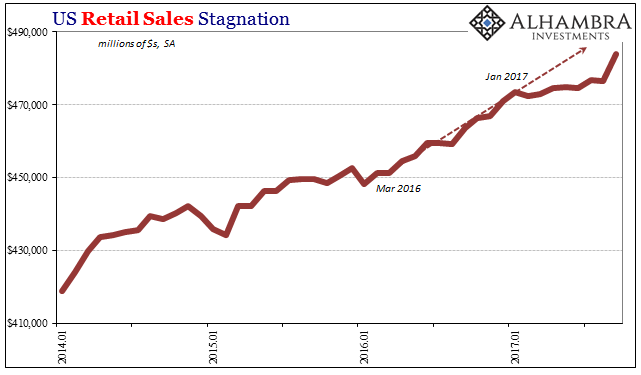 - Click to enlarge |
| As has been so often the case throughout the past five and a half years since the 2012 slowdown, the headline SA figure appears to be great. It is, in isolation, a big jump. But like the last big jump (March 2015) it doesn’t amount to much because the headline growth for both was in fact isolated. The details underlying are more important and more importantly in the same condition and of the same indication (clear lack of momentum and positive cyclicals).
The difference between now and 2014 is not just lower average spending growth in the current economy, but also that significantly lower personal savings rate that has so far helped keep that comparison at least somewhat close. What happens if consumers decide that they don’t want to be so close to the edge? |
US Retail Sales, Jan 1992 - 2017(see more posts on U.S. Retail Sales, ) - Click to enlarge |
Tags: Auto Sales,consumer spending,currencies,economy,Federal Reserve/Monetary Policy,gasoline sales,harvey,incomes,irma,Markets,newslettersent,personal savings rate,Retail sales,U.S. Retail Sales,U.S. Savings Rate