Jeffrey P. Snider
My articles My offerMy siteAbout meMy videosMy books
Follow on:LinkedINTwitterSeeking Alpha
| Sometimes economics can be complicated, such as why the labor market has slowed in such lingering fashion since early 2015. Sometimes economics can be easy, such as why there is so much less to the economy this year than thought. The easy part relates to the hard part. The labor market slowed and so did national income. Though so much of official focus is on debt supplementation, it’s always, always about income. |
US Real Personal Income, Dec 2013 - Aug 2017(see more posts on U.S. Personal Income, )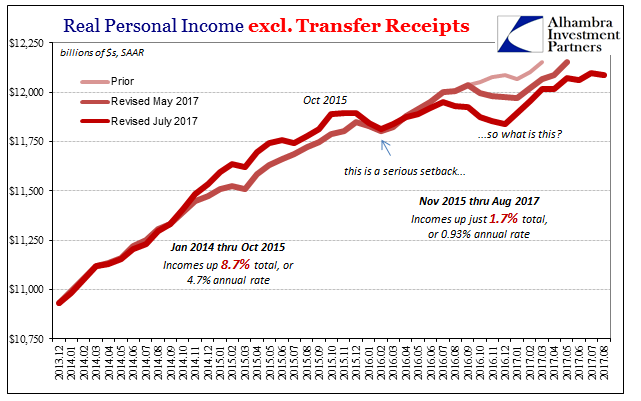 - Click to enlarge |
| Incomes are, like everything else, still growing but also like everything else it is not growth. In the 22 months starting with November 2015, Real Personal Income excluding Transfer Receipts is up 1.7% total, not per year. That’s an annual rate of less than 1%, qualifying for only the negative descriptions even though there’s that plus sign. In the 22 months prior ending in October 2015, Real Personal Income excluding Transfer Receipts was up nearly 9%, or an almost 5% at annual rate. |
US Real Personal Income, Jan 2014 - Aug 2017(see more posts on U.S. Personal Income, )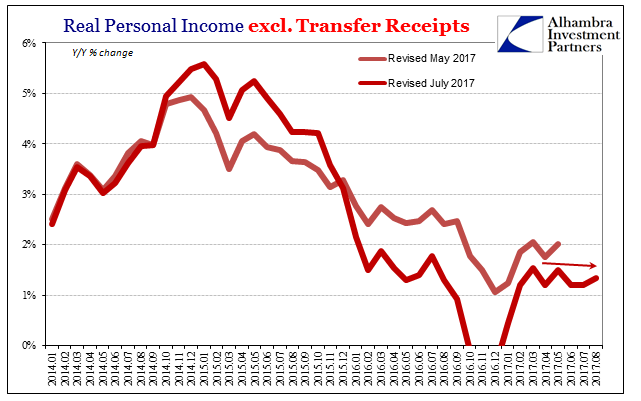 - Click to enlarge |
| That’s an enormous difference, and though the economy is on an upswing since the last near recession in early 2016 you can see why it really doesn’t seem that way (or why the bond market and eurodollar futures don’t really treat it is as much of one). I’m not sure it goes so far as UINO (Upturn In Name Only) but it is perilously close – and getting closer by the month.
Starting out on that pathetic intermediate trajectory, in the short run it’s been even worse. In August 2017, everything was down, or nearly so. Even nominally incomes were barely positive month-over-month. It follows the same pattern for several months now, where advance is short and stunted, halted by alternative declines. |
US Real DPI, Jan 2010 - 2017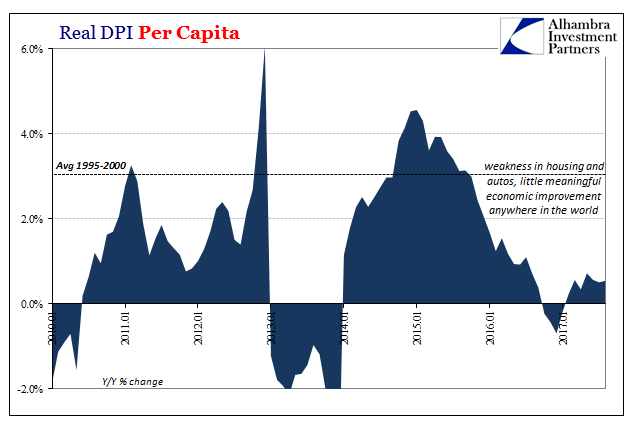 - Click to enlarge |
| At the other end of the time scale, the longer term, it’s the same problem. Income growth does happen, it is just never sustained for long enough to make a real difference. That burst of income growth in 2014 was unfortunately an island of positive amidst always some great concern (related to “dollars”) that ultimately leads to its end.
Though it was the supposedly the best jobs market in decades, and the BLS recorded heavy payroll gains all throughout that year, by the second half there was the oil crash and currency crises that though they might not have directly affected American consumers and the vast majority of businesses, they were still enough of an obvious concern to raise caution and therefore offset the island of income growth (again). Once negativity crept into real economic processes in lower sales and investment, there is now left no island at all. |
US Real DPI, Dec 2013 - Aug 2017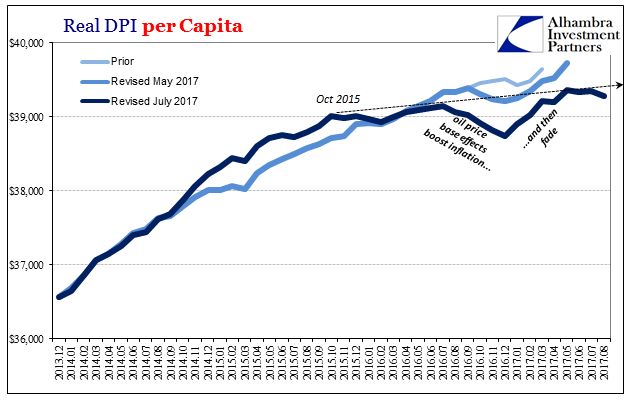 - Click to enlarge |
| The downturn in income growth, despite the unemployment rate, has been partially absorbed by consumers. Spending is off but not nearly as far as it would be if it had kept pace with income deceleration. |
US Savings Rate, Dec 2013 - Aug 2017(see more posts on U.S. Savings Rate, )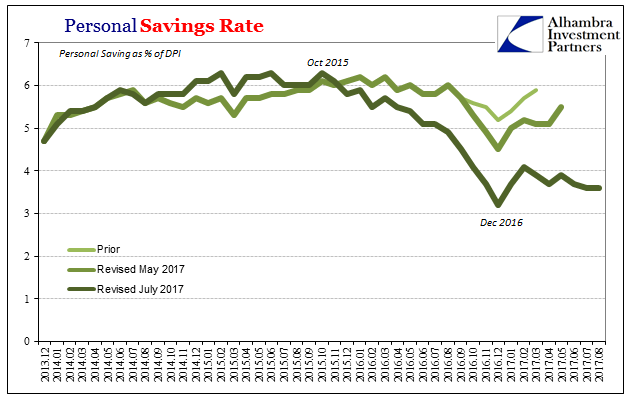 - Click to enlarge |
| The difference is the Personal Savings Rate, which indicated in the last half of last year this effect. |
US Savings Rate, Jan 2000 - 2017(see more posts on U.S. Savings Rate, )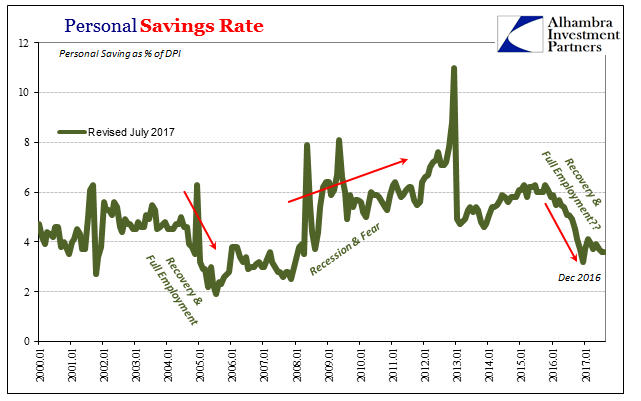 - Click to enlarge |
| If that is the one positive in the post-“rising dollar” environment, then it’s a very small one, and perhaps temporary at that. The issue is how long consumers can continue to spend so close to barely growing income. At some point, either wages and pay will have to surge and on a sustained basis (the FOMC case for inflation based on the unemployment rate) or spending will have to be adjusted (further downward) to better align with this lower trajectory for income. |
US Real Personal Consumption Expenditures, Jan 2014 - Jul 2017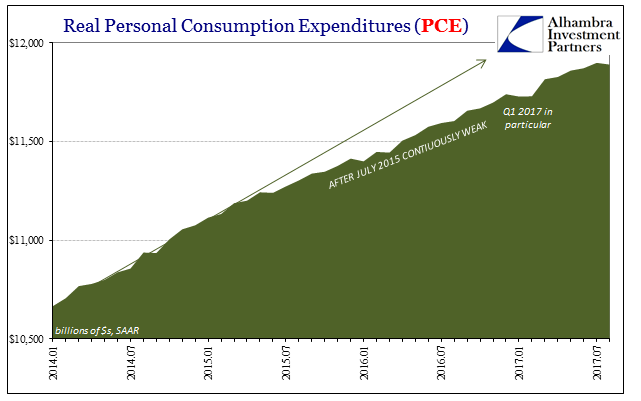 - Click to enlarge |
| That would be an even larger problem than it already is; Real Personal Consumption Expenditures, which include service sector activity, suggest broad economic conditions do follow the marginal changes that we find in the goods economy. As discussed yesterday with Total Business Sales, the positive numbers there don’t qualify for growth, either, especially the further along in 2017. |
US Total Business Sales, Jan 2009 - 2017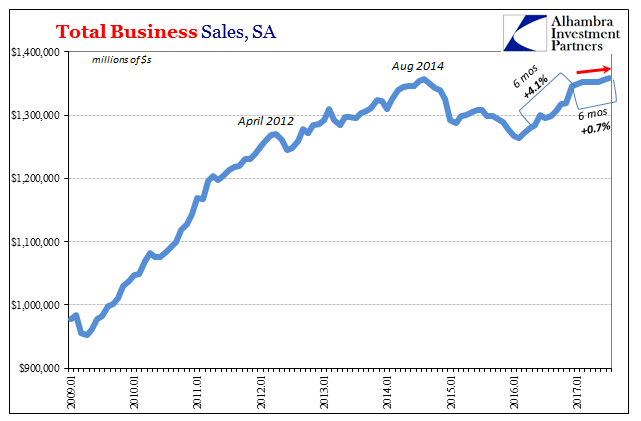 - Click to enlarge |
| The longer it goes this way the harder it will be to get out of this mess, too. The 15 or 16 million “missing” Americans add up in terms of Disposable Personal Income to about $5 trillion in likewise “missing income.” In other words, had the Great “Recession” been a recession, a temporary contraction that didn’t alter potential, National Income would have been about $19.4 trillion. The BEA instead figures for August 2017 a seasonally-adjusted annual rate of just $14.4 trillion. |
US Disposable Personal Income, Jan 1985 - 2017(see more posts on U.S. Personal Income, ) - Click to enlarge |
| These differences are simply too large to comprehend, which is why they don’t ever seem to factor in the mainstream analysis. It just doesn’t seem possible. That’s why the economy especially consumer spending is always describes as “strong” or “robust” when it never really seems that way. There are positive numbers everywhere, and yet people can sense that we are only further and further behind.
The $5 trillion in missing income doesn’t just belong, for a lack of a better word, to those 15 or 16 million possible laborers left outside the official labor force calculation. That disparity includes follow-up effects that in an actually robust labor market would matter a great deal; raises that people who are working don’t get because business revenues and more so cash flows can’t grow; opportunities for promotions that don’t happen for the same reasons; employees who stay at their current job because they are happy they have one instead of looking for the better one they may have otherwise sought if the economy was even reasonably growing instead of shrinking still in non-linear fashion. All that plus some proportion of the 16 million missing add up to that other $5 trillion and a very different world. In a lot of ways, we are all left behind to some degree of gradation. It is worst for those outside, but it affects a huge proportion inside, as well; too large of a proportion, which is the problem. |
US Real Personal Income, Jan 2010 - Jul 2017(see more posts on U.S. Personal Income, )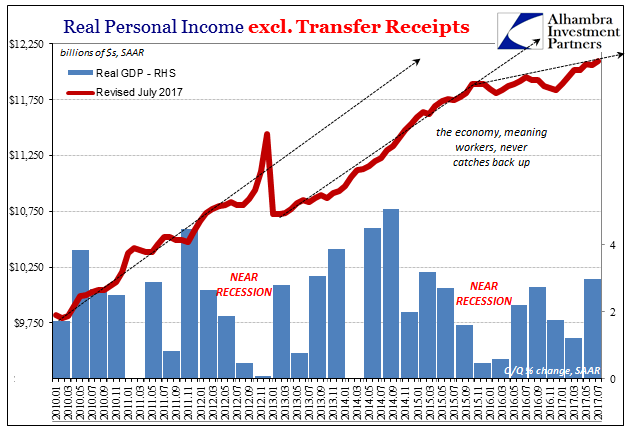 - Click to enlarge |
In macro terms, the more immediate concern is “now what?” We started out in the immediate aftermath of 2008-09 with some income advance, downshifted to less income after 2011, and now less still after the “rising dollar.” Consumer spending is exhausting all the savings margin, and inventory vulnerabilities remain (and in important places like the auto sector where imbalance is already causing more major adjustments in activity). There is more aligning toward downside risks than ever was in the upside category.
I’ve written before that the worst case scenario would not have been severe recession and contraction but instead repetition of this same ratchet effect over and over and over again; continuous near recessions followed by no recovery. What makes it the worst case is that nobody can see the problem because the alternate return of these positive numbers obscures the larger and ongoing subtraction, reduces needed urgency to propel first investigation before solution, and thus adds more time to eventual economic and social costs.
It’s 2017, the year just about three-quarters finished, and that’s exactly where we are.
Full story here Are you the author?Tags: consumer spending,currencies,disposable personal income,economy,Federal Reserve/Monetary Policy,Markets,newslettersent,PCE,personal consumption expenditures,real personal income excluding transfer receipts,U.S. Personal Income,U.S. Savings Rate