Jeffrey P. Snider
My articles My offerMy siteAbout meMy videosMy books
Follow on:LinkedINTwitterSeeking Alpha
| Industrial Production rose 1.6% year-over-year in September 2017. That’s up from 1.2% growth in August, both months perhaps affected to some degree by hurricanes. The lack of growth and momentum, however, clearly predated the storms. The seasonally-adjusted index for IP peaked in April 2017, and has been lower ever since. This pattern, the disappointment this year is one we see replicated nearly everywhere on both sides (supply as well as demand) of the global economic equation. |
US Industrial Production, Jan 1995 - Jul 2017(see more posts on U.S. Industrial Production, )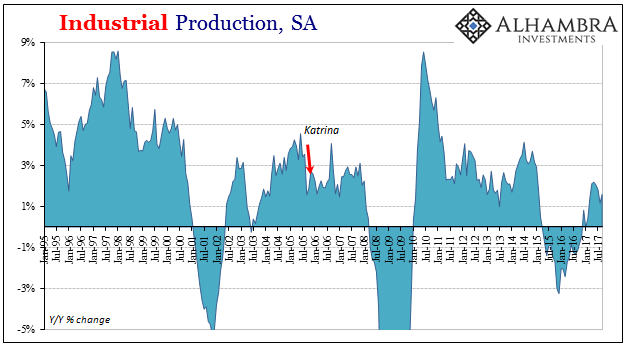 - Click to enlarge |
| To further emphasize the non-weather nature of recent weakness, the Federal Reserve revised lower estimates for both July and August. The initial index value produced a 2.4% gain for July, which was the highest since January 2015 and at the time at least moving in the right second derivative direction. |
US Industrial Production, Jan 2006 - Jul 2017(see more posts on U.S. Industrial Production, )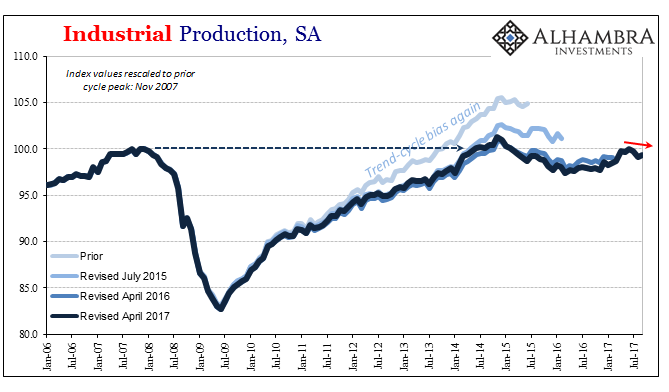 - Click to enlarge |
| It has been revised instead to just 1.8% growth, and merely in line with this recent trend. The rate for August was recalculated to 1.2% from 1.5%. |
US Industrial Production, Jan 2011 - Jul 2017(see more posts on U.S. Industrial Production, )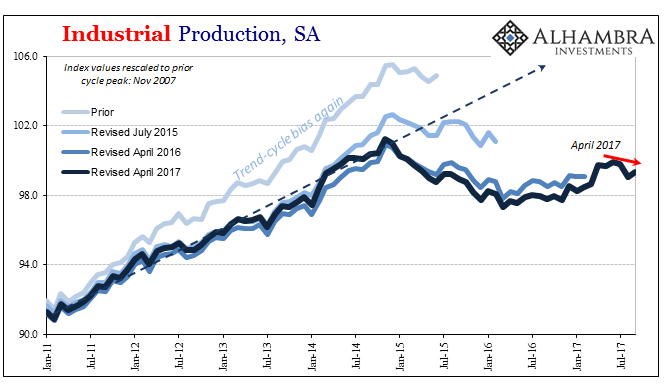 - Click to enlarge |
| Capacity utilization in both those months was reduced, too. The original figures suggested 76.9% utilization in July, which would have been the highest since April 2015 and still indicating a positive trend. Instead, the Fed now estimates the rate was 76.5% and no further growth, starting again what is now more than a few months in the wrong direction. |
US Capacity Utilization, Jan 2011 - Jul 2017(see more posts on U.S. Capacity Utilization, )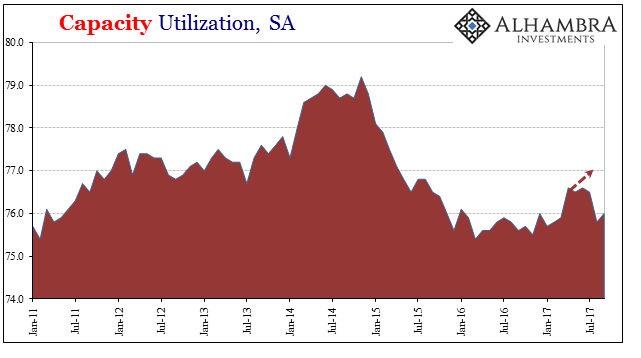 - Click to enlarge |
| This weakness is occurring despite the mining sector particularly for crude oil again contributing significantly on the growth side. After reaching a low point last September, growth in production here is now up sharply from that trough. The IP index suggests production levels for domestic crude are now 10% above that low point and still rising. |
US Industrial Production, Jan 2006 - Jul 2017(see more posts on U.S. Industrial Production, )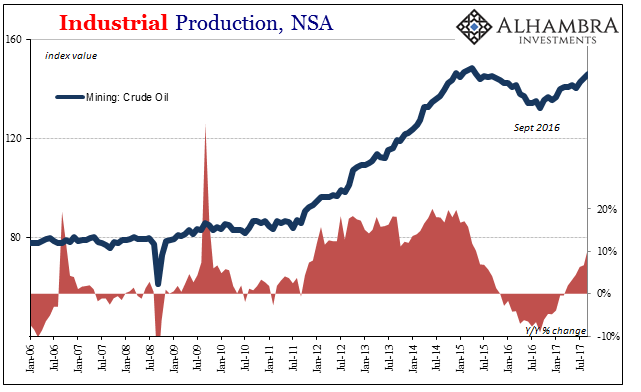 - Click to enlarge |
| On the other side, the most significant drag continues to be in the auto sector. Motor vehicle assemblies only gained by a small amount in September above August, and remain closer to the very low level of production found at the larger-than-normal factory shutdowns in July. The Fed estimates that domestic production was just 10.84 million SAAR last month compared to 10.65 million the month before and 10.13 million in July. At its peak in July 2015, production was just about 13 million units. |
US Motor Vehicle Assemblies, Jan 2013 - Jul 2017(see more posts on U.S. Motor Vehicle Assemblies, )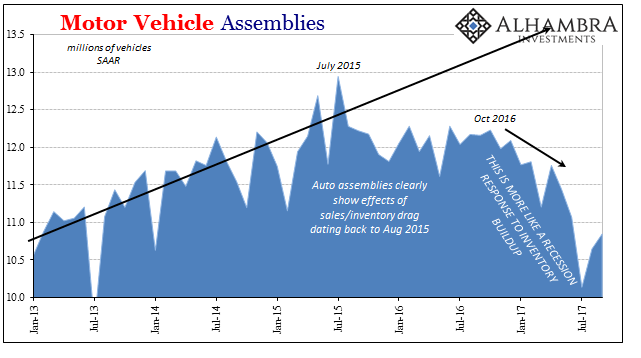 - Click to enlarge |
| These production cuts are the effect of a sales plateau (to borrow Ford’s 2016 characterization) subsequently ballooning inventories across the nation’s dealer networks. It seems as if carmakers believed the sales slowdown was transitory (where might they have got that idea?), and thus only marginally scaled back production at the onset of what they thought was minor weakness (ignoring that the inflection took place in the second half of 2015). |
US Motor Vehicle Assemblies, Jan 2006 - Jul 2017(see more posts on U.S. Motor Vehicle Assemblies, )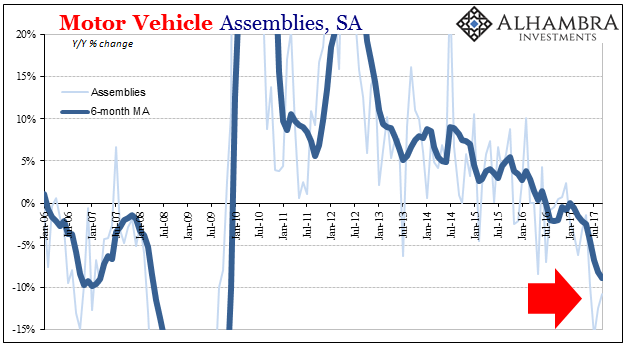 - Click to enlarge |
| Sales never did rebound and in 2017 up until August continued instead to get worse – provoking the much larger production cuts even before the July factory turnover.
Harvey and Irma have then delivered what Janet Yellen could not, meaning an actual sales bump in September. The Bureau of Economic Analysis figures total vehicle sales last month surged to 18.9 million (SAAR), the highest since 2005, and surely related to the replacement of storm-damaged autos. |
US Motor Vehicle Sales and Production, Jan 2011 - Jul 2017(see more posts on motor vehicle sales, )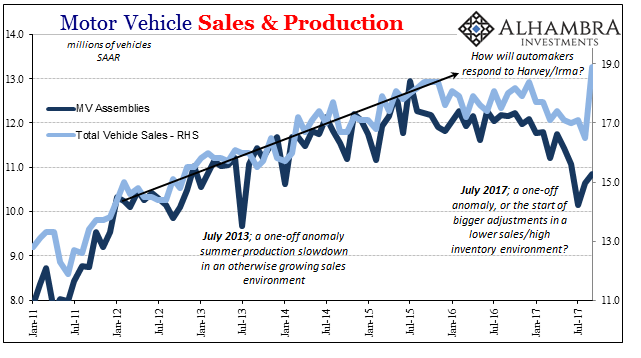 - Click to enlarge |
| That will clear out some of the inventory overhang, but how much? There isn’t really any way to know for sure, and it’s not at all clear that it will make much difference in the intermediate term. Certain production lines might be restarted at higher volumes to replace particular brands or models, but again the sales problem and thus the overriding inventory problem preceded the tropical rains of late summer. The production cuts go back now a full year to last October and up until August had yet to register all that much on inventory.
Even if there is heavy buying in and around Houston and Florida’s Gulf coast, it’s not likely to move out the entire inventory imbalance. Without an actual change in the income/employment situation for consumers, and recent payroll data is not encouraging on that front, auto producers should still have the same sales plateau (at best) to contend with and therefore at best a lower ceiling on any production rebound. It would suggest a temporary storm distortion that the auto sector will deal with through temporary shifts. Industrial production is now running below 2% growth for three straight months, having only achieved 2% for a total of 3 months out of the last 32, meaning it doesn’t appear to be close to breaking out toward even normal levels of growth and momentum even after quite a lot of contraction in those nearly three years. We can now add IP to the lengthy catalog showing where the economic part of “reflation” was contained largely to the last half of 2016 and at best a few months to start 2017. |
Swap Spreads, Jan 2007 - 2017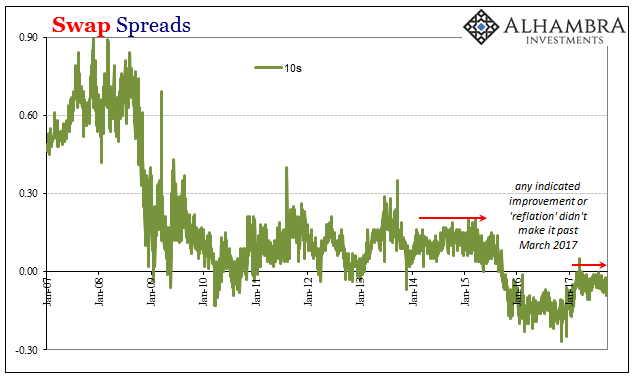 - Click to enlarge |
It is important to note why that might be, and what that might mean. To the first part, the end of “reflation” was surely a eurodollar matter of various dimensions (repo, oil prices, swap spreads, etc.) that combined with economic disappointment (growth last year even during the best months really wasn’t all that impressive) could have only abruptly halted the rebound.
As to the second part, I think we are already starting to see the initial effects of economic disappointment and a shift toward non-policy monetary tightening. The auto sector is a bit further ahead in that process than in other parts of the domestic and global economy, but in this case it may be a difference of timing than anything else. Downside risks haven’t so much re-emerged as has upside risk again dissipated (thus another “reflation”).
Full story here Are you the author?Tags: Auto Sales,Crude Oil,currencies,economy,EuroDollar,Federal Reserve/Monetary Policy,industrial production,manufacturing,Markets,Mining,Motor Vehicle Assemblies,motor vehicle sales,newslettersent,Reflation,swap spreads,U.S. Capacity Utilization,U.S. Industrial Production,U.S. Motor Vehicle Assemblies