Jeffrey P. Snider
My articles My offerMy siteAbout meMy videosMy books
Follow on:LinkedINTwitterSeeking Alpha
One day after reporting a slightly better number for Q2 GDP, the BEA reports today that there is little reason to suspect it was anything more or lasting. The data for Personal Income and Spending shows that the dominant condition since 2012 remains in effect – “good” quarters, or whatever passes for one these days, are the anomaly. There still is no meaningful rebound in income.
| Real Personal Income excluding Transfer Receipts was last month revised considerably lower for last year, suggesting some severe labor market strain as a result of the downturn. As of the latest benchmarks, the BEA figures that this important core part of national income actually contracted year-over-year for three straight months to end 2016. Despite such heavy weakness there is as yet no acceleration in 2017.
For July, incomes grew by just 1.3%. That’s the fourth straight month at less than 1.5% since reaching that level again back in March. Like so many other economic accounts, there was a modest rebound either late last year or, as in this case, early in 2017 that didn’t last very long. |
Real Personal Income excl. Transfer Receipts 2014 - 2017(see more posts on real personal income excluding transfer receipts, )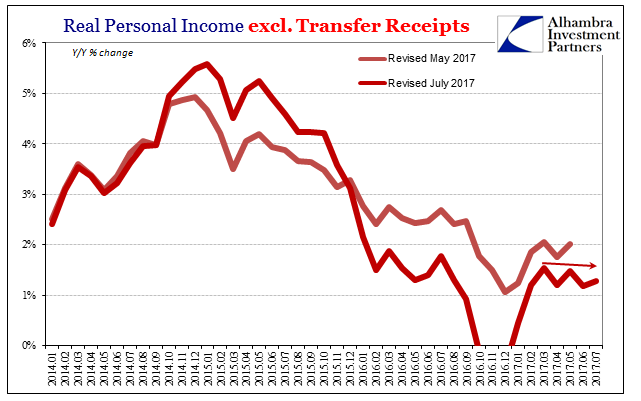 - Click to enlarge |
Real Personal Income excl. Transfer Receipts 2013 - 2017(see more posts on real personal income excluding transfer receipts, )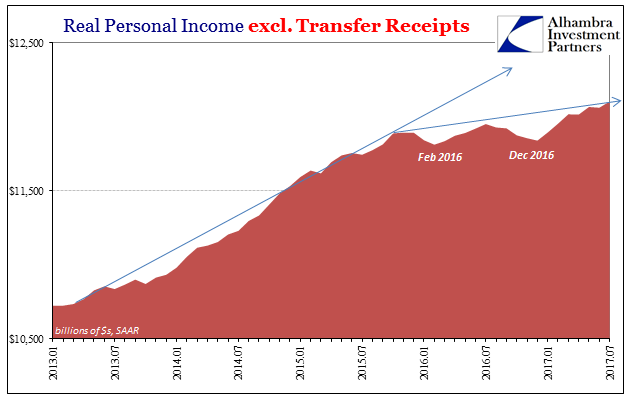 - Click to enlarge |
|
| It’s a similarly disappointing story through all the various measures of income, establishing that the trouble is income and not transfers. Real Disposable Personal Income per capita hasn’t grown by greater than 1% since last July. The difference in degree or rate as compared to Real Personal Income excluding Transfer Receipts is this statistic’s consideration of income across the whole population, not just those who have been able to find work since the Great “Recession.” Over the past five months, it has been stuck expanding by around half a percent. |
Real DP Per Capita 2010 - 2017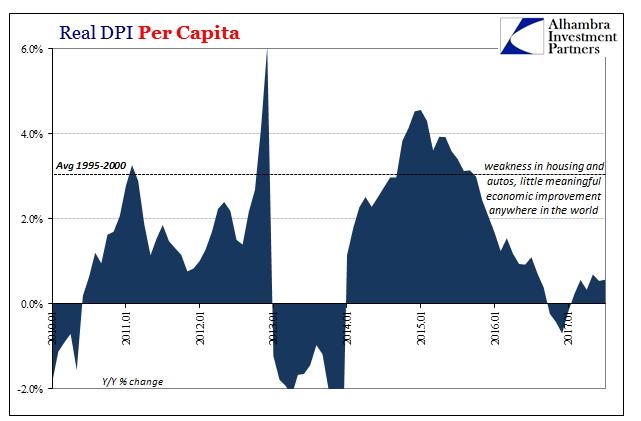 - Click to enlarge |
Real DPI Per Capita 2013 - 2017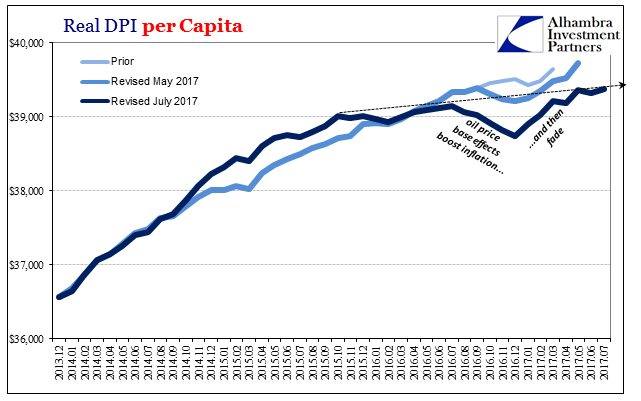 - Click to enlarge |
|
| What that actually suggests is that apart from the oil effect on inflation rates the labor market and thus American national income remains stuck on the lower trajectory given to it as a result of the “rising dollar” downturn. Despite its end more than a year ago, it shows no signs of disappearing. As has been the consistently the case, the economy grows weaker during these near-recessions (2012, 2015-16) and tends to stay that way against all historical experience. |
Real Personal Income Excl. Transfer Receipts 2010-2017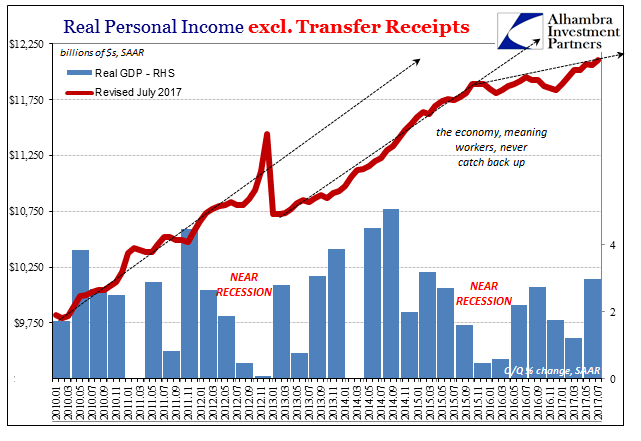 - Click to enlarge |
| Without sustained income growth, spending both has to decelerate as well as take up more of the marginal safety for consumers. The Personal Savings Rate (for what it’s worth) fell sharply in 2016 and absent income acceleration remains quite low. It offers an explanation as to why the housing market as well as automobile sales have all come under pressure this year. These figures contain the ingredients for growing uncertainty as well as outright caution (the opposite condition being required for robust sales especially of big ticket items). |
Real Personal Consumption Expenditures 2014-2017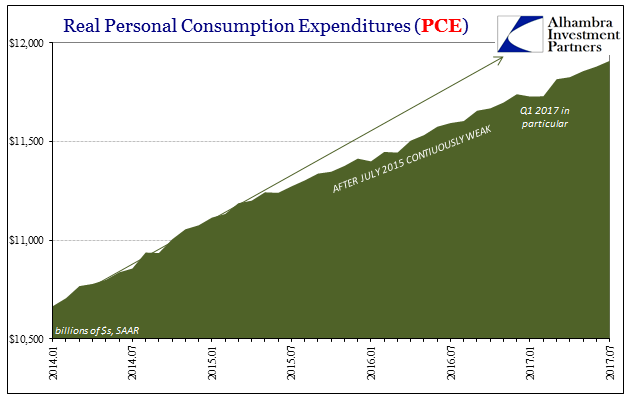 - Click to enlarge |
| What’s really amazing (meaning expected) is just how much these economic statistics are following “reflation” in markets. More and more it appears as if that trend in the bond market or eurodollar futures (or whatever other global equivalent) was nothing more than a brief spurt of optimism (repeating 2013). It didn’t last much past February, maybe March. In terms of Personal Incomes of whatever flavor, the same pattern is being carried out. |
Personal Savings Rate 2013-2017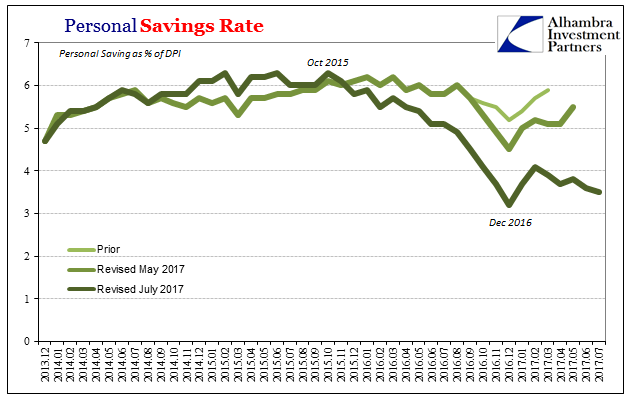 - Click to enlarge |
| The economy stopped getting worse at some point last year, but it has not gotten better. It’s a major distinction that explains, or is explained by, various curves to start with. The ratchet effect continues, where the “dollar” is that ratchet. |
Corporate Cash Flow/ Monetary Noose 2000-2017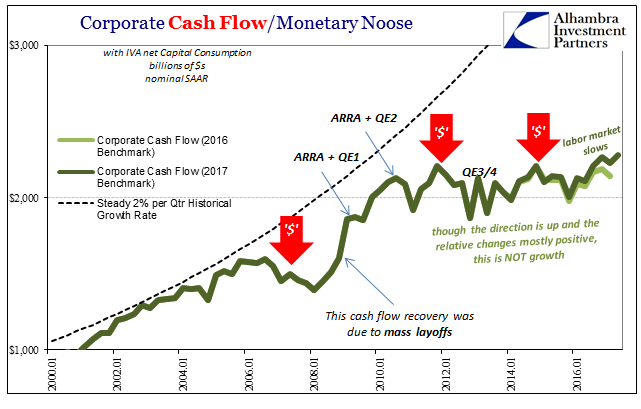 - Click to enlarge |
Eurodollar Futures Curve 2009-2017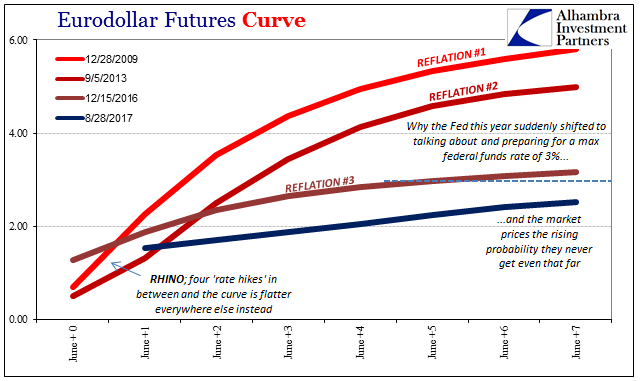 - Click to enlarge |
|
Japan JGB Curve Spreads 2013-2017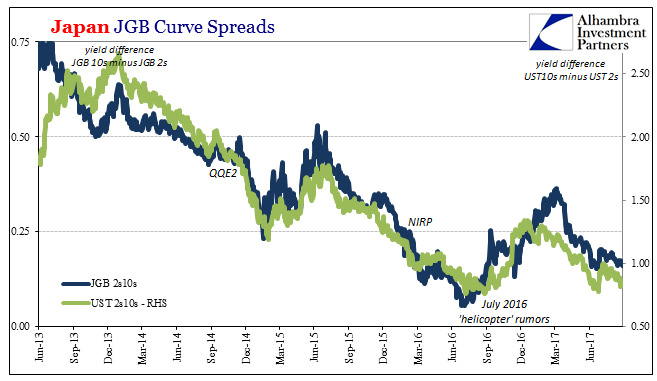 - Click to enlarge |
Tags: Bonds,consumer spending,consumers,currencies,economy,employment,EuroDollar,Federal Reserve/Monetary Policy,GDP,income,inflation,Labor Market,Markets,newslettersent,PCE,personal consumption expenditures,real personal income excluding transfer receipts,wages