


Joseph Y. Calhoun
My articles My siteAbout meMy videosMy books
Follow on:LinkedINTwitterSeeking AlphaAmazon
| This update will be a bit shorter than usual. I’m in Miami awaiting Hurricane Irma. As of now, it looks like the eye of the storm will make landfall near Key West and continue west of us with the Naples/Ft. Myers area at risk. Or at least that’s the way it looks right now. I’ve done a lot of these storms though – I lost a house in Andrew in ’92 – and you never know what these things will do. We are secure in a house that survived Andrew with barely a scratch so we’re pretty confident. In some ways it is like monitoring the economy. I don’t believe you need to predict anything – just recognize what is actually happening in the present and react accordingly.
The economic reports of the last two weeks were not as bad as the market moves they precipitated. That could be due to other factors such as Hurricane Harvey and its impact on the energy industry or the now fairly normal political chaos that is the Trump administration. Whatever the cause, the market based indicators we watch all deteriorated to some degree or another. 10 Year Treasury yields continued to fall: |
US 10 Year Treasury Yield, Feb - Sep 2017(see more posts on U.S. Treasuries, )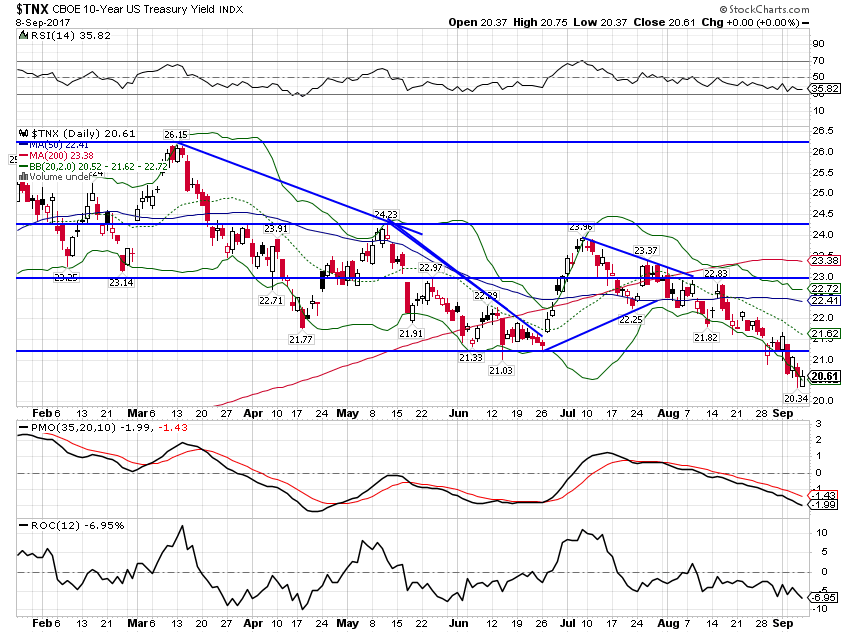 - Click to enlarge |
| In this case it was not just a drop in inflation expectations that pulled down rates. TIPS yields fell rather dramatically, with the 10 year dropping 16 basis points in just the last two weeks. |
US 10 Year Treasury Inflation, Jan 2013 - 2017(see more posts on U.S. Treasuries, )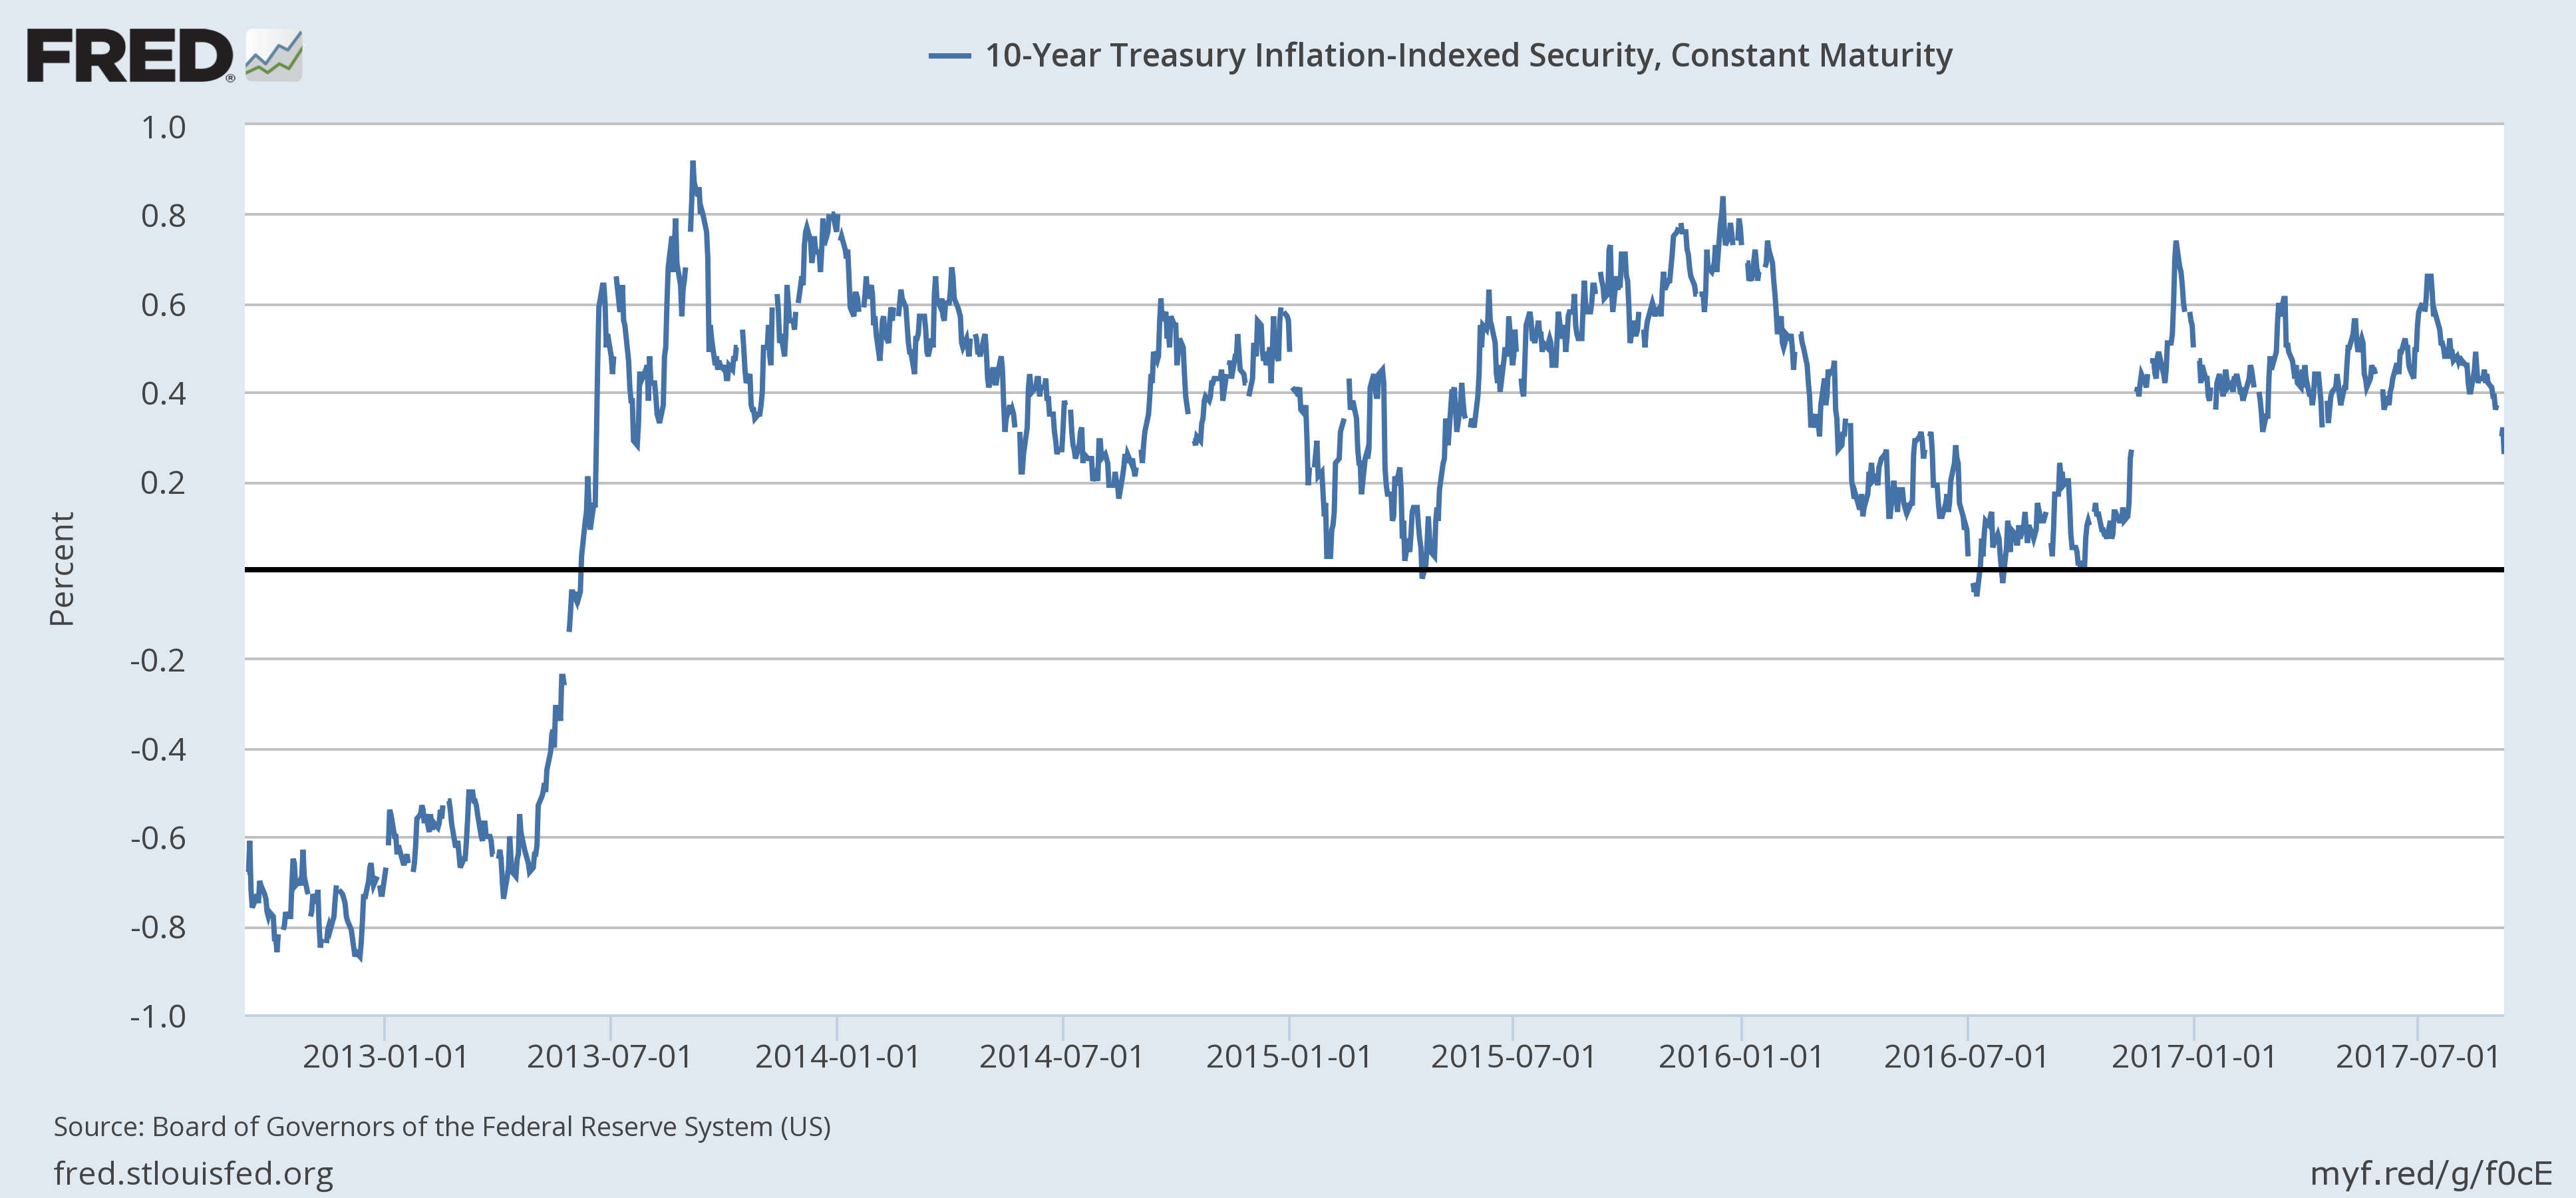 - Click to enlarge |
| The drop in real rates kept the dollar on its downward path: |
US Dollar Index, Dec 2016 - Sep 2017(see more posts on U.S. Dollar Index, )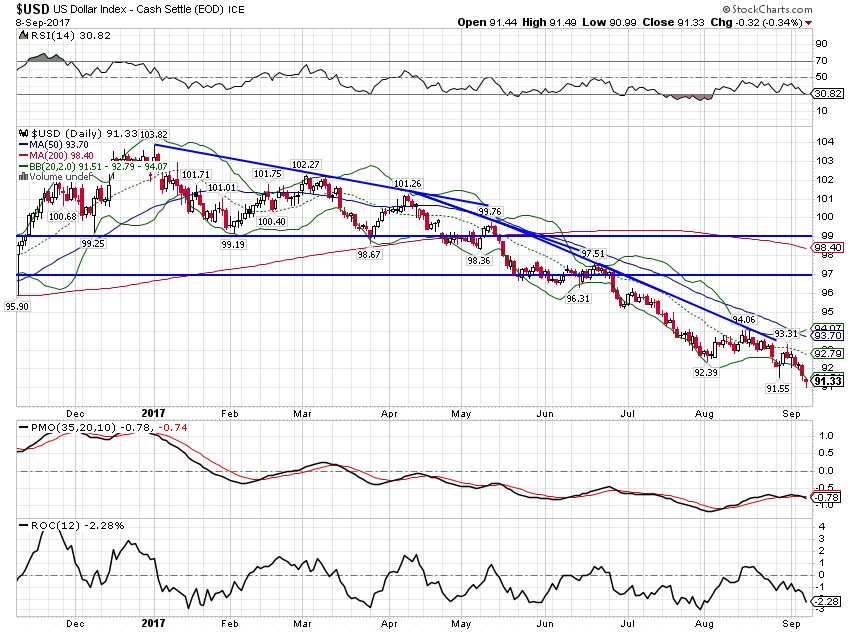 - Click to enlarge |
| The falling dollar finally pushed gold through resistance: |
Gold - Continuous Contract, March - Sep 2017(see more posts on Gold, )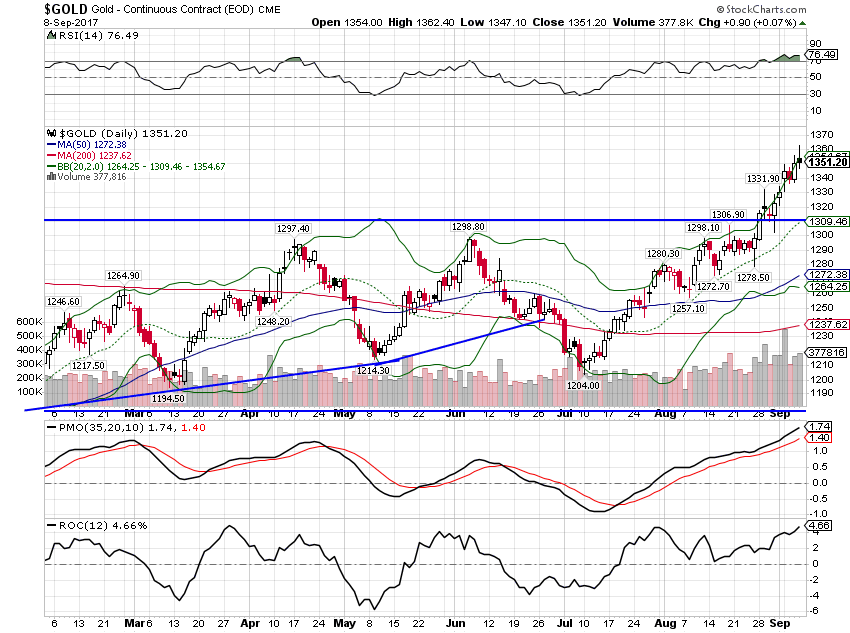 - Click to enlarge |
| The yield curve also flattened but only by a couple of basis points: |
10 Year Treasury Constant Maturity Minus 2 Year Treasury Constant Maturity, 2010 - 2017(see more posts on U.S. Treasuries, )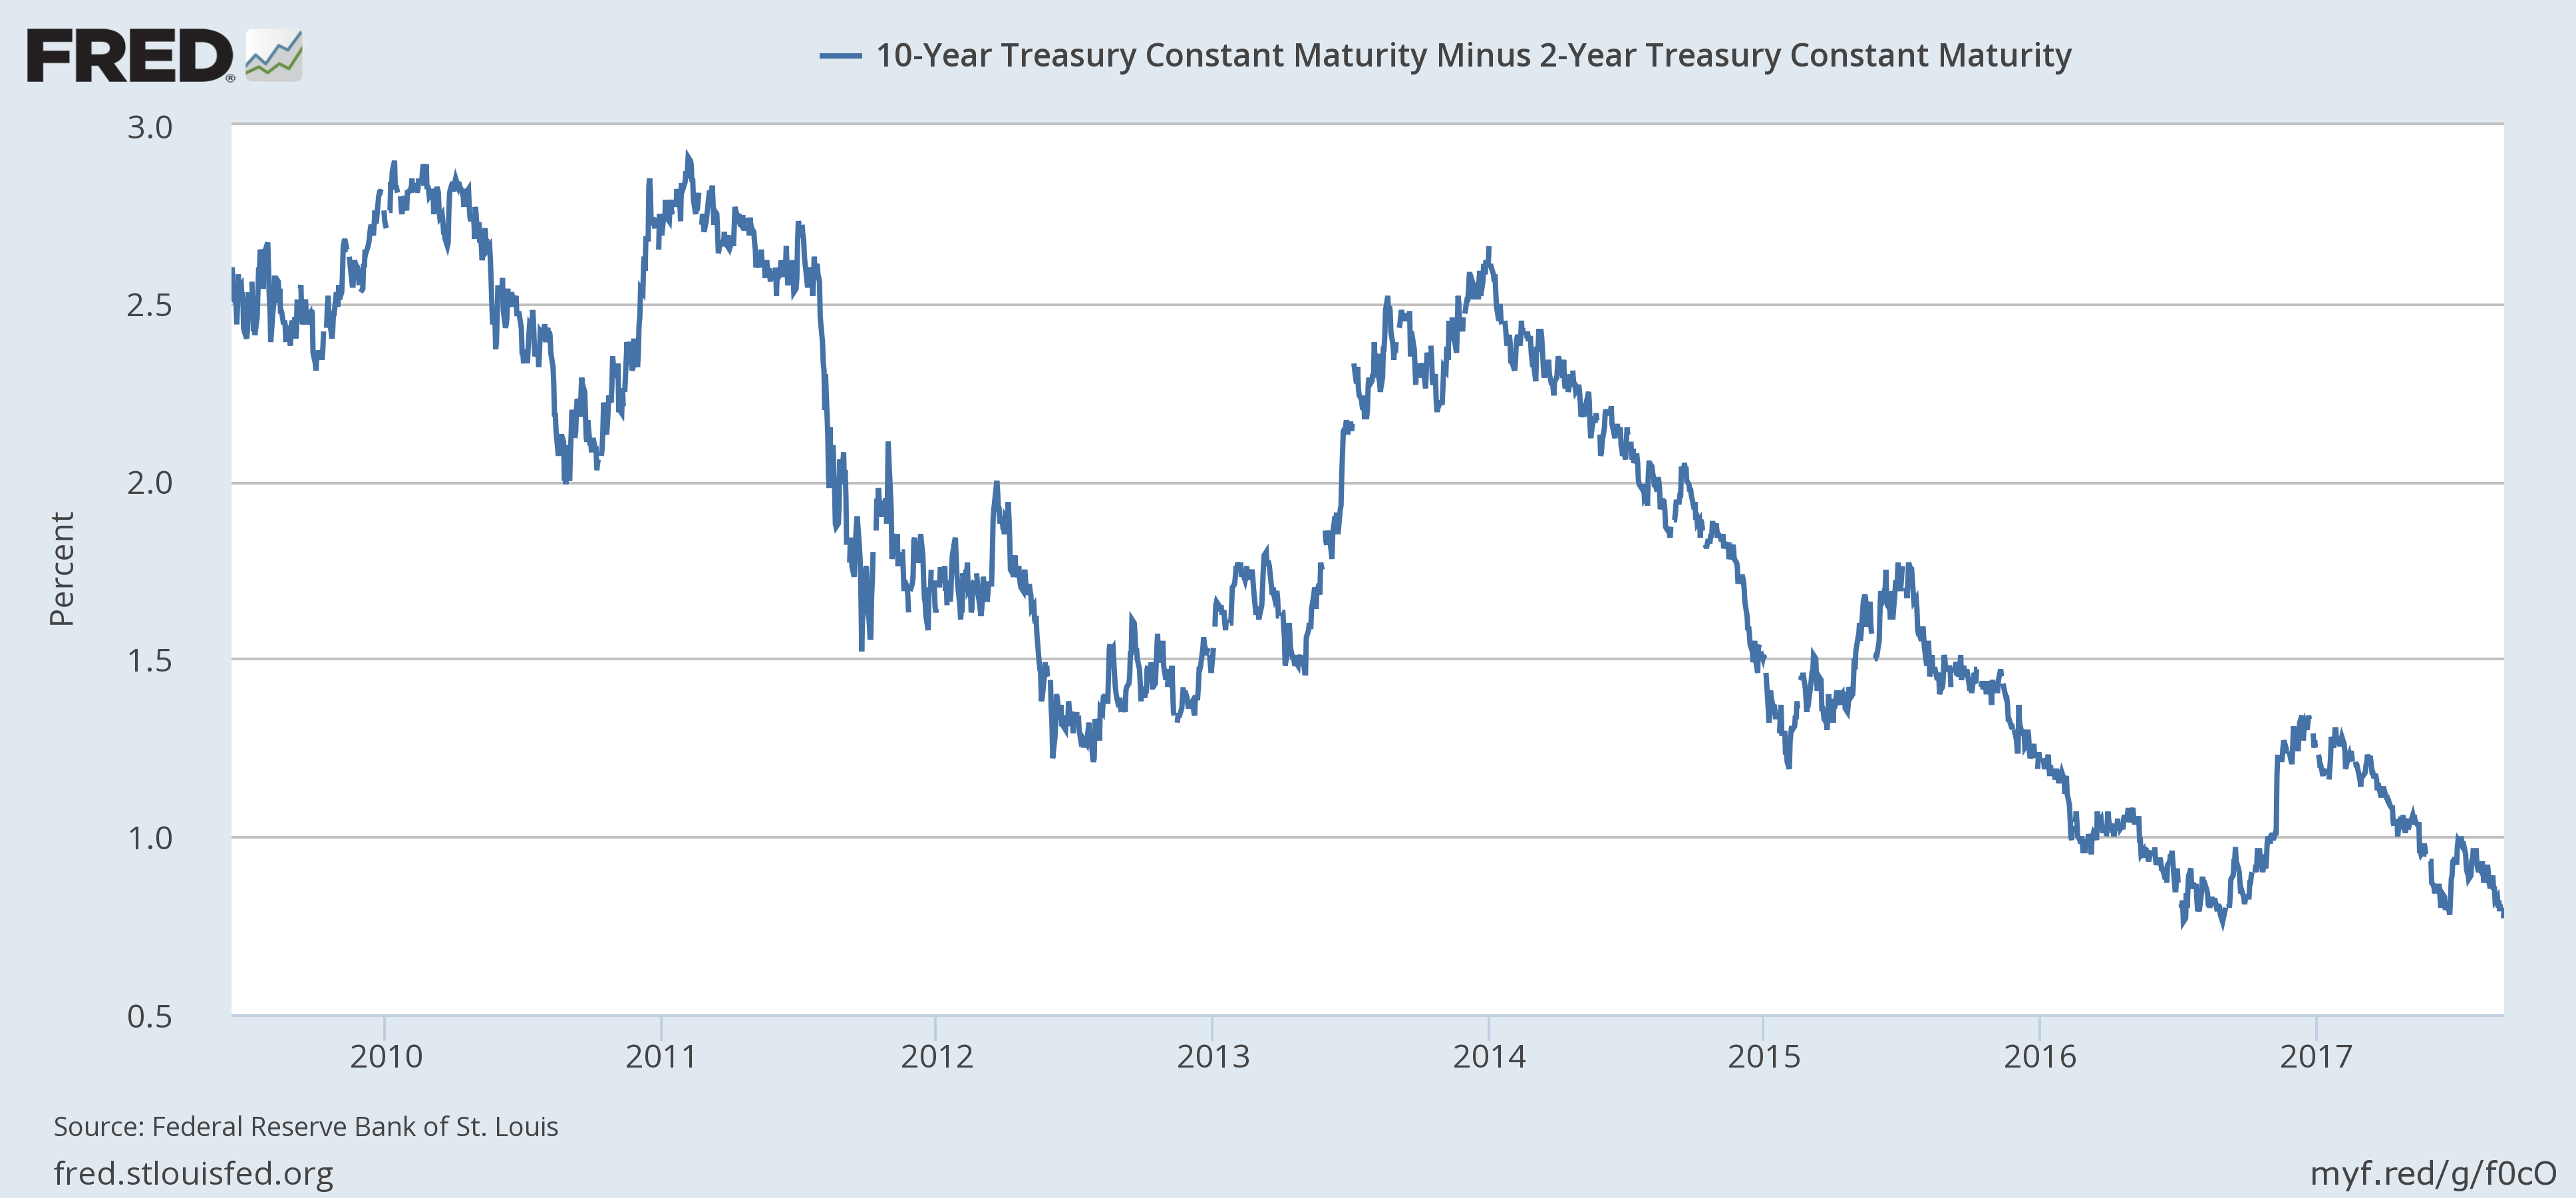 - Click to enlarge |
| As I’ve been expecting, the copper:gold ratio finally started to re-converge with the 10 year Treasury note yield: |
Copper:Gold Daily, March - Sep 2017(see more posts on Copper, Gold, )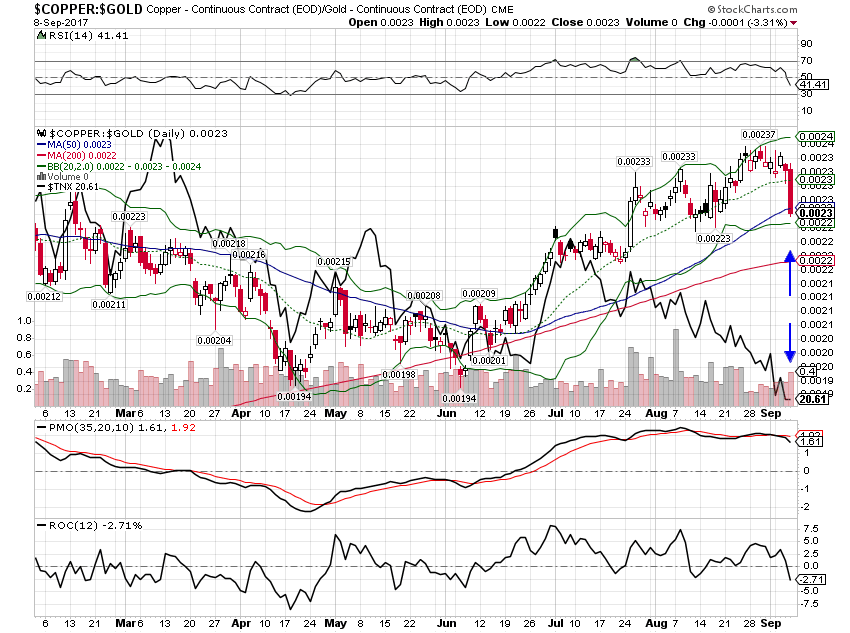 - Click to enlarge |
| Credit spreads barely budged, the only one of these indicators that didn’t point to weaker growth: |
BofA Merrill Lynch US High Yield Option, Jan 2013 - 2017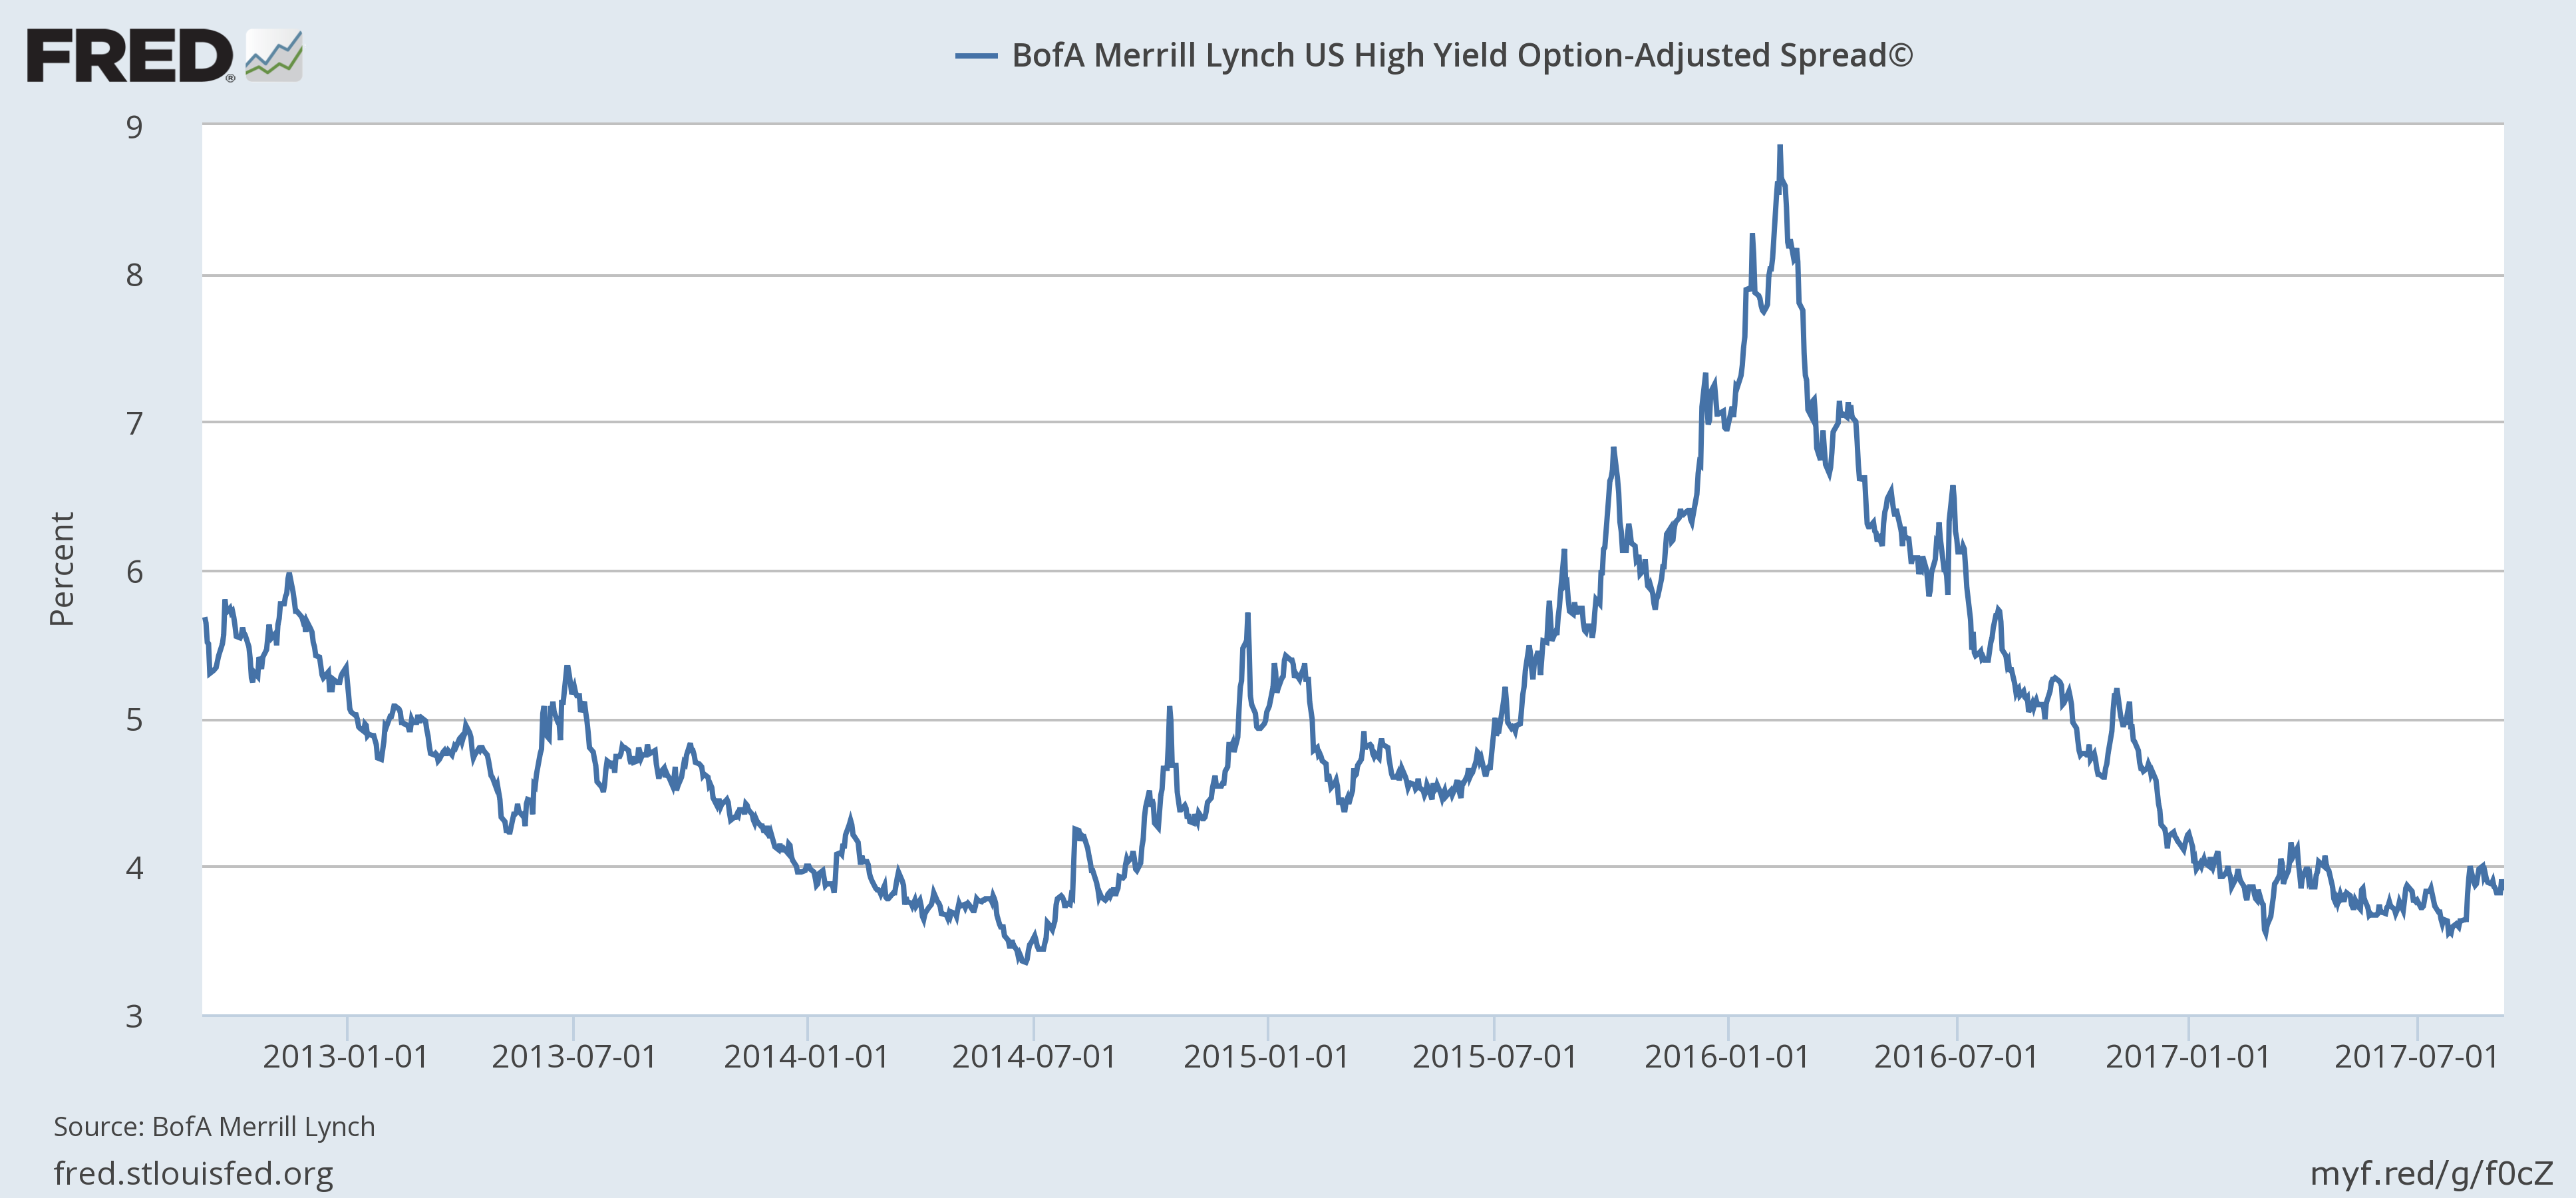 - Click to enlarge |
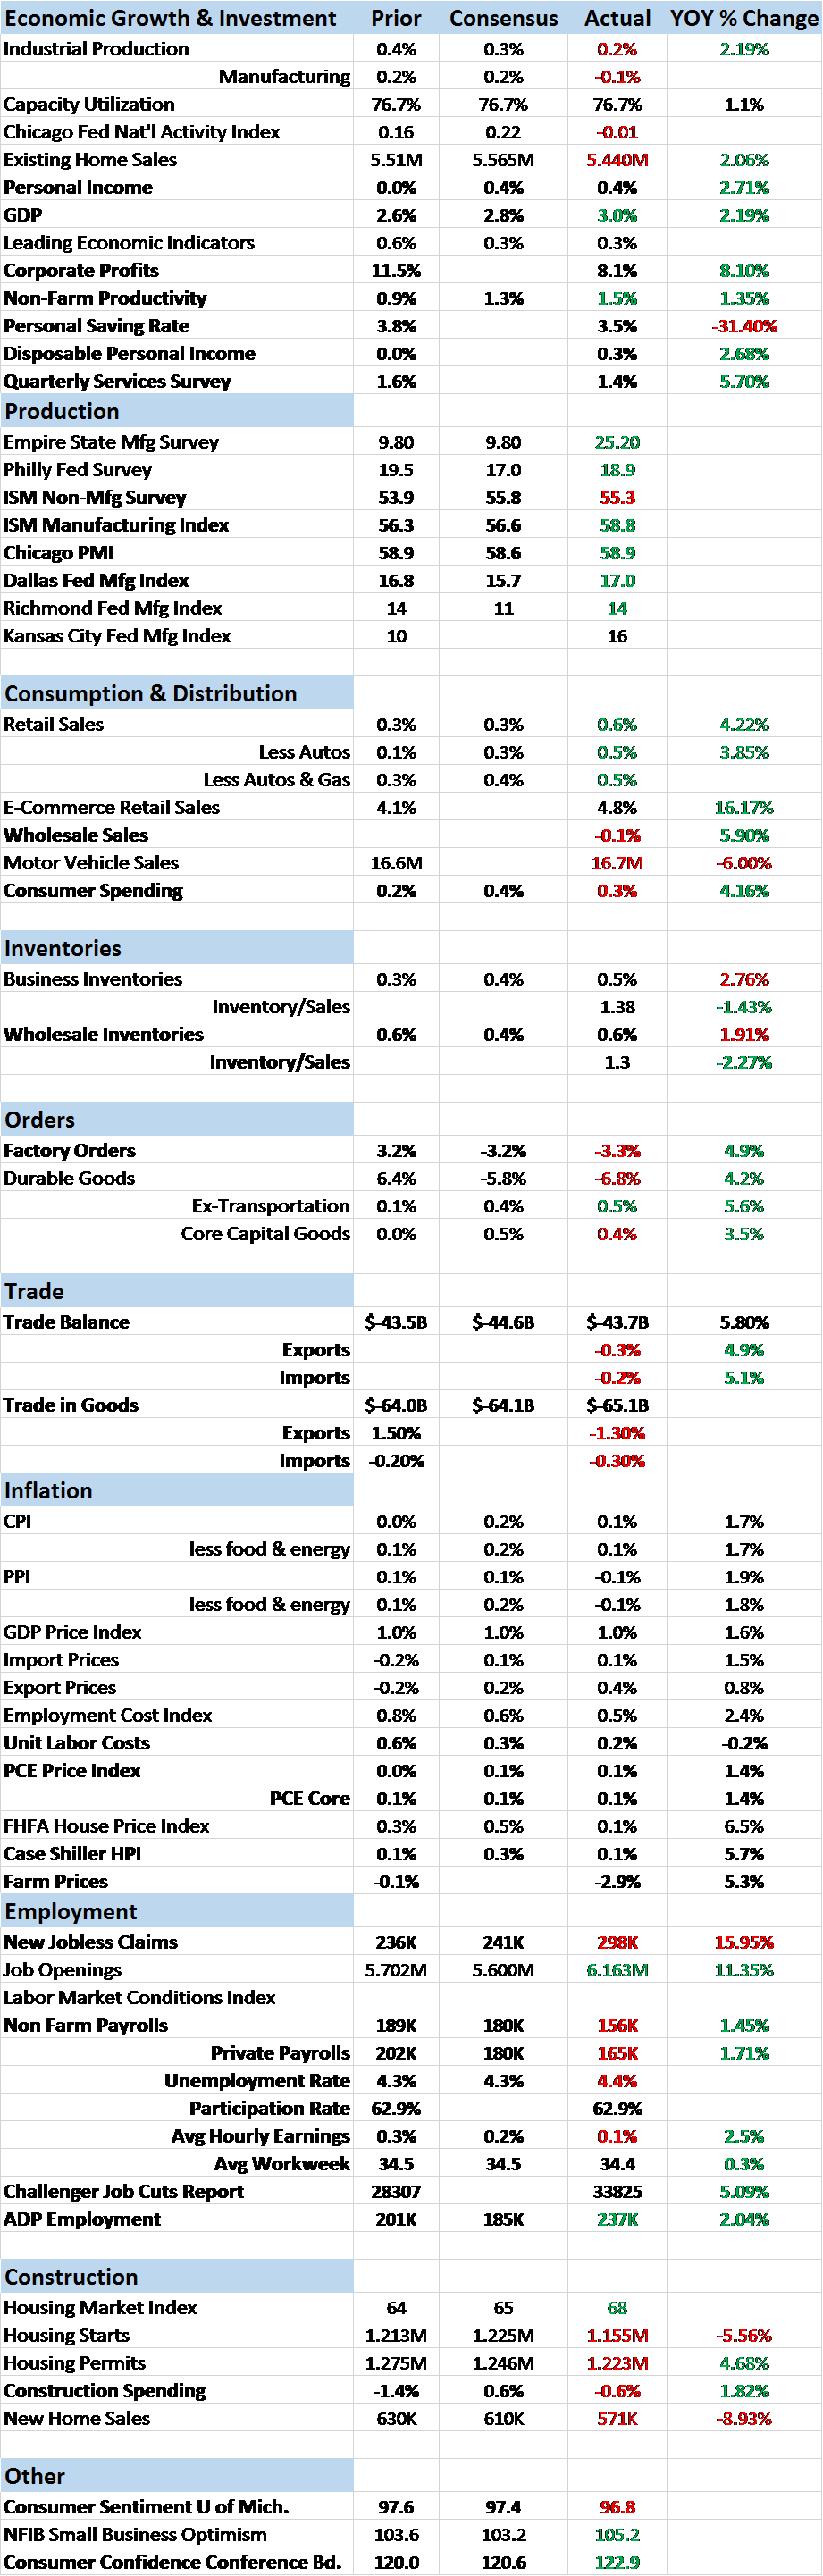
One of the better than expected reports of the last two weeks was the GDP revision that pushed Q2 growth to 3% Q/Q and 2.2% YOY. Unfortunately, that is backward looking and tells us little about how things are today. Other indicators show more weakness. Wholesale inventories are rising relative to sales, personal income is growing slowly, productivity continues to stagnate, exports and imports are falling and construction spending is barely growing year over year. Challenger also reported a rise in layoffs and the employment report was well shy of estimates. While there were no big positives, the negatives were not so negative that one would expect growth to fall much out of the range we’ve experienced over the last few years.
I am on a somewhat heightened alert right now. Several of our indicators are trending in a negative direction. It isn’t so much yet that any portfolio action is warranted but as I’ve said many times before, when you are growing at 2% it doesn’t take much to push you to 0% or something with minus sign. With two large hurricanes in the last two weeks, it seems prudent to stay alert.
Tags: Alhambra Research,Bi-Weekly Economic Review,Bonds,commodities,Copper,copper to gold ratio,credit spreads,currencies,economic growth,economy,GDP,Gold,Interest rates,newslettersent,TIPS,treasuries,U.S. Dollar Index,U.S. Treasuries,US dollar,Yield Curve


