| When it comes to central bank experimentation, Japan is always at the forefront. If something new is being done, Bank of Japan is where it happens. | |
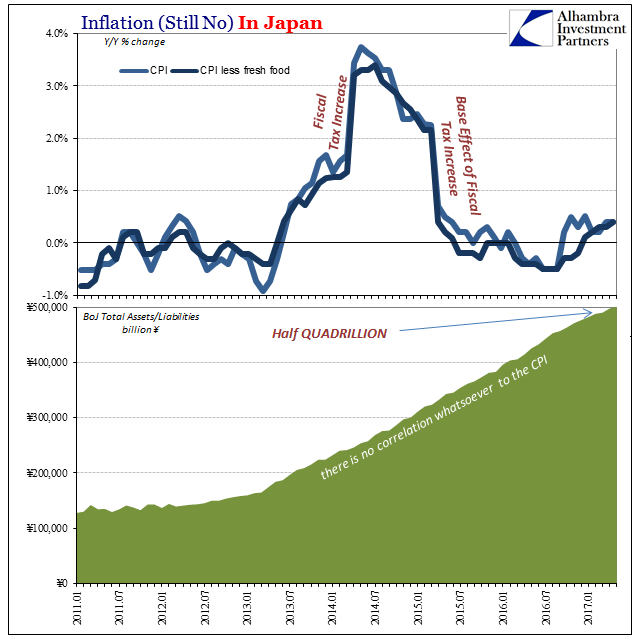
| In May for the first time in human history, that central bank’s balance sheet passed the half quadrillion mark.
|
|
| It should be unsettling where a trillion is a rounding error. And yet, despite what appears outwardly like insanity there isn’t again the slightest hint this is anything more than an impressive but ultimately meaningless number. |
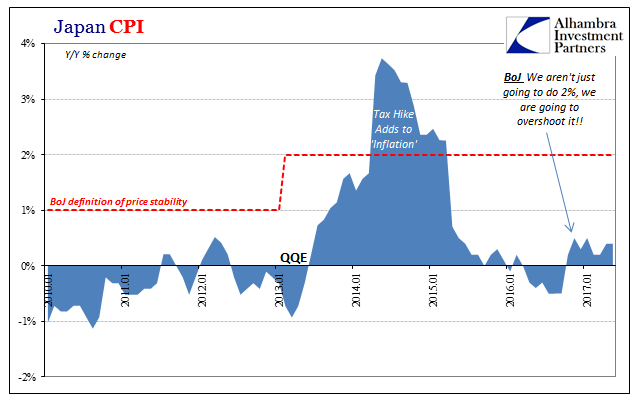
Japan Consumer Price Index, January 2010 - July 2017(see more posts on Japan Consumer Price Index / Inflation, ) |
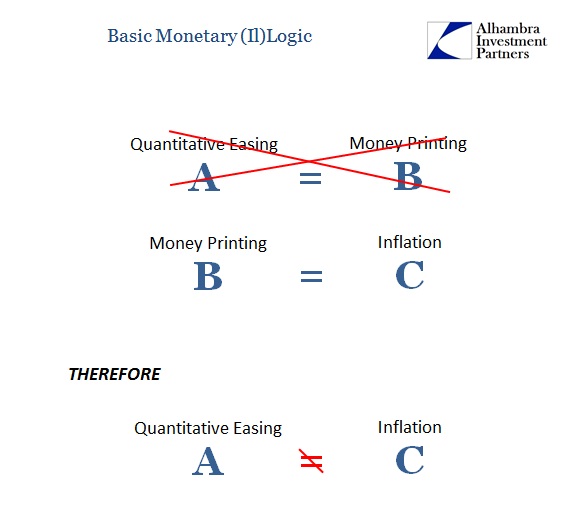
| Japanese inflation, like US inflation, bears no resemblance to BoJ activities no matter how far into the stratosphere officials in Tokyo intend to take their assets and liabilities. In simple logical terms, QE can’t be money printing else Haruhiko Kuroda would have been remembered long before today in the same way Rudolf von Havenstein is. |
Japan Inflation, January 2011 - July 2017(see more posts on Japan Consumer Price Index / Inflation, ) |
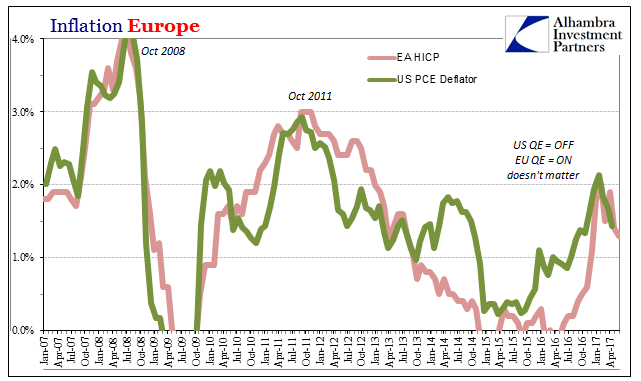
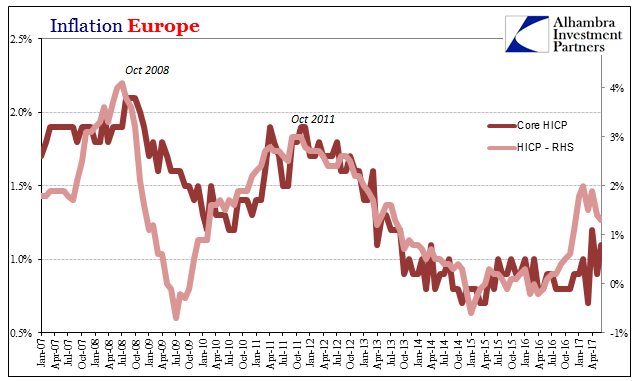
| We can further test the hypothesis (not that it needs more confirmation) using the United States and Europe, the Fed versus the ECB. The former ended QE two and a half years ago, while the latter continues still today. Yet, despite what should be enormous differences in monetary conditions, there is instead very little if any distance between inflation rates. They actually behave as if acting in concert (because by and large they are, global money rather than individual geographical levels of bank reserves). |
Europe Inflation, January 2007 - July 2017 |
| In both Europe as the US inflation hit 2%, briefly, for reasons having nothing to do with any central bank. The price of oil achieved what neither could, and what the Bank of Japan has been doing for twenty years without the slightest hint of success. |
Europe Inflation, January 2007 - July 2017 |
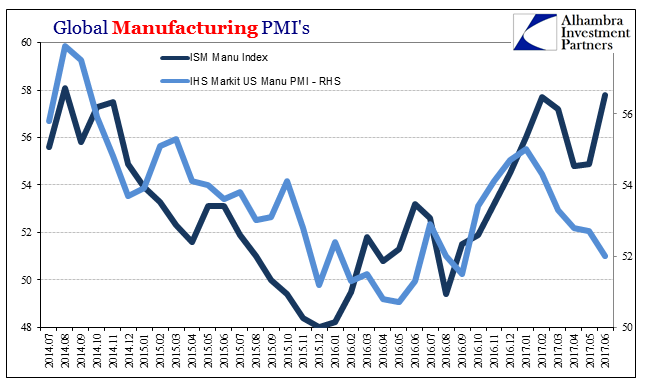
| Only somewhat related to inflation, global PMI’s in early July have grown apart. The ISM Manufacturing Index jumped to a multi-year high after dropping for two months, while the IHS Markit Manufacturing PMI fell again, down slightly more from the flash indication a few weeks ago. | |
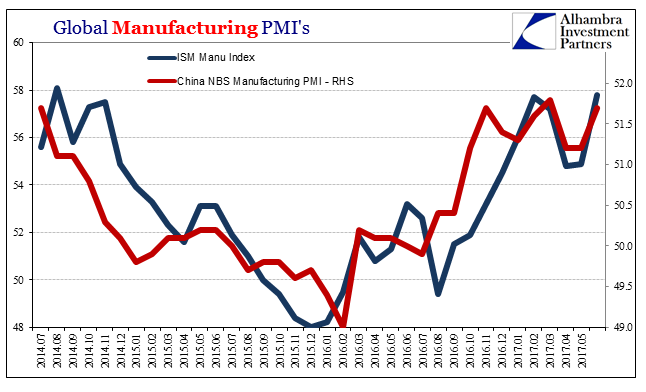
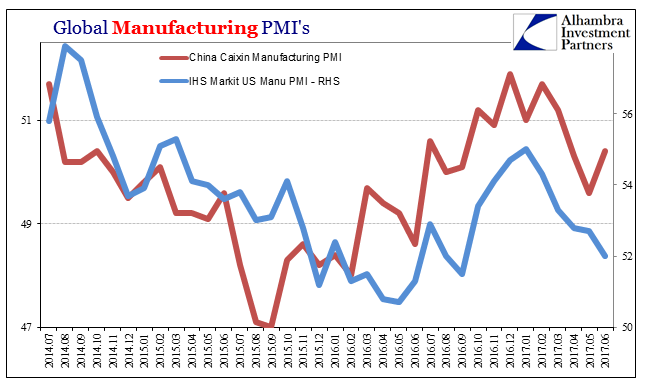
| The same was true, to a degree, in China, where the official NBS manufacturing PMI rebounded by more than the Caixin version. The latter matches more closely the IHS/Markit survey, while the NBS more (very) closely resembles the US ISM. |
US and China Manufacturing PMI's, July 2014 - July 2017 |
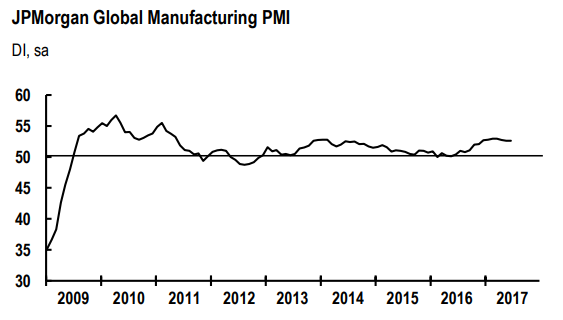
| I believe the overall issue remains lack of actual growth, the repeating condition of mere positive numbers as opposed to meaningful expansion. The JP Morgan Global Manufacturing PMI illustrates this point quite well: |
US and China Manufacturing PMI's, July 2014 - July 2017 |
|
Growth around the world is up but only slightly compared to last year; more like 2014 than 2010 or early 2011. Because of that, the underlying economic condition is not one of strength but continued unevenness. Some parts of the global economy are legitimately doing better than last year, but others are not. The result is what we find across global inflation figures as well as PMI’s, in general terms the same inability to strike up momentum. It’s as if “something” continues to anchor and weigh down the global economy. |
JPMorgan Global Manufacturing PMI, 2009 - 2017 |
Full story here Are you the author? Previous post See more for Next post
Tags: Bank of Japan,China,china nbs manufacturing pmi,CPI,currencies,ECB,economy,Europe,Federal Reserve,Federal Reserve/Monetary Policy,hicp,inflation,Japan,Japan Consumer Price Index / Inflation,manufacturing,Markets,newslettersent,pce deflator,PMI


