| The majority of the economic reports over the last two weeks have been disappointing, less than the consensus expectations. The minor rebound in activity we’ve been tracking since last summer appears to have stalled. Retail sales continue to disappoint and inventory/sales ratios are once again rising – from already elevated levels. Even the positive reports were clouded by negative undertones. So far though our market based indicators have not deteriorated sufficiently to create any urgency when it comes to recession.
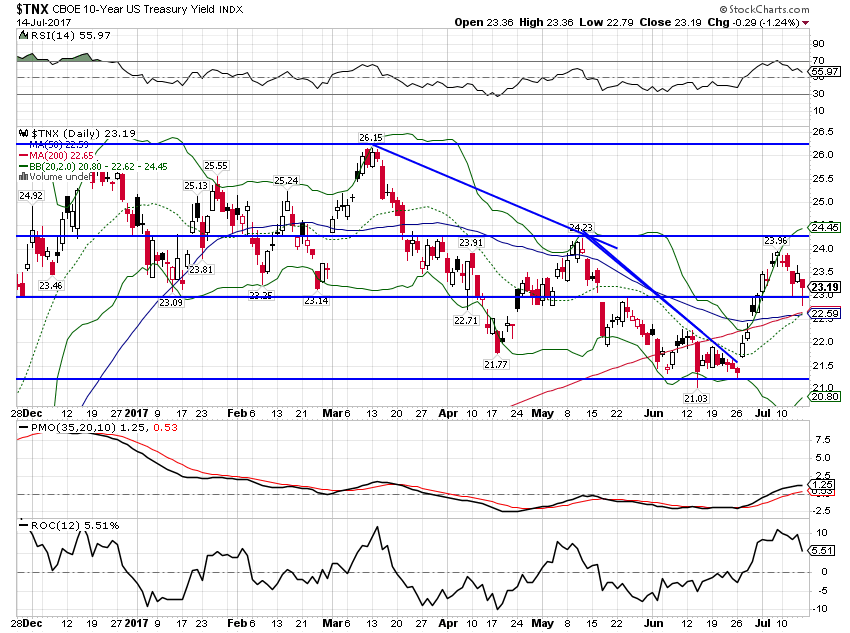
The US economy started to rebound some last summer, something we noted through our observation of market based indicators. Interest rates started moving higher, the yield curve steepened and real interest rates rose, all before anyone had an inkling that Donald Trump would be moving into the Oval Office. The election did accelerate those trends but they were really based on an inflection in real economic activity that preceded the election. Many of our market based indicators peaked around the beginning of the year but some continued to show high expectations for the US economy well into the new year. The 10 year Treasury note yield, for instance, peaked in mid-December but didn’t really break down until spring. |
US 10 year Treasury Yield, Dec 2016 - Jul 2017(see more posts on U.S. Treasury, ) |
| As you can see, we have seen a recent rebound in yields, based primarily on optimism about the global economy. There seems to be some expectation that better growth outside the US will also be positive for growth within our own borders. There is probably some truth to that but you’d have a hard time proving it by the high frequency economic data released recently.
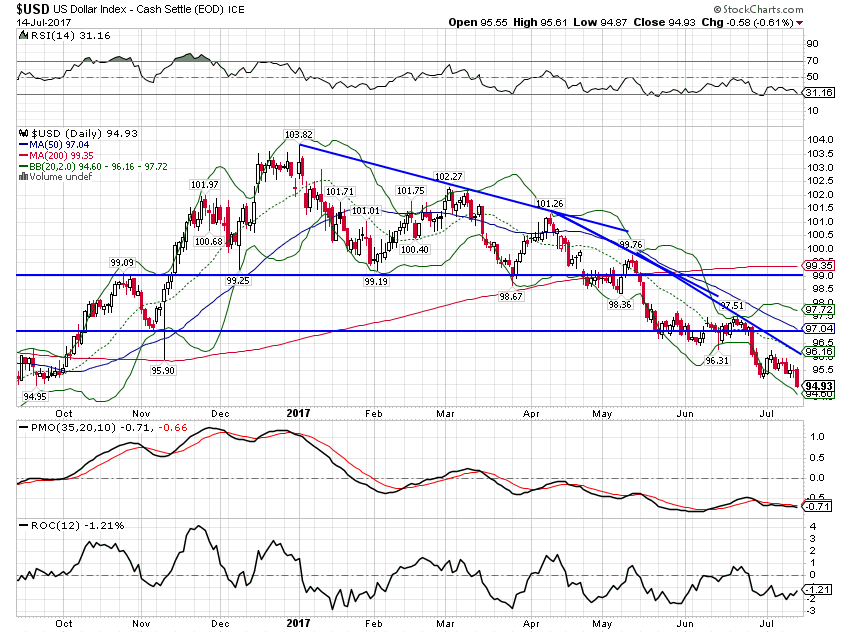
The Factory Orders report confirmed the durable goods report of the previous week but also showed that non-durables fell as well. Some of that was due to falling prices for gas and other fuels but not all. What tells you a lot more about the state of the US economy is that overall Factory orders are running at around the same level as a decade ago. And the rebound from last summer is already fading, the recovery from the 2015/16 slowdown failing at subdued levels. The ISM manufacturing survey was better than expected as was the non-manufacturing version. But we’ve been seeing that for some time now and as yet the optimism voiced in those reports has failed to show up in the official numbers. Other measures of sentiment are not doing as well. The NFIB survey of small businesses was less than expected, mostly due to disappointment on the lack of progress on healthcare reform. The U of Michigan consumer sentiment survey was also disappointing as expectations regarding the future are waning. As I said, even the positive reports had some warts. The employment report was better than expected but a big part of that was a surge in government hiring. It should also be noted that the rate of change continues to slow from its 2015 peak. The Fed’s own Labor Market Conditions Index came in less than expected and fell from the previous report. The JOLTS report showed a big jump in hiring and a rise in the quits rate – both positives – but job openings fell. One last better than expected report was Industrial Production. Unfortunately, the gain was mostly due to an increase in oil drilling, a continuation of which is obviously dependent on high oil prices. With the dollar falling and ex-US growth picking up that might be more likely than one might think but hoping for high oil prices seems a poor substitute for intelligent economic policy. The ugliest reports of the last two weeks concerned consumption or rather the lack thereof. The retail sales report was disappointing no matter how one sliced and diced it. Like many of the other economic reports we track, the recovery in retail sales that started last summer is fading and fading fast. The popular notion that Amazon is stealing all the sales from traditional retailers cannot account for the overall weakness. Indeed, non-store sales are still rising but at a slower pace, showing that the slowdown isn’t confined to bricks and mortar locations. The weak consumption numbers are reflected in several other reports, most prominently inventory. Both wholesale and total business inventories rose faster than sales pushing inventory/sales ratios higher. In particular, auto inventories are probably way too high given that sales appear to have peaked. Inventory had been moderating relative to sales but the ratio is now rising again. That will be a positive for GDP in the short run but unwanted inventory will eventually have to be worked off before production ramps up again. Weak consumption may also have been a factor in the weak inflation reports. Both PPI and CPI were less than expected and expectations for future rate hikes are fading. The trade report also confirmed weak US consumption and growth relative to the rest of the world with exports rising and imports falling. The result was the continued downtrend of the US dollar. |
US Dollar Index, Sep 2016 - Jul 2017(see more posts on US Dollar Index, ) |
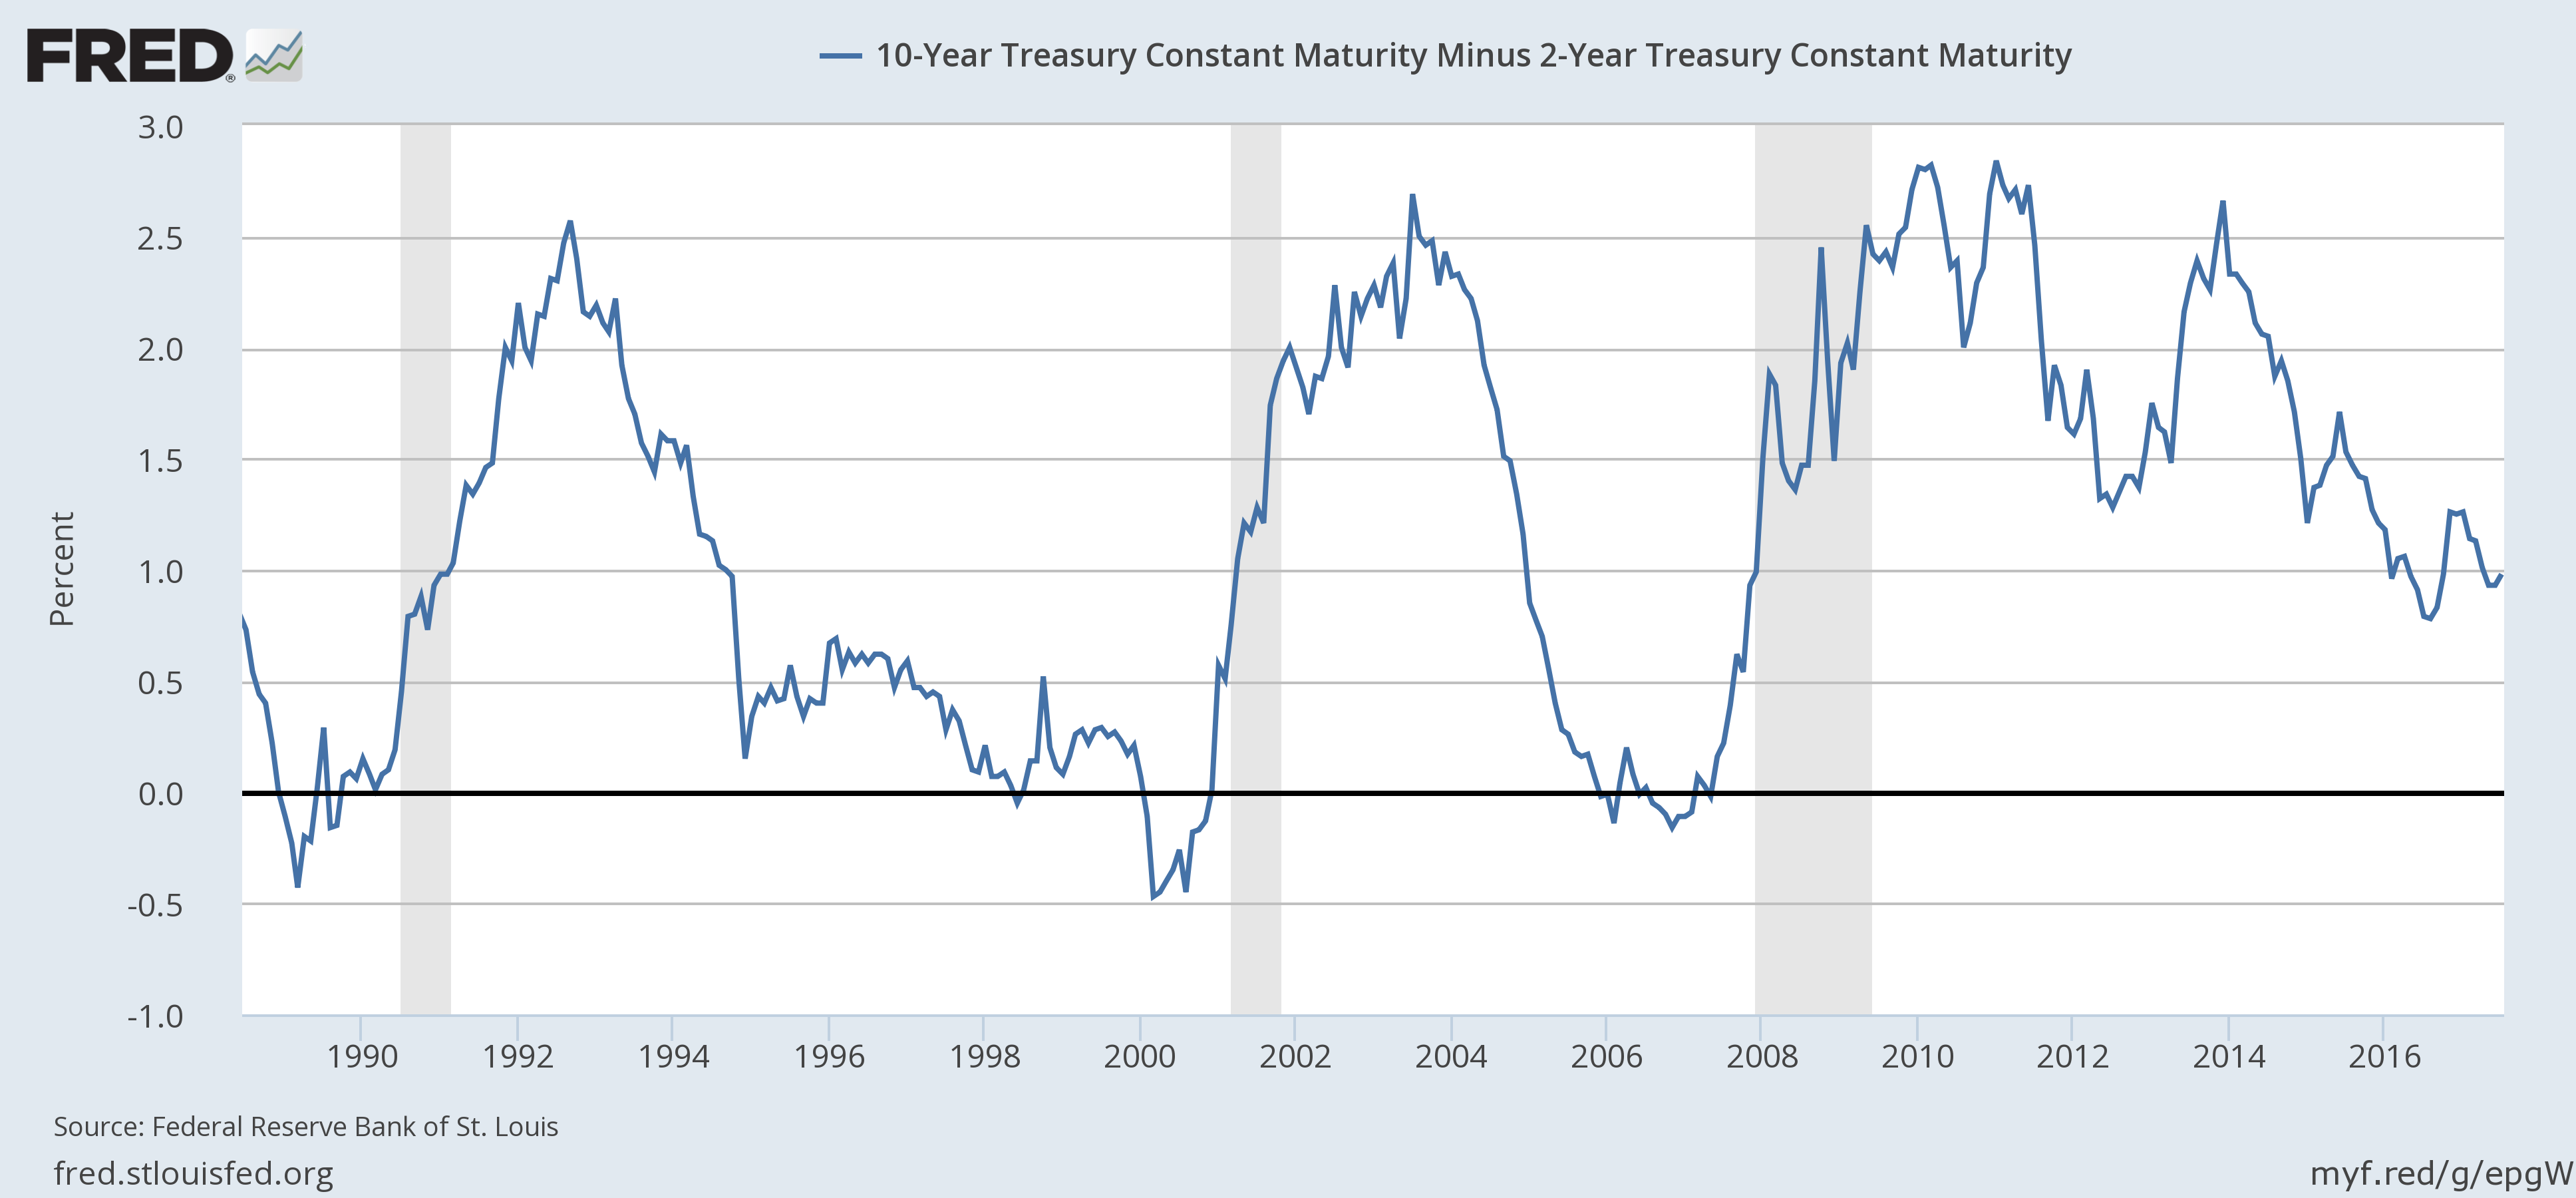
| Given all the bad economic data one might expect to see a rapid deterioration in our market based indicators. With the exception of the dollar though, most indicators continue to point to a continuation of the status quo. The yield curve actually steepened but only by 5 basis points. If the curve is going to go flat or invert before the next recession, we aren’t even close: |
US 10 Year Treasury Constant Maturity minus 2 Year Treasury, 1990 - 2017(see more posts on U.S. Treasury, ) |
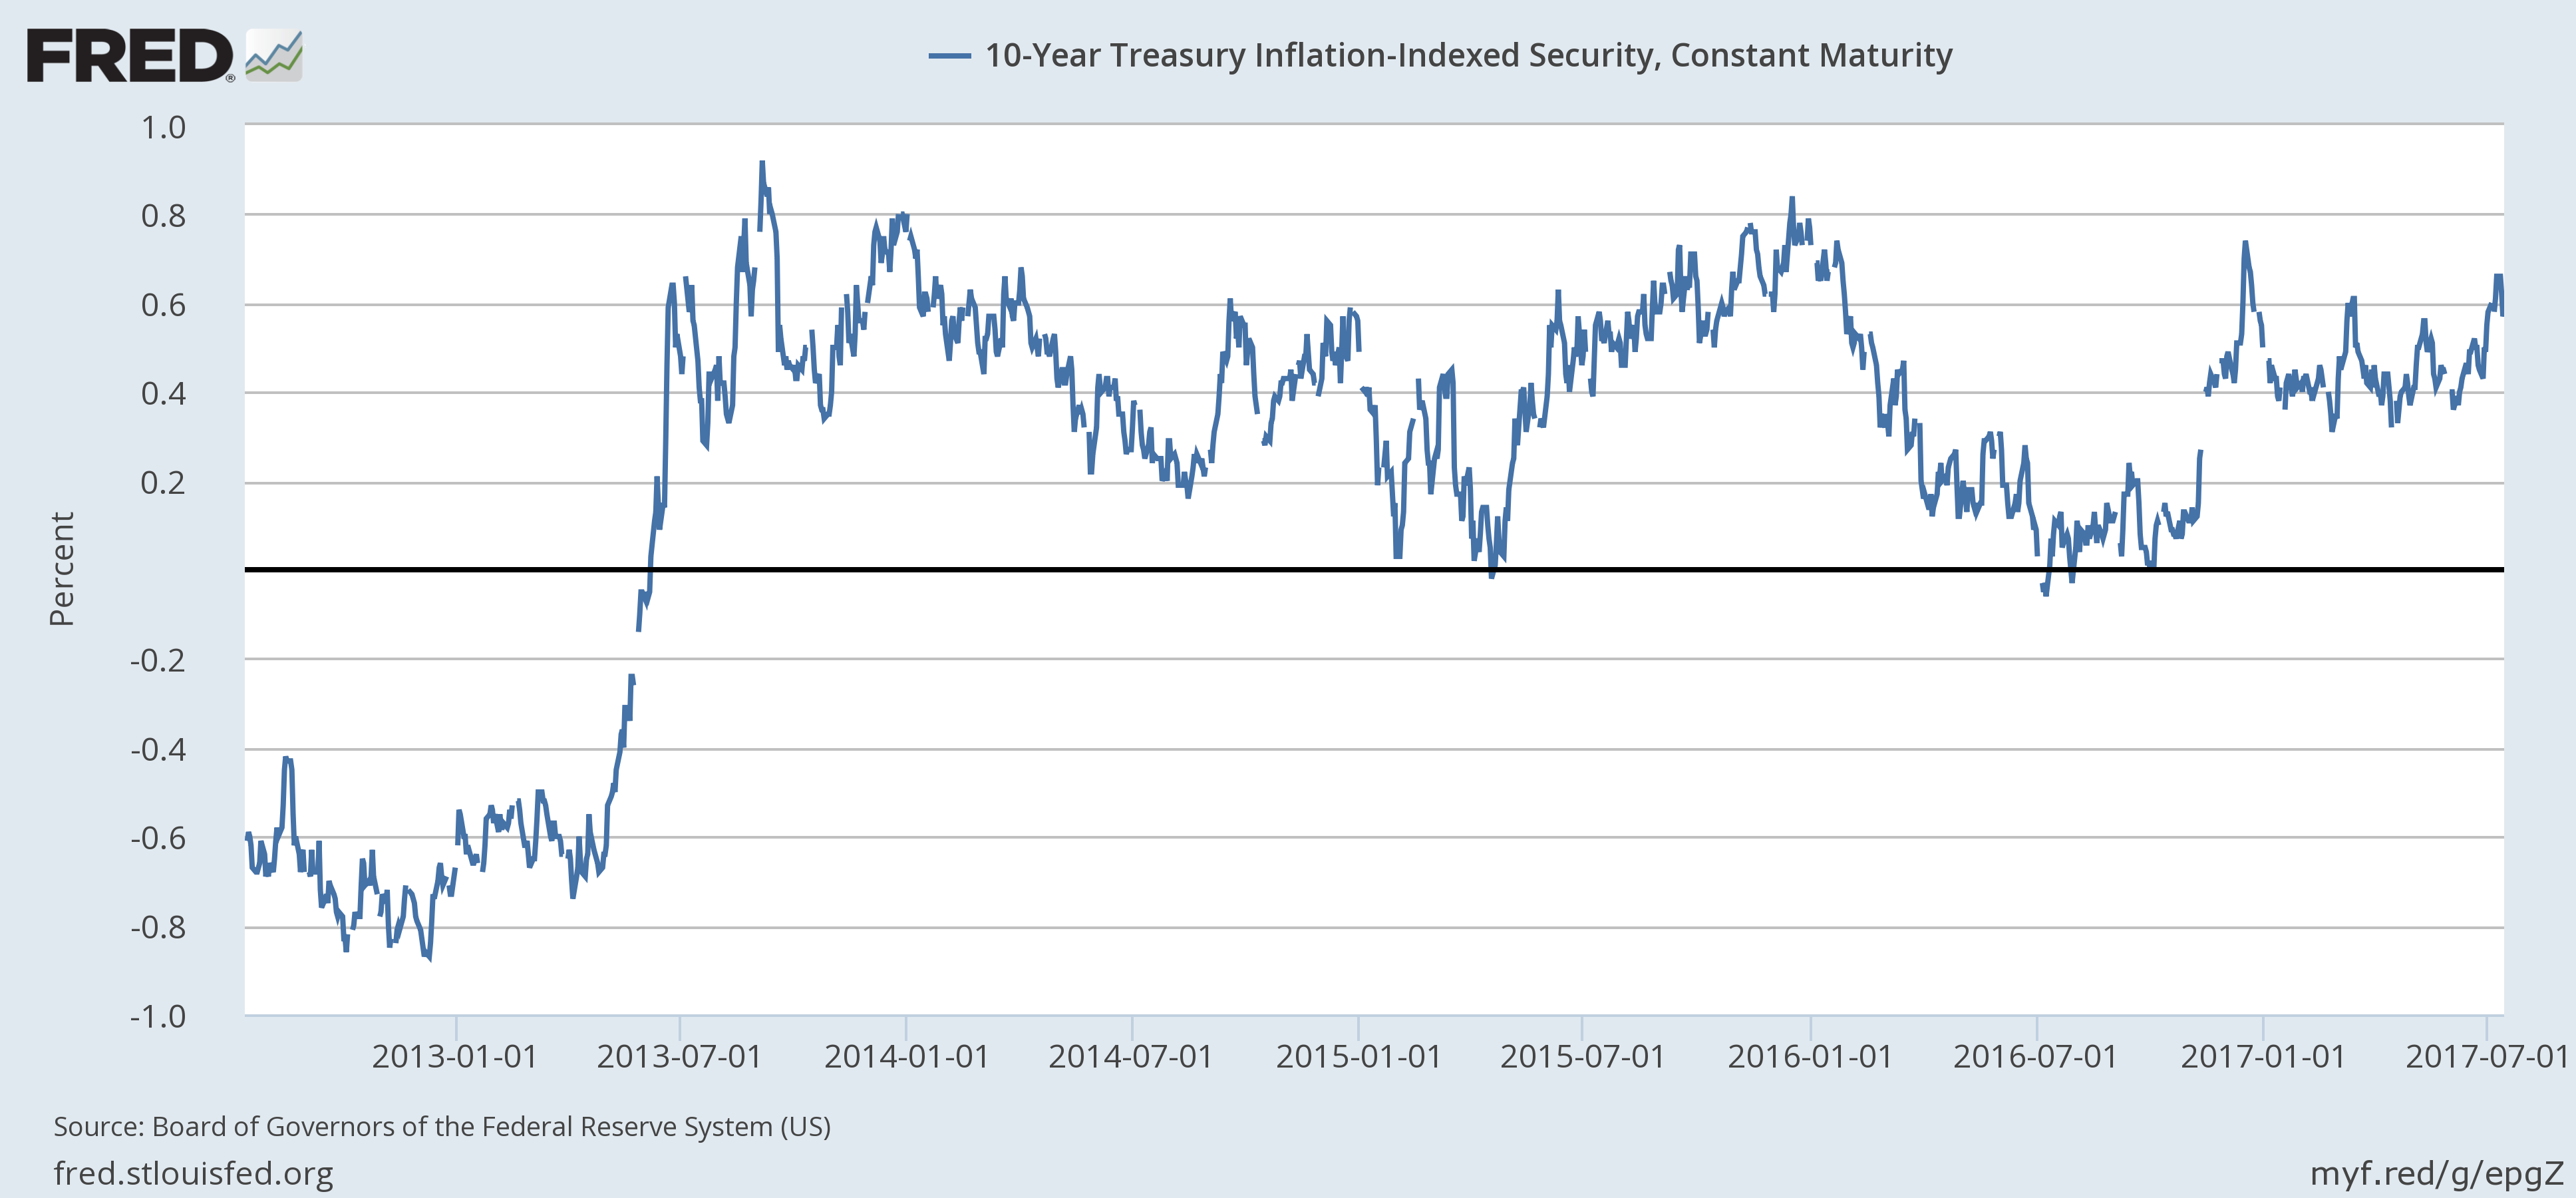
| As noted above, the 10 year Treasury yield was up slightly but TIPS yields were unchanged. Considering the weak data that is probably as good as can be expected: |
US 10 Year Treasury Inflation-Indexed Security, Jan 2012 - Jul 2017(see more posts on U.S. Treasury, ) |
| Credit spreads were also unchanged since the last update but are near the lows for this cycle. They can certainly narrow more but not by much; this is about as good as it gets with this indicator. |
US High Yield Option-Adjusted Spread, 2000 - 2017 |
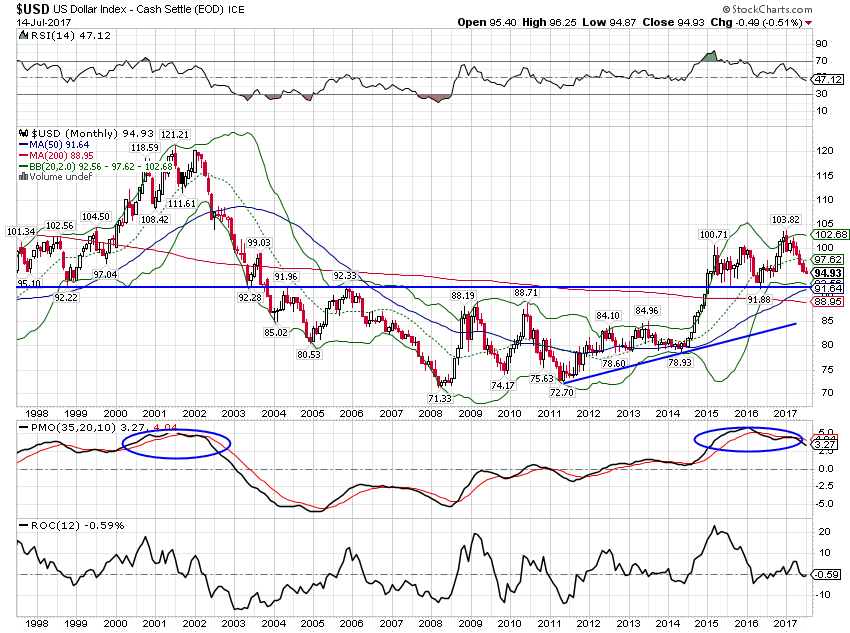
| The dollar has been in a steady downtrend all year, something that hasn’t surprised us but apparently did most everyone else. The market was overwhelmingly long dollars coming into the year and it has done nothing but buck the consensus all year. Now, however, the buck is approaching support and positioning has shifted. Speculators are now net long Euros, a position not seen in some time. Dollar bears are much more prominent and I’m getting less enthusiastic about the weak dollar positioning of our portfolios. I’m not sprouting horns yet but at least the initial phase of dollar weakness may be nearing an end. Whether that will be due to an acceleration of the US economy or a deceleration of the rest of the world is something I can’t predict but I have never been a fan of decoupling. |
US Dollar Index, Monthly, 1998 - 2017(see more posts on U.S. Dollar Index, ) |
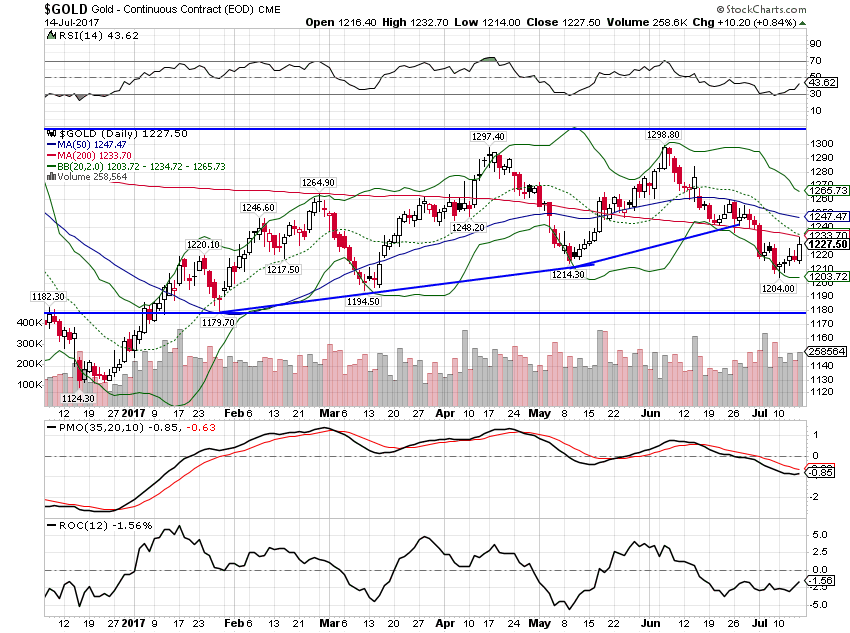
| The weak dollar still isn’t helping gold much although the recent downtrend seems to have been arrested. Gold has been trapped in a trading range all year which would seem to confirm our belief that the US economy is stuck in the status quo. |
Gold, Daily, Dec 2016 - July 2017(see more posts on Gold, ) |
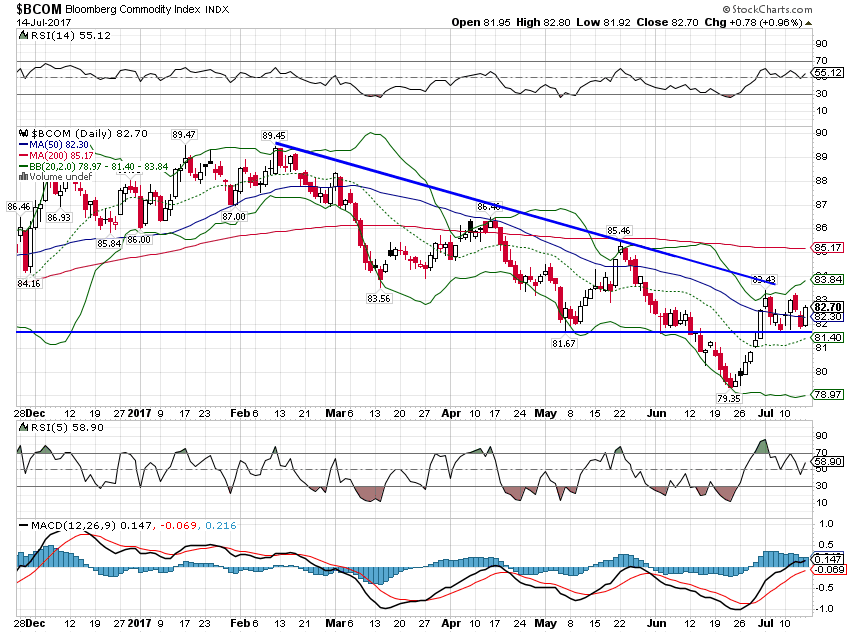
| A weak dollar hasn’t been much help to commodities more generally either. The Bloomberg Commodity index was basically unchanged since the last update. Global growth may be picking up but it isn’t reflected in commodity prices just yet: |
Bloomberg Commodity Index, Dec 2016 - Jul 2017 |
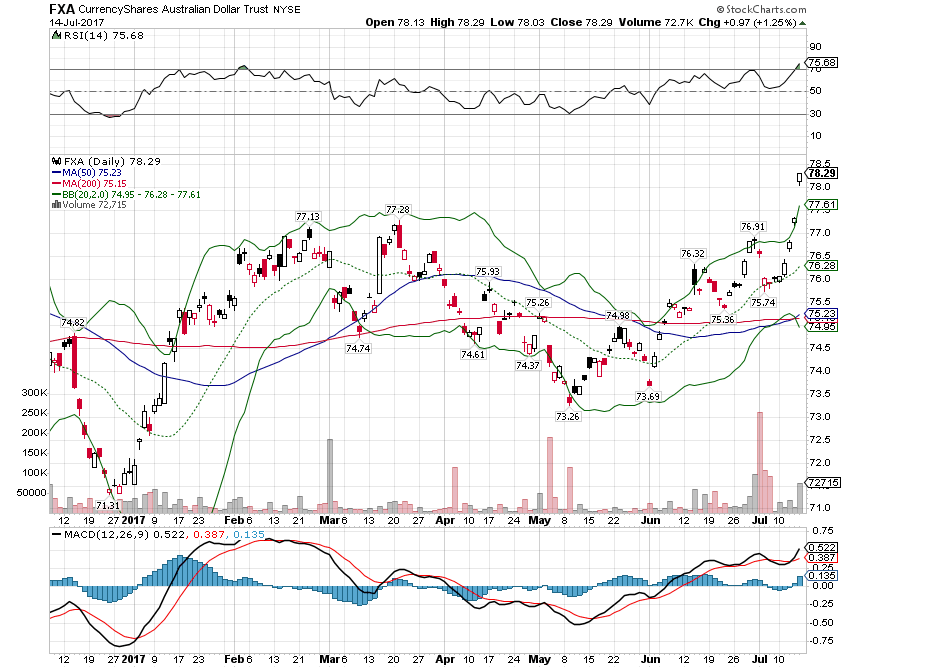
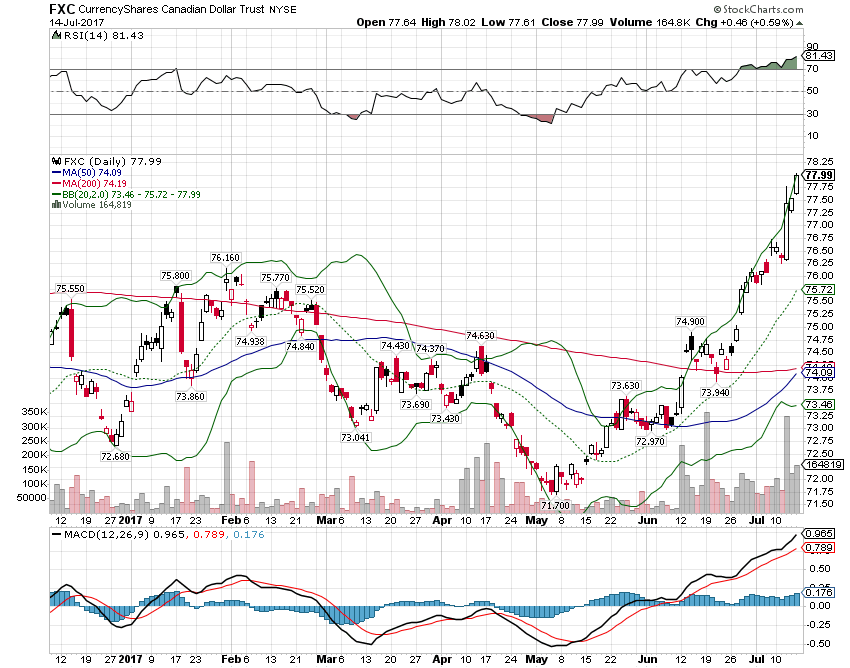
| Having said that, it is interesting that both the Canadian and Aussie dollars recently broke out against the US version. These currencies have in the past been leading indicators for commodities. Canada hiked rates last week which obviously pushed the currency higher but it was just the strongest of a long list of currencies rallying against the greenback. |
Australian Dollar, Dec 2016 - Jul 2017(see more posts on Australian Dollar, ) |
| The economic data has been lousy recently but the markets seem to be looking past that and toward improved global growth. The rest of the world certainly is due for an upturn if for no other reason than cyclicality. And that may indeed have a positive impact on US growth but right now the data is actually pointing to a peak in the mini cycle upturn that started last summer. For now, I see no reason to expect a recession imminently but neither do I see any reason to expect an acceleration in US growth.
It has never been wise to bet against the US consumer but I wonder if we might finally have reached peak consumption. Younger generations certainly don’t seem interested in the conspicuous consumption of their elders. And it may be dawning on Baby Boomers – finally – that if they ever want to retire they are going to have to save more and consume less. Another thing I’ve noticed recently is that the quality of goods seems to have slipped considerably over the last few years. I find clothing in particular to be of very poor quality but I could say the same about a lot of other items as well. Even restaurant quality seems to have slipped especially at the big chains that all seem to be serving the same bland items. Maybe that has finally caught up with retailers as consumers balk at paying up to maintain an illusion of prosperity. Consumption is the result of growth not the cause and it shouldn’t be a surprise after all these years of weak growth that consumption is weak too. Especially when one considers the debt piled up to pay for much of our previous consumption. Our market indicators seem to be saying that growth in the rest of the world will be sufficient to maintain our current secular stagnation, new normal rate of growth. Maybe but that has never been the case in the past; the US is the dog that wags the tail of the global economy. Is it different this time? |
Canadian Dollar, Dec 2016 - Jul 2017(see more posts on Canadian Dollar, ) |
Tags: Alhambra Research,Australia,Australian Dollar,Bi-Weekly Economic Review,Bonds,Canada,Canadian Dollar,commodities,consumption,credit spreads,currencies,Donald Trump,economic growth,economy,employment,Gold,Interest rates,Investing,Markets,newslettersent,Retail sales,TIPS,treasuries,U.S. Dollar Index,U.S. Treasury,US dollar,US Dollar Index,Yield Curve


