Joseph Y. Calhoun
My articles My siteAbout meMy videosMy books
Follow on:LinkedINTwitterSeeking AlphaAmazon
| There is no change to the risk budget this month. For the moderate risk investor, the allocation between risk assets and bonds is unchanged at 50/50. There are no changes to the portfolio this month.
Growth and inflation expectations rose somewhat since last month’s update. The change is minor though and within the range of what we’ve seen in recent months. The most significant change from last month is the continued drop in the US Dollar as growth expectations for the rest of the world continue to outpace US expectations. The dollar has lost considerable luster since the beginning of this year when everyone thought it had nowhere to go but up. Absent some kind of legislative win from the Trump administration, I see no reason to think the trend is about to reverse although sentiment is getting a mite negative on the greenback.
|
Moderate Allocation - Click to enlarge |
| The weak dollar is mostly having the impact on markets one would expect. International stock markets are outperforming which is nice since our portfolio is positioned to benefit from just such a trend. Gold and other commodities haven’t responded as positively but gold is at least up over the last six months. Commodities more generally are down on the year, mostly a reflection of the drop in crude prices. If the dollar keeps falling I would expect commodity performance to improve. Real estate, another real asset sensitive to dollar movements, is performing well both domestically and internationally.
But the real winners are stocks of all kinds with international markets leading the way. In my listing of single country ETFs the S&P 500 doesn’t break into the top 20 best performing markets in the 1,3,6 or 12 month rankings. |
Select Countries, 6 months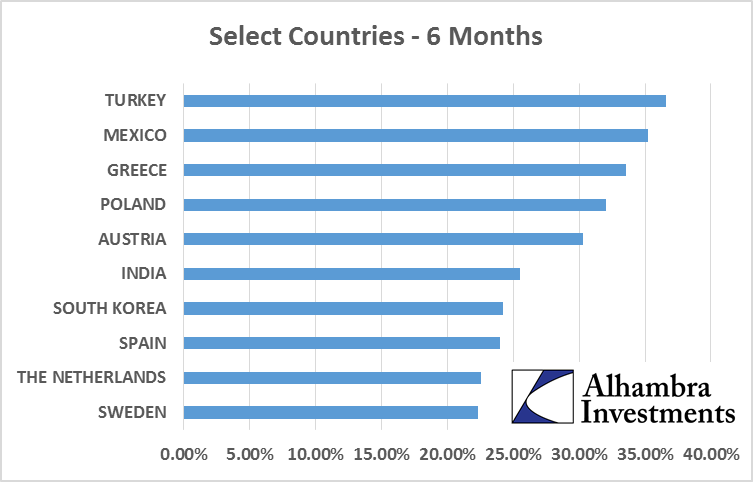 - Click to enlarge |
| The dollar’s decline accelerated after Mario Draghi’s remarks last week and weak economic reports from the US. The dollar is being driven by the change in relative growth expectations between the US and the rest of the world. It is also being driven by expected changes in monetary policy with the Fed seemingly a bit more dovish and the ECB a bit more hawkish. One shouldn’t minimize either the impact of the current administration’s obvious desire for a cheaper currency. President Trump has said so explicitly while his Treasury Secretary has hinted, smirked and winked. As I’ve often said, Presidents usually get the dollar they want. |
US Dollar Index, Daily Oct 2016 - Jul 2017(see more posts on U.S. Dollar Index, )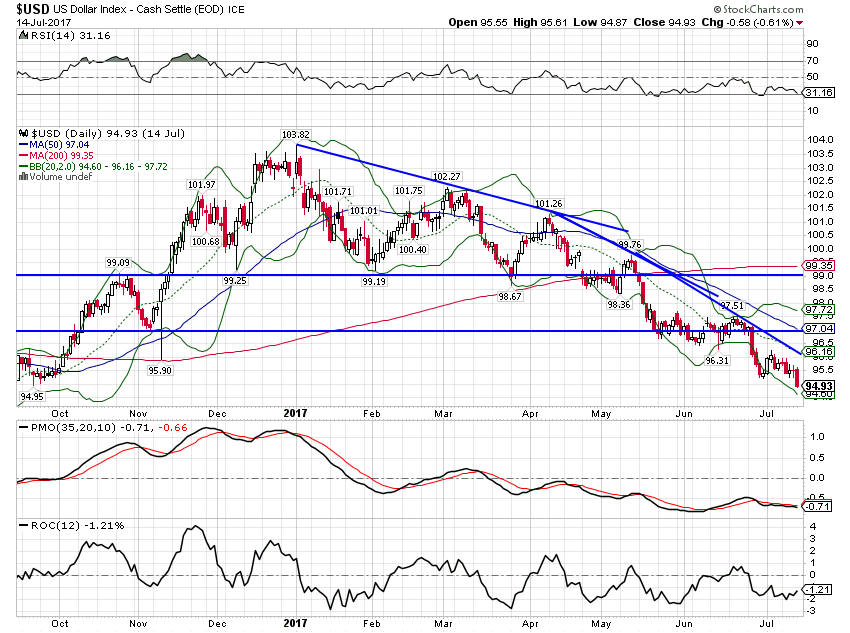 - Click to enlarge |
| With the slight rise in interest rates since the last update, the interest sensitive assets that were leading fell back over the last month. Commodities actually led the pack over the last month, rebounding from recent lows. They are however, as noted above, still down on the year. |
Momentum Allocation Returns, 1 month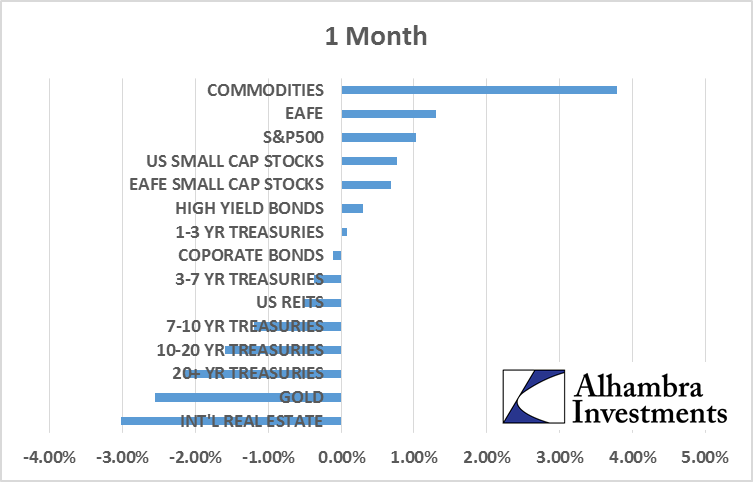 - Click to enlarge |
| Over the last three months commodities and gold are both down while stocks dominate the top of the list. It is also interesting to find long term Treasuries with a positive return over the last quarter. That is the return of Greenspan’s conundrum as Fed hikes have not had the intended effect on the long end of the curve. Frankly, if monetary policy is about balancing supply and demand of dollars – and that’s what it should be in my opinion – then the Fed’s recent actions look a lot like an easing. It seems pretty obvious that dollar supply is outstripping dollar demand at this point with the result being a drop in price. Of course, it isn’t quite that simple in a world of floating currencies – is the dollar really “down” if gold and commodities are falling too? – but it is hard to see what’s going on presently as much of a tightening of conditions. |
Momentum Allocation Returns, 3 month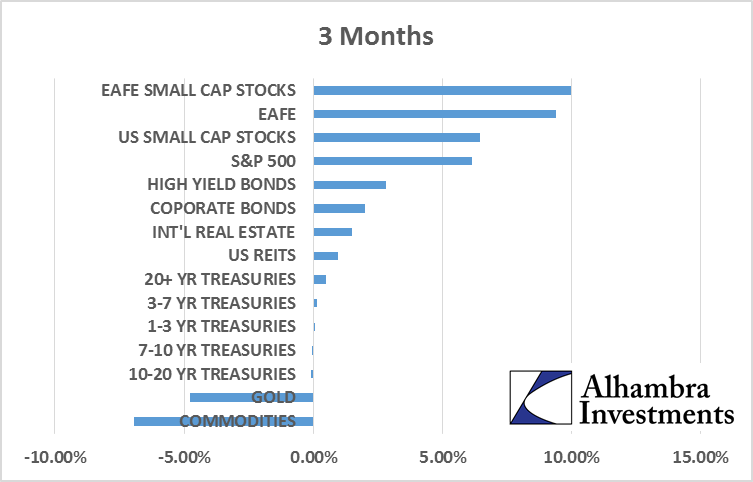 - Click to enlarge |
| I am concerned too that our negative view of the dollar is becoming more mainstream now. At the beginning of the year futures markets were positioned very long the dollar and it was pretty easy to take the other side of the trade. Now, though, speculators have flipped to net long Euros and the dollar index. In other words, our contrarian position is turning into a consensus one. Of course, the consensus can be right for a while and this isn’t at an extreme yet but it certainly bears watching. I am not ready to shift our portfolio based on the potential for a dollar rally – yet. Technically the dollar index is nearing support and a bounce seems likely. Of course, I’ve said that several times in the last couple of months and it hasn’t happened yet.
Our major indicators for asset allocation, as I said at the top, showed a minor improvement in growth expectations. None of the changes were sufficient to warrant an allocation change. I just published a Bi-Weekly Economic Review yesterday so for more information on credit spreads, the yield curve and the other macro-economic factors we watch, just follow the link above. |
US Dollar Index, Monthly, 1998 - 2017(see more posts on U.S. Dollar Index, )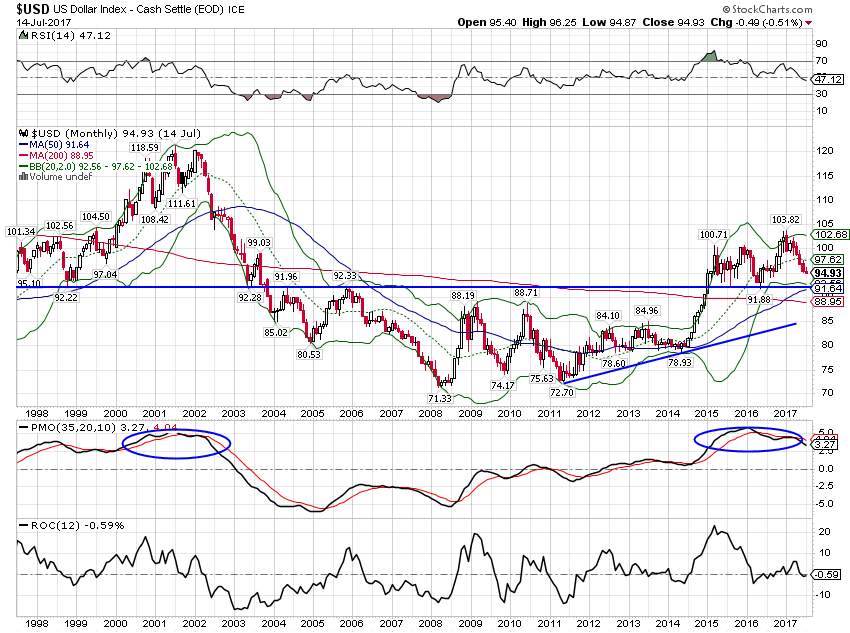 - Click to enlarge |
Yield CurveThe yield curve steepened slightly and is nowhere near flat or inverted that we normally see prior to recession. As I’ve said many times though, I have no idea if the curve will actually invert prior to the next recession with short term rates so low. I do have my doubts the Fed will be able to raise rates very many more times. |
US 10 Year Treasury Constant Maturity minus 2 Year Treasury, 1990 - 2017(see more posts on U.S. Treasury, )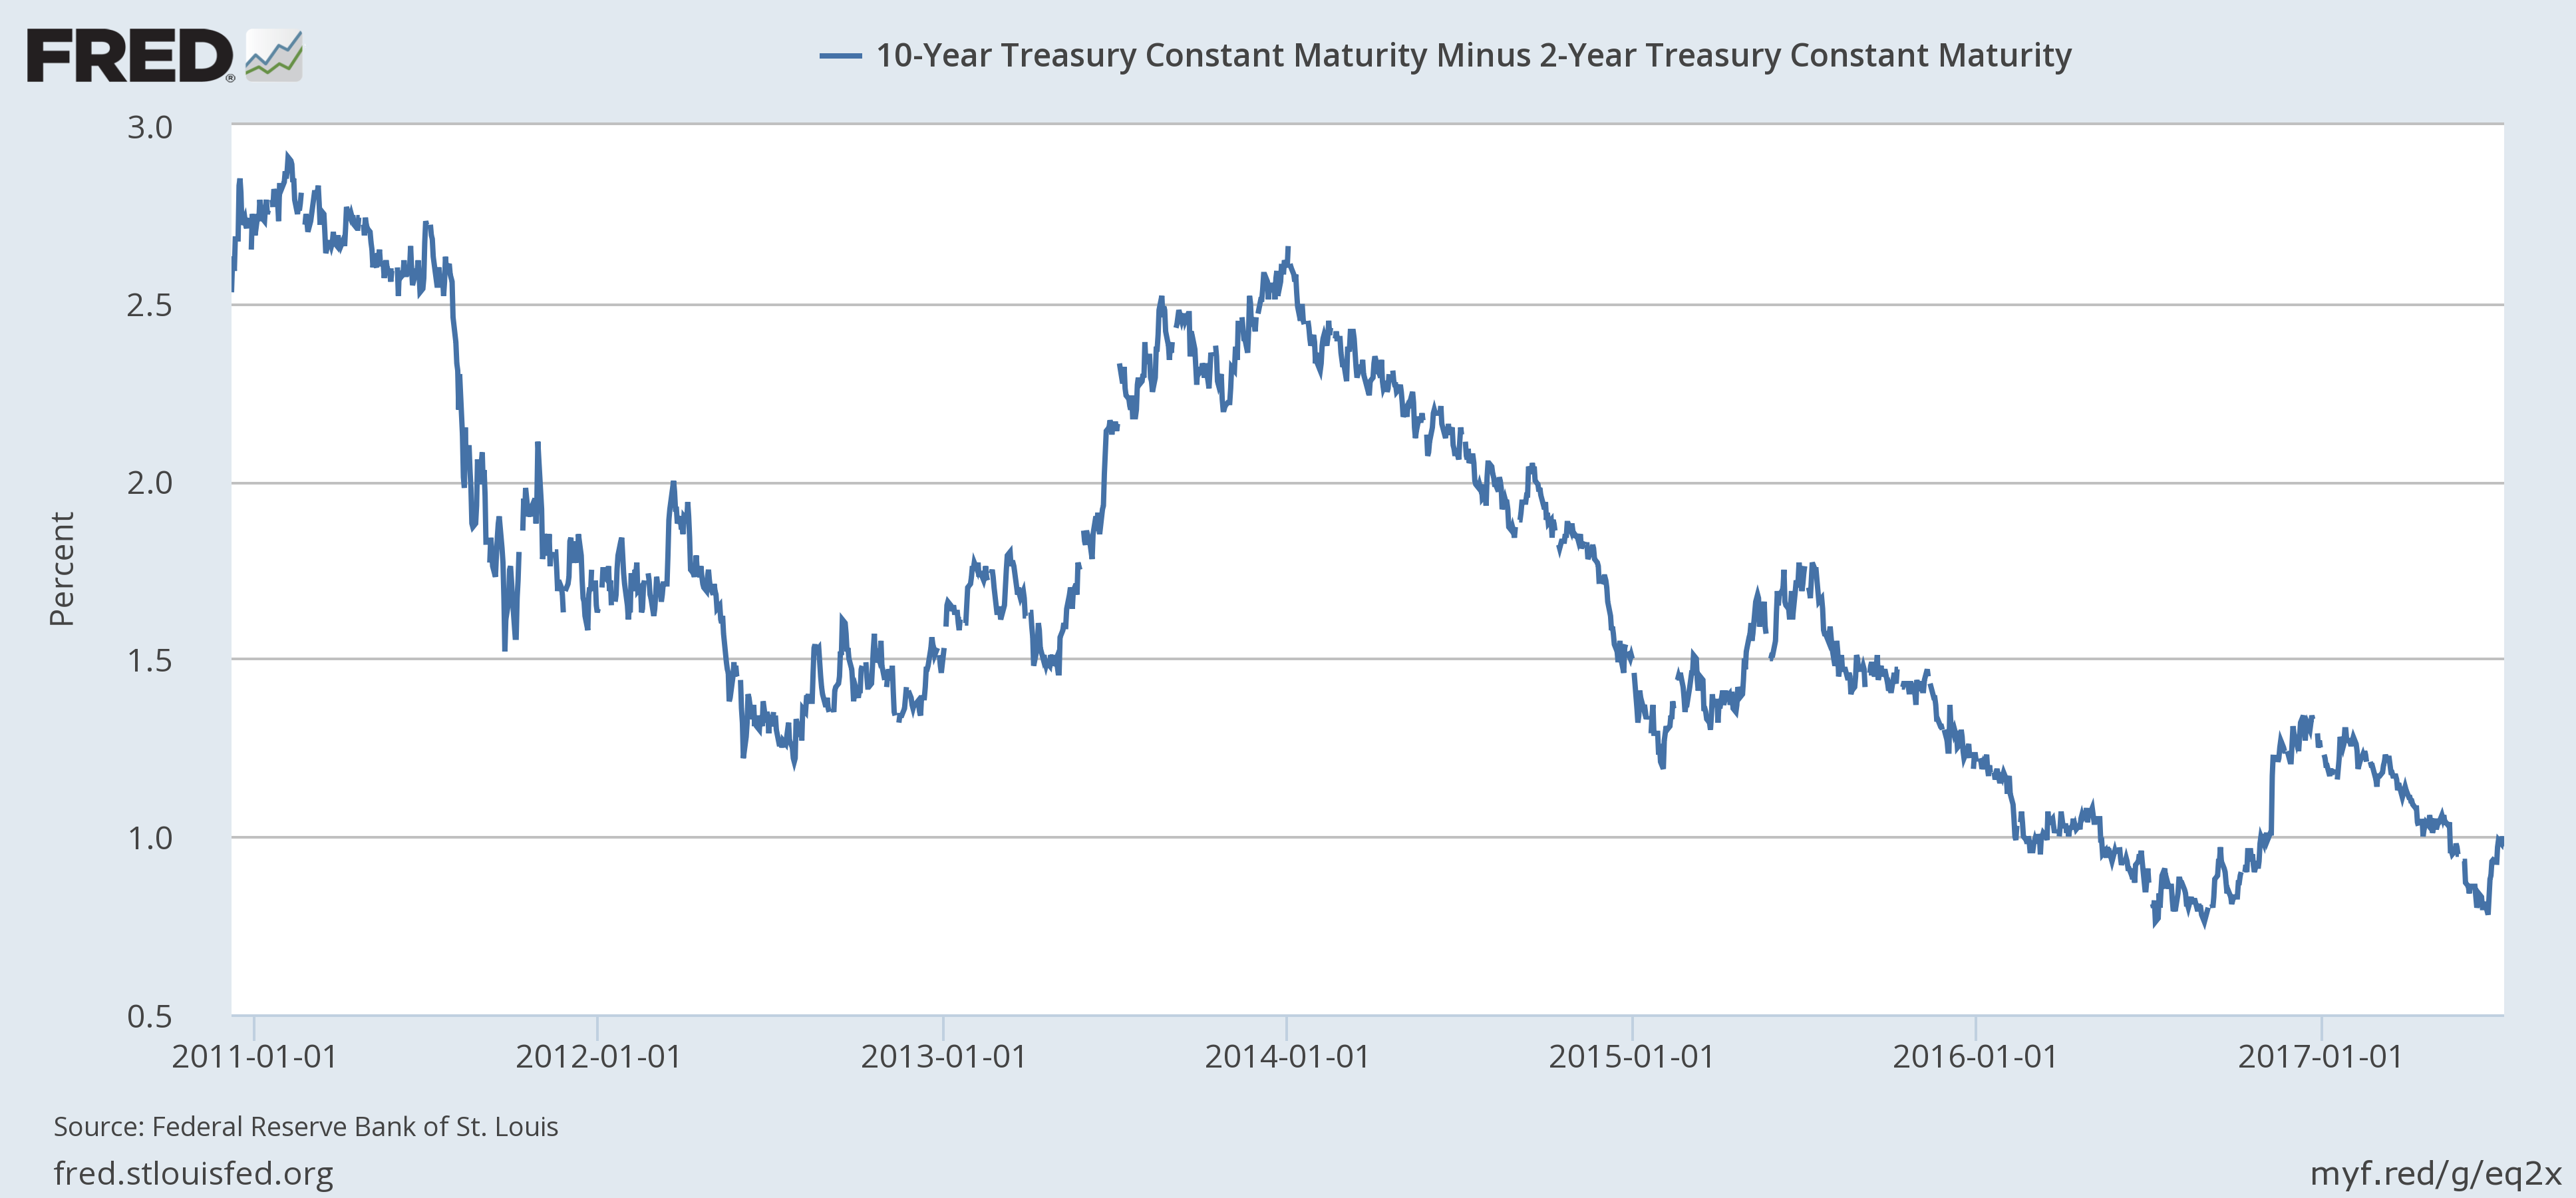 - Click to enlarge |
Credit SpreadsCredit spreads were essentially unchanged over the last month. It does seem that it will be hard for spreads to narrow much from here but they aren’t widening either. |
BofA Merril Lynch US High Yield Option-Adjusted Spread, 2012 - 2017 - Click to enlarge |
ValuationsUS stock are still about the most expensive in the world no matter how you measure it. If one uses Shiller P/E the US sits at 28 which has only ever been exceeded by the dot com bubble in the late 90s. For comparison purposes, developed Europe is at 22.9 (which isn’t exactly a bargain either), emerging markets are at 14.5, emerging Europe at 8.3 and emerging Asia at 17.1. If you don’t like those we can use Price/Sales ratios where the US just hit 2 while developed Europe is about half that at 1.1 and EM is at 1.3. Don’t like that one either? How about dividend yield with the US at 1.9%, developed Europe at 3.1% and EM at 3%. Price/Book value? US at 3.1, Europe at 1.8 and EM at 1.7. What the heck, you want to use forward P/Es? Okay US at 17.8, Europe 14.3, EM 12.1. As I said, however you want to look at it, US stocks are more expensive than the alternatives. And oh by the way, you can’t even say we’re the cleanest shirt in the dirty laundry anymore. Growth is picking up in the rest of the world and we’re either stagnant or slowing, take your pick. And our politics is just as much a mess as the rest of the world, maybe more. |
EFA vs SPY, Jan 2017 - Jul 2017(see more posts on SPY, )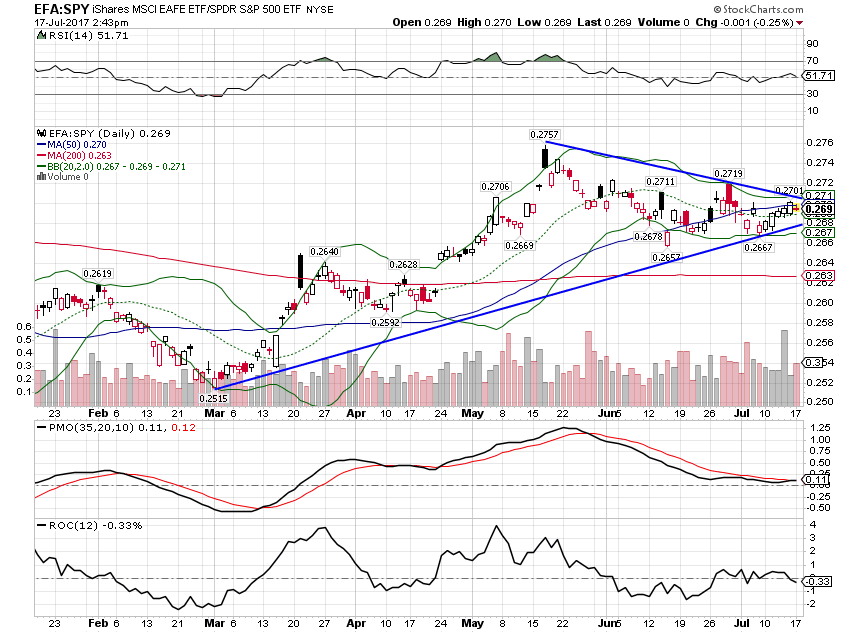 - Click to enlarge |
MomentumLike I said, momentum favors international markets with the dollar falling. I would also note that it isn’t just the Euro that is going up against the US dollar. Emerging market currencies are also rising and the Canadian and Aussie dollars just broke out to the upside last week as Canada hiked rates. The Aussie and Canadian $s have in the past led commodities higher. EFA and SPY performed about the same over the last month but long term momentum still favors EFA. |
EFA vs SPY, Monthly 2005 - 2017(see more posts on SPY, )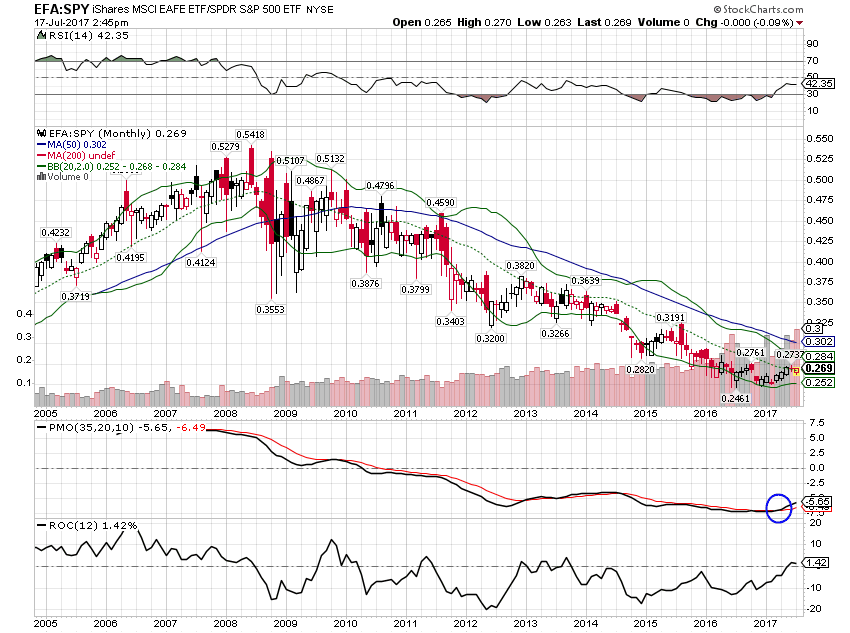 - Click to enlarge |
| EEM maintained momentum versus SPY even over the last month. Long term still favors EEM and indeed EEM is itself challenging the high from a decade ago. |
EEM vs SPY, Dec 2016 - Jul 2017(see more posts on SPY, )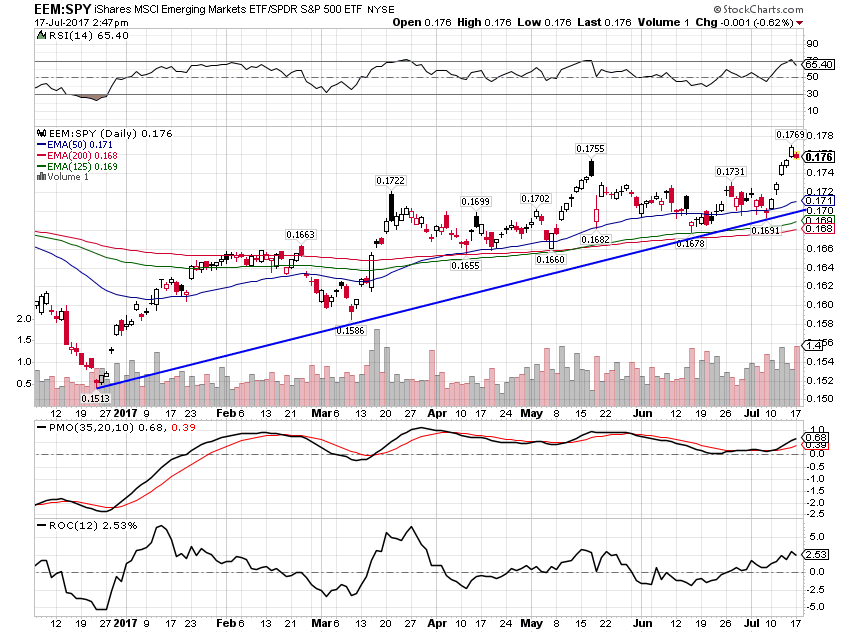 - Click to enlarge |
EEM, Monthly 2005 - 2017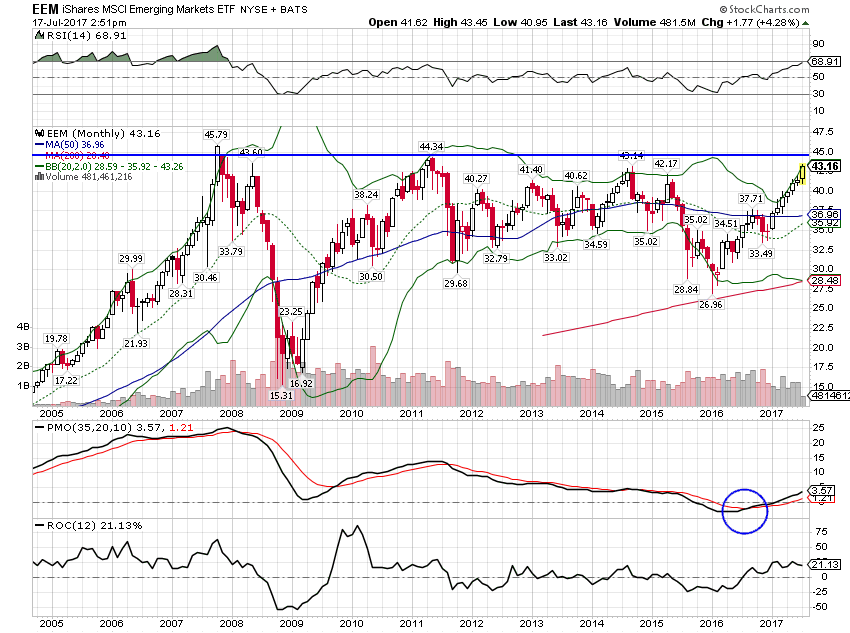 - Click to enlarge |
|
| The momentum shift in real estate is not as clear cut as in regular stocks but international is trying to break the downtrend against IYR. |
RWX vs IYR, Monthly 2007 - 2017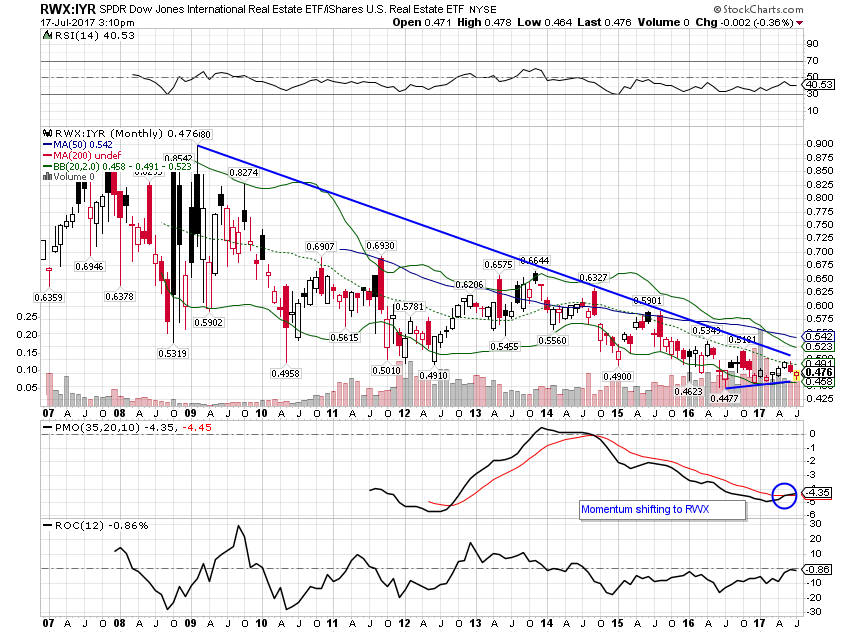 - Click to enlarge |
| Finally, within commodities, momentum is starting to shift from gold to more general commodities. Monthly momentum already favors DBC over IAU. |
IAU vs DBC, Monthly Dec 2016 - Jul 2017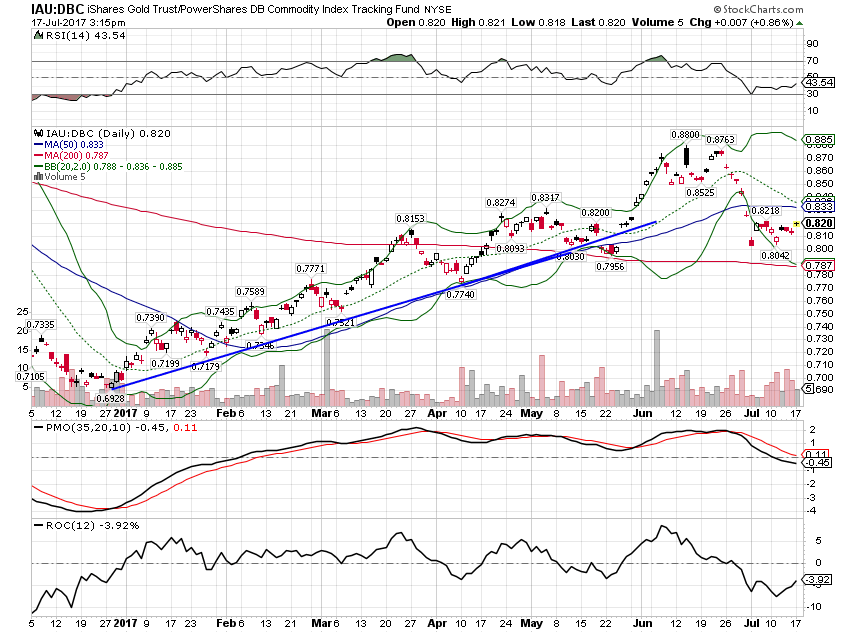 - Click to enlarge |
| In the past this kind of shift has been associated with better growth expectations. In particular the copper/gold ratio turning higher is an indication of rising growth expectations. It is highly correlated with the 10 year Treasury yield and moved up with yields recently. The question I wrote on the chart below late last month has obviously been answered. Now we’re seeing bond yields pull back some. Will copper/gold follow? Or will bond yields resume their climb?
As I said at the top, I’m not making any changes this month but I would just note a couple of items that I considered but didn’t act on. First is the breakout of the Canadian and Aussie dollars and the implications for equities in those countries. I considered buying EWC and/or EWA to benefit from stronger currencies there but in the end I decided against it. These markets and economies are heavily influenced by commodity prices and we already have a direct commodity exposure. We also own GNR in the portfolio, a Global Natural Resources ETF. Australia and Canada are well represented in the fund, both over 10% of the total. Second, is the outperformance of Asian stocks (AAXJ) relative to EFA and SPY and the recent underperformance of Japan (EWJ). While AAXJ does offer greater diversification than the Japan ETF its largest position is China at over 35% of the portfolio. We are concerned about China here at Alhambra for a variety of reasons, most of them to do with debt. Obviously, if China has a problem so will Japan (through the banking system most likely) but at least it will remain liquid. We’re not so sure about China. The outperformance of Asia is interesting though but we aren’t comfortable including China in our potential exposure. And frankly, we weren’t sure how to fit it in the equity portion of our portfolio. Our US exposure is already minimal and reducing it more seemed too extreme. |
Copper and Gold Continuous Contract, Dec 2016 - Jul 2017(see more posts on Copper, Gold, )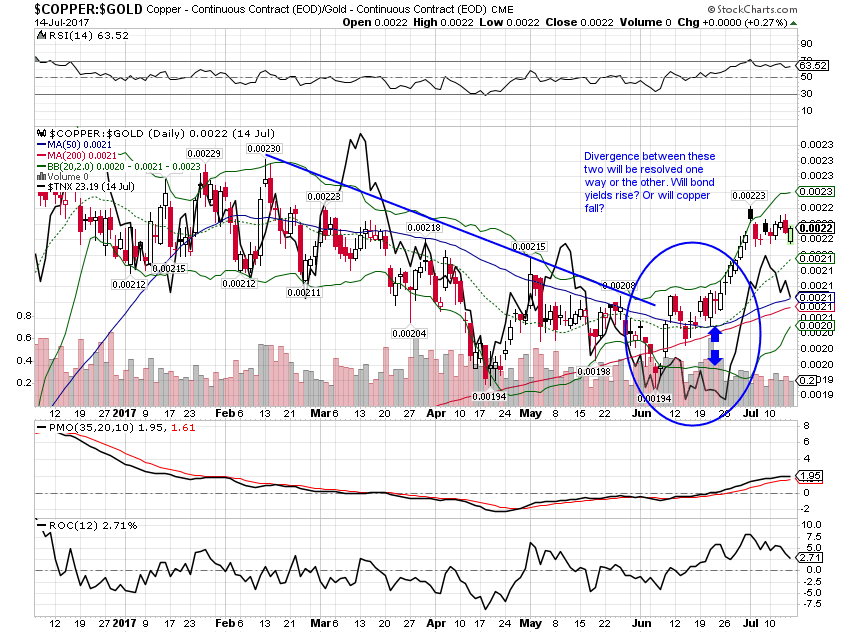 - Click to enlarge |
I have become very comfortable with our current portfolio and that is probably not a good sign but I don’t make changes just to make changes. If the dollar trend changes, I’ll have to make some adjustments but not yet. If the US economy slows further, I may have to make some changes, but not yet. If credit spreads start to move wider, I may have to make some changes but not yet. The answer to the question What should I do with my portfolio today? is usually nothing. And that’s my answer today as well.
Tags: Alhambra Research,Asset allocation,Bonds,commodities,Copper,credit spreads,currencies,Donald Trump,eafe,Emerging Markets,Global Asset Allocation Update,Gold,Investing,Mario Draghi,Market Sentiment,Markets,momentum,newslettersent,Real Estate,REITs,SPY,Stock markets,stocks,U.S. Dollar Index,U.S. Treasury,US dollar,valuations,Yield Curve