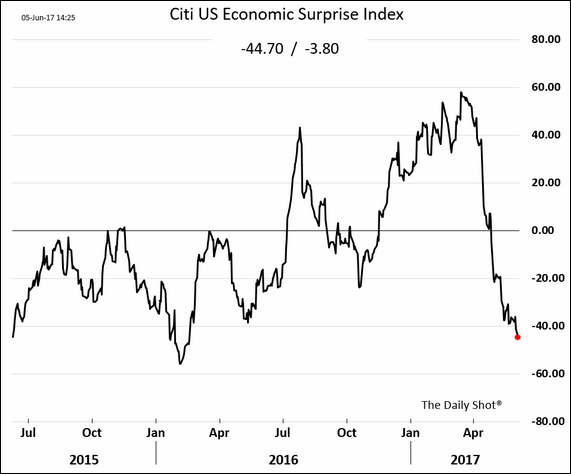
| The economic reports released since the last of these updates was generally not all that bad but the reports considered more important were disappointing. And it should be noted that economic reports lately have generally been worse than expected which, if you believe the market to be fairly efficient, is what really matters. The disappointing employment report and the generally less than expected tone of the reports continued to move our market indicators in a negative fashion.
It feels like years that I’ve been saying that not much has changed with the US economy (or the global economy for that matter but that is changing a bit). That’s because it has been years since I’ve been saying that and I’m about to say it again. You can call it the New Normal like Bill Gross and Mohamed El-Erian did or you can call it Secular Stagnation as Larry Summers has. Or you can call it Depression like our Jeff Snider does – but you have to be careful with that one since that term evokes images of soup lines and sad faces. I call it Economic Ennui but you can make up your own alliterative term for this economic expansion that goes on and on but in a less than energetic fashion. The Chicago Fed National Activity index, a weighted average of 85 monthly economic indicators and a decent gauge of overall economic activity was 0.49 in the latest release which means the economy is growing slightly above trend. Of course, that isn’t saying much but at least it is a positive number and not a negative one. As you’ll see a little lower down, the bond market doesn’t seem to think that upturn will last but the bond market could be wrong I suppose. The CFNAI isn’t heralding great growth ahead but neither is it forecasting recession anytime soon. As Stealer’s Wheel said once upon a time, here I am stuck in the middle with you. As usual, there were some pretty good reports and some pretty bad reports. On the good side of the ledger was the Personal Income and Spending report which is pretty punk compared to previous expansions but pretty solid for this one. Income is up about 3.6% yoy and spending is up about 4.4% yoy. Yeah, that might not be sustainable and we are starting to see some stress in personal credit. Some of the credit card companies are starting to reserve more for losses and lending is slowing for all kinds of loans. We’ll see how long that takes to really bite the economy but it doesn’t seem to be hurting too bad right now. The Challenger Job Cut Report did report a big jump in layoffs though and if that continues, then Houston we might have a problem. Those layoffs, by the way, were led by Ford so the auto sales slowdown is starting to bite. Manufacturing is still having problems with Durable Goods Orders down across the board. With aircraft, without aircraft didn’t seem to matter with negative numbers everywhere. Not big negative numbers mind you, but negative nonetheless. Last month was revised higher for a little offset to the latest numbers. Capital goods orders were flat, the capital spending surge still waiting in the wings. On the negative side was just about anything real estate related. New home sales, existing home sales, pending home sales and construction spending were all down in the most recent monthly reports. New home sales are still in an uptrend but it is two steps forward and one and half back progress. And construction spending is still up almost 7% year over year so it isn’t terrible. That year over year number is falling though so we need to see some good numbers in the coming months. And of course the big negative and the one that moved the bond market the most was the employment report. The ADP version was much better than expected but the official one missed by a lot and didn’t have much good news in the details. To add insult to injury, last month’s better than expected number was completely revised away. The unemployment rate did fall to 4.3% but that was due to another drop in the participation rate to 62.7%. The Fed’s concern about full employment and the potential impact on inflation is likely misplaced as average hourly earnings were up a mere 0.2% and last month’s hopeful 0.3% gain lost a tenth in revision. And the workweek remains a doleful 34.4 hours. |
U.S. Economic Surprise Index, July 2015 - June 2017 |
| Bond markets seemed to concentrate more on the negative reports. Stock buyers concentrated on….well, I’m not exactly sure what stock buyers are smoking. I guess the idea that the Fed may be forced to back off a rate hike or so was enough to send stocks to new highs. I guess that is reasonable assuming the economy avoids recession and while growth may be slow it doesn’t appear ready to shift into reverse just yet. At least not according to the market indicators we use that have worked so well for so long.
The yield curve continued to flatten with the 10/2 curve down another 8 basis points since the last update. All of that came out of the long end with the 2 year note yield unchanged.
|
10-Year Treasury Constant Maturity Minus 2-Year Treasury Constant Maturity, 1990 - 2017 |
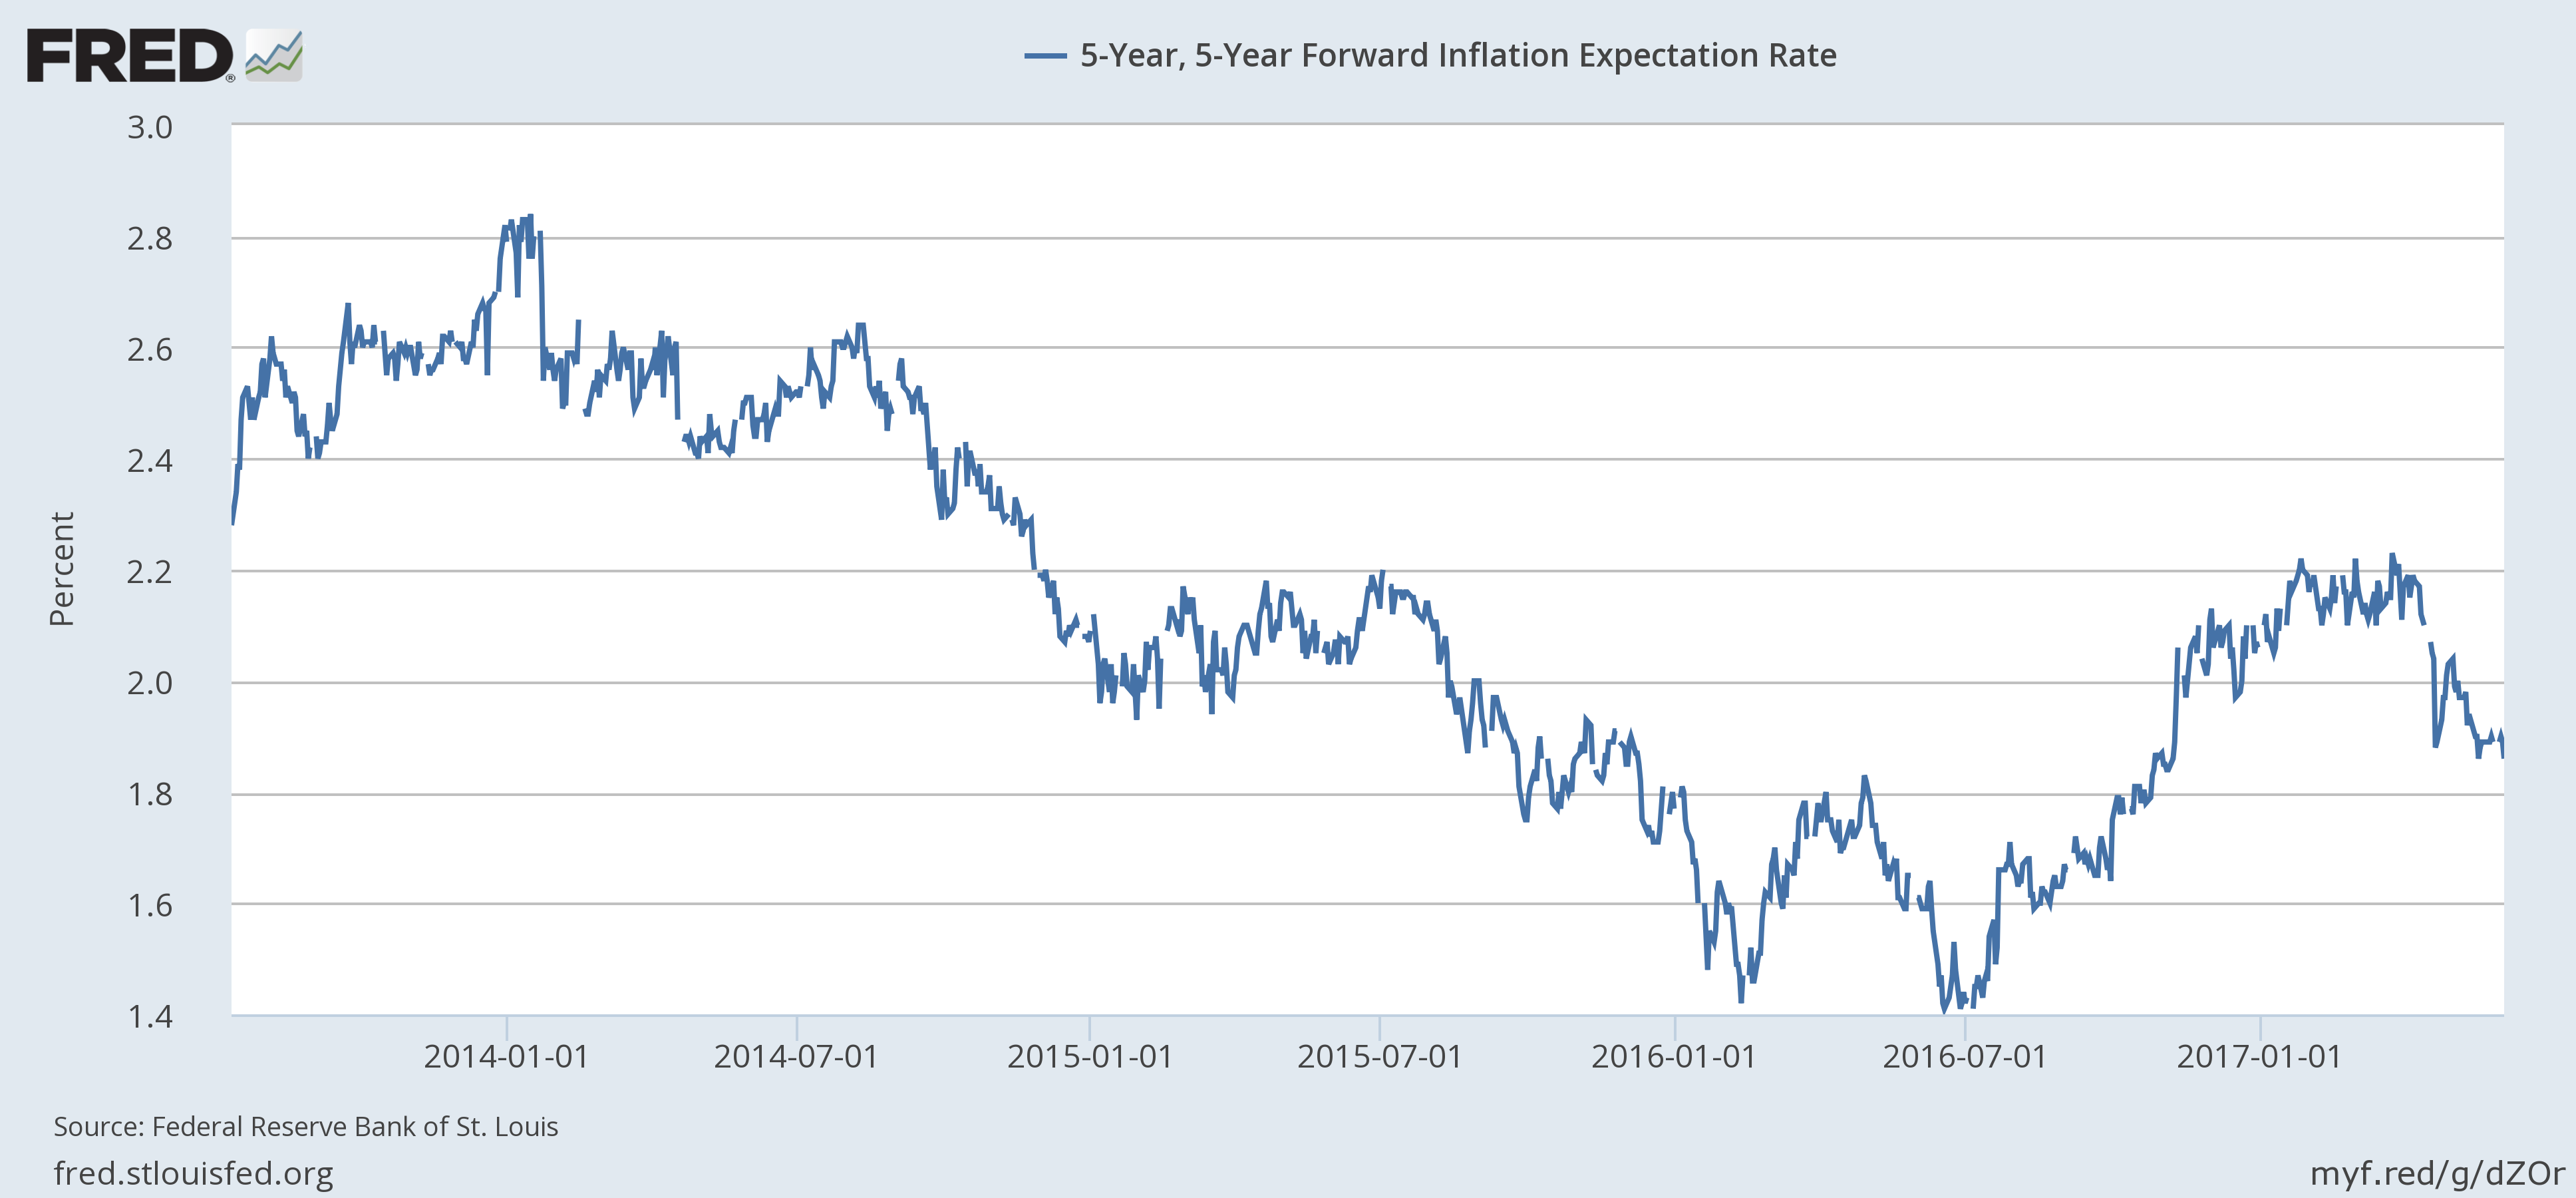
| Inflation expectations were down just slightly, 3 basis points. |
5-Year Forward Inflation Expectation Rate, January 2014 - June 2017 |
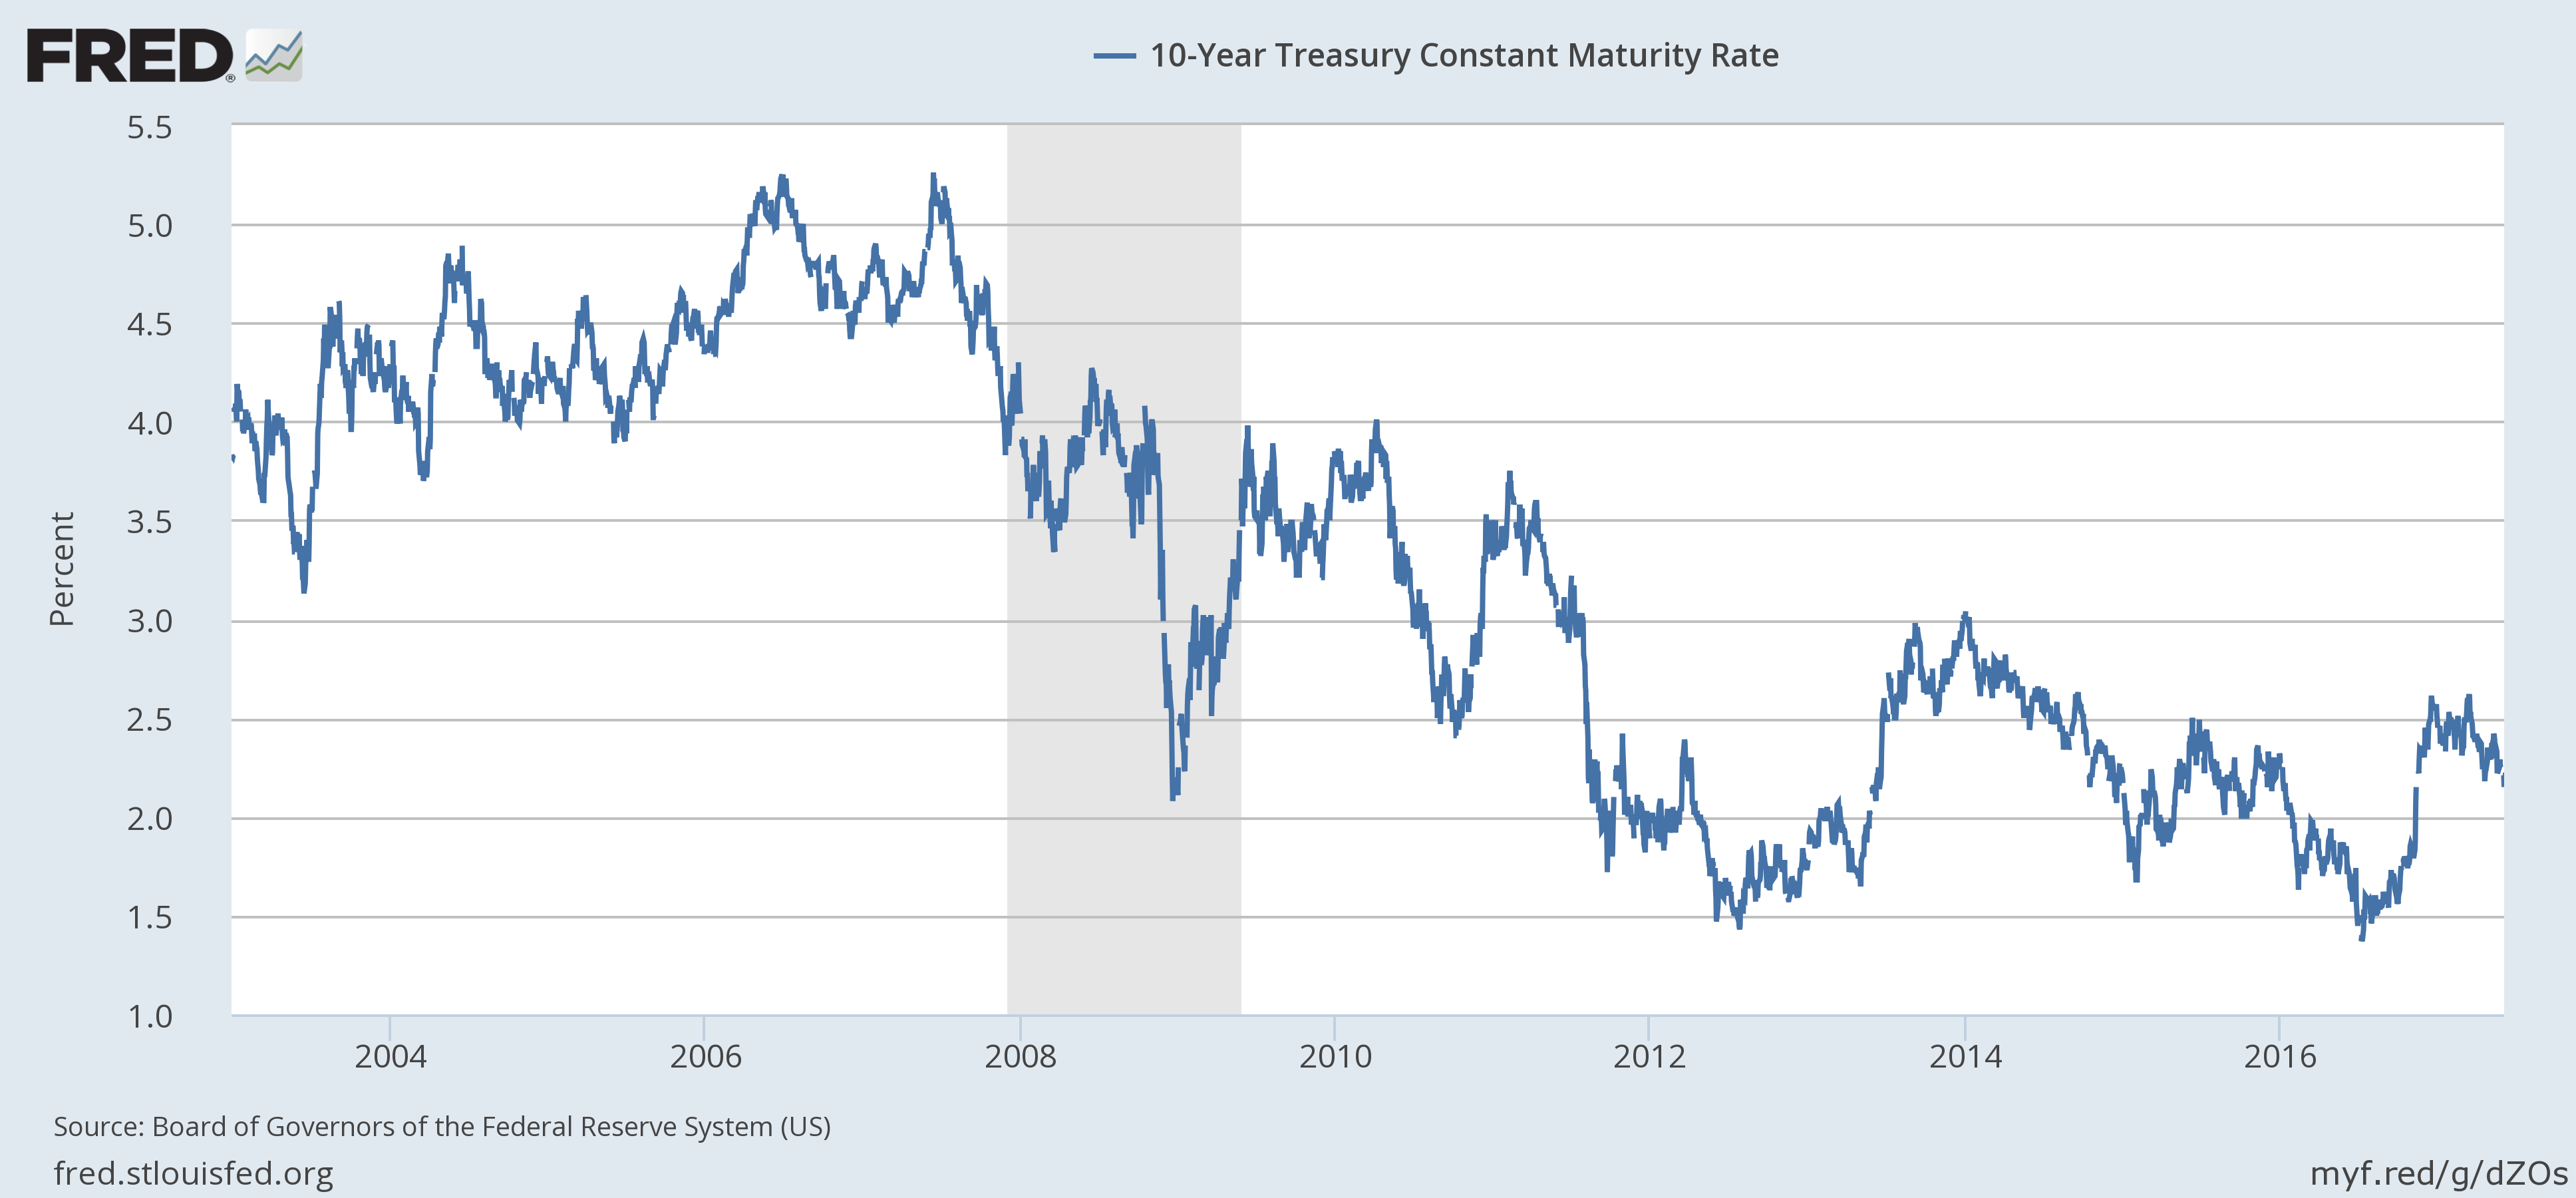
| The nominal 10 year Treasury note was down 8 basis points reflecting mostly reduced real growth expectations. |
10-Year Treasury Constant Maturity Rate, 2004 - 2017 |
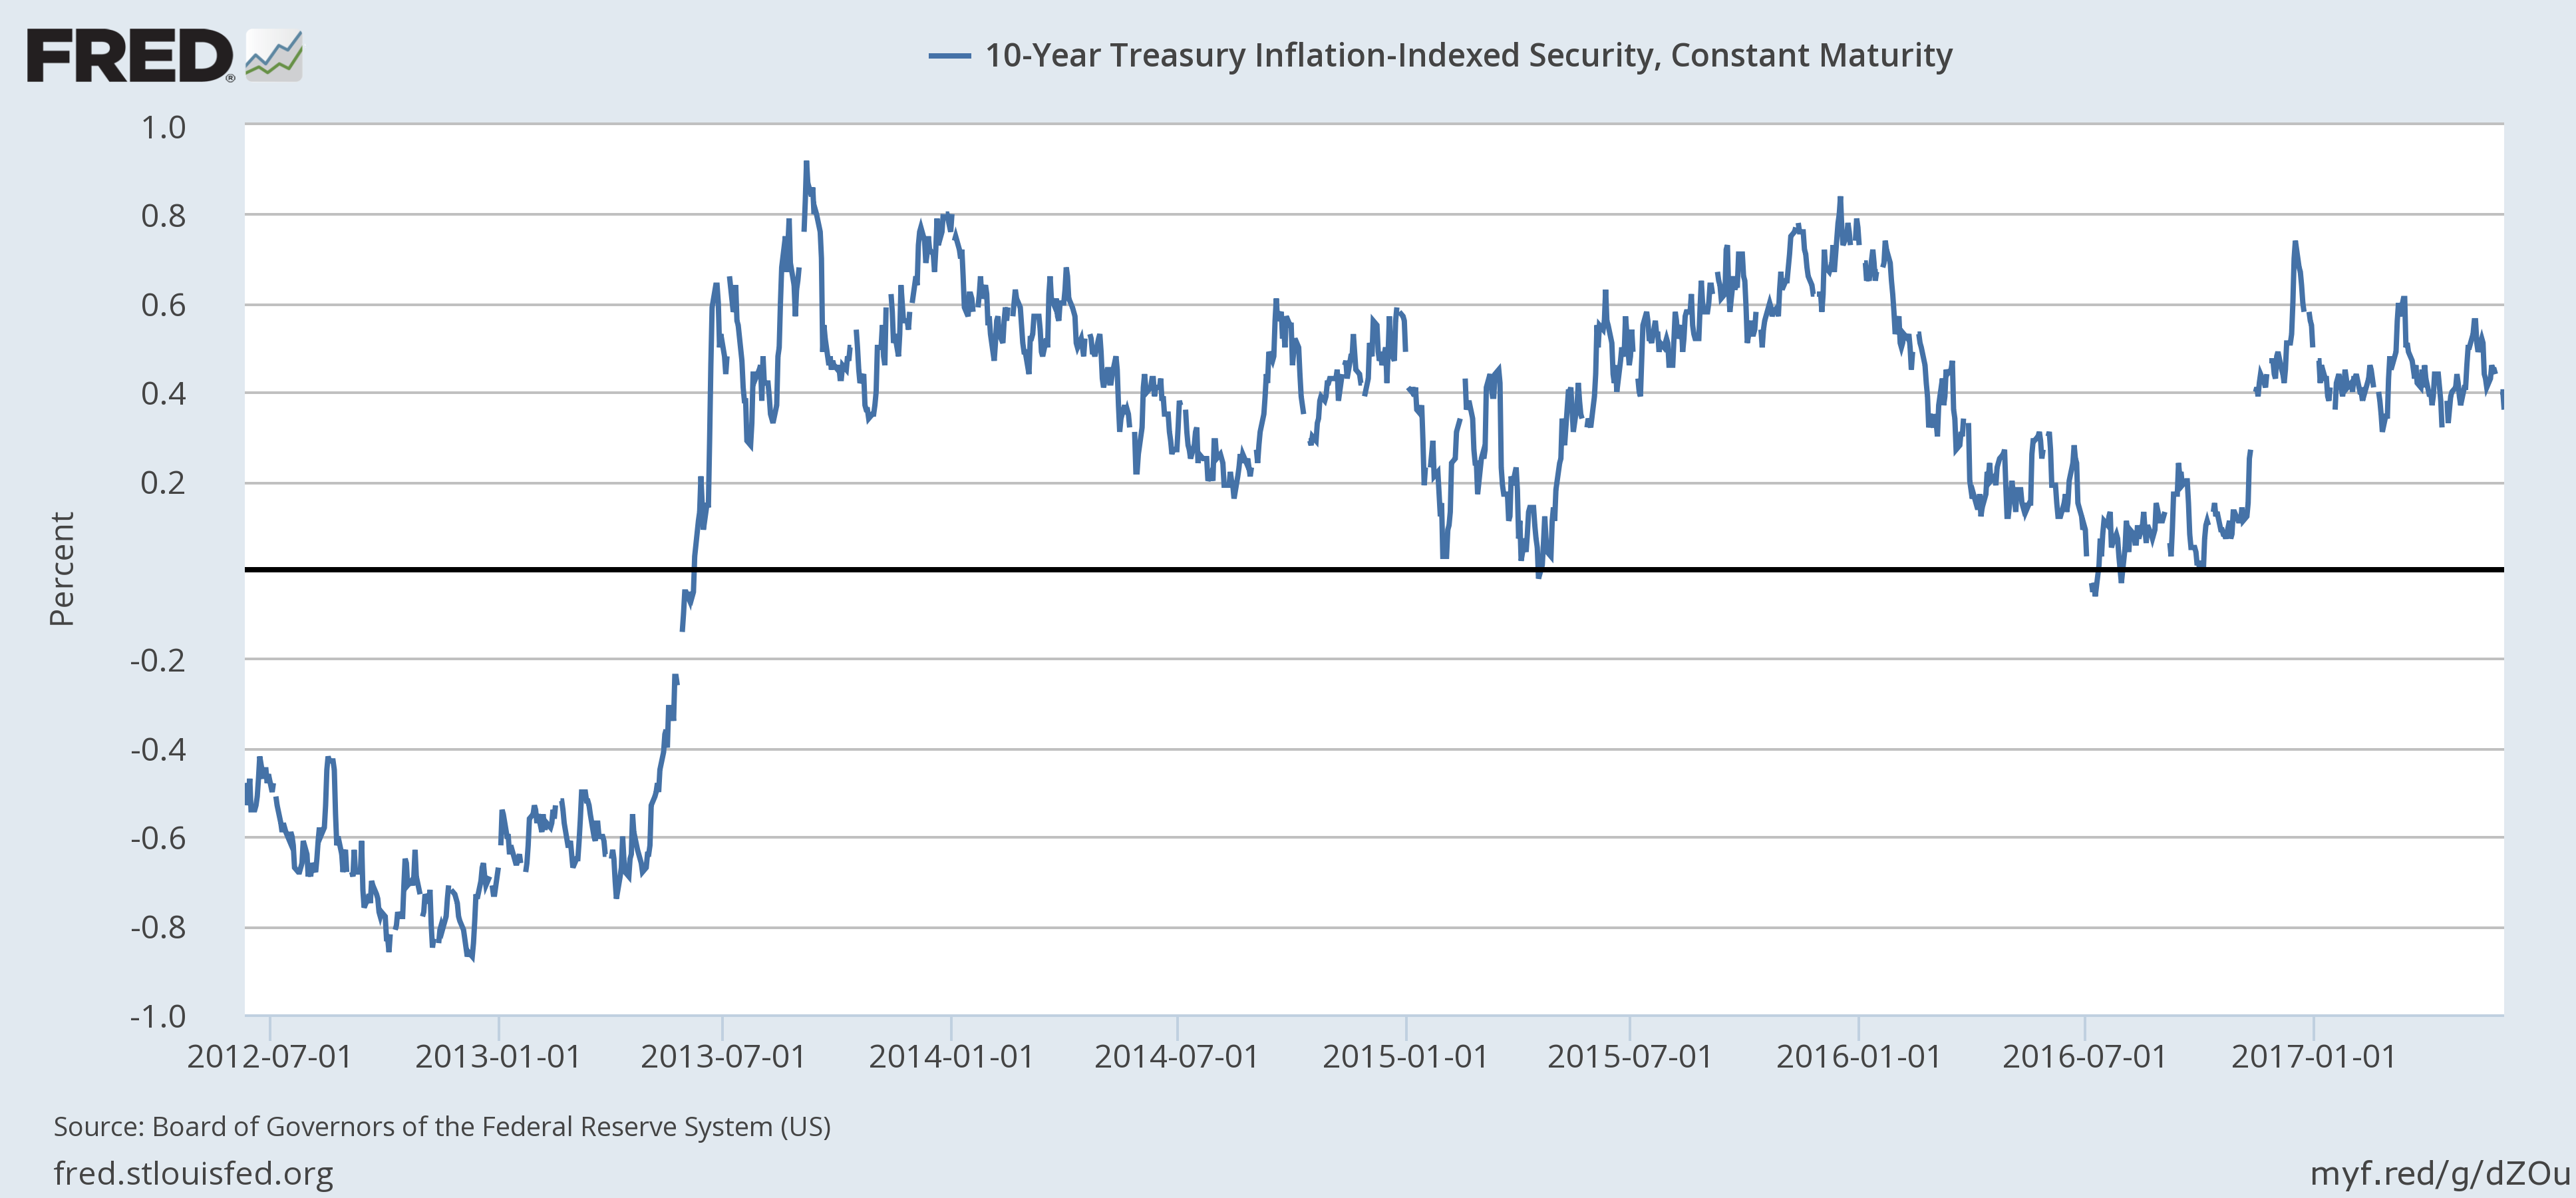
| The 10 year TIPS were down 5 basis points as real growth expectations continue to wane. |
10-Year Treasury Inflation Indexed Security And Constant Maturity, July 2012 - June 2017 |
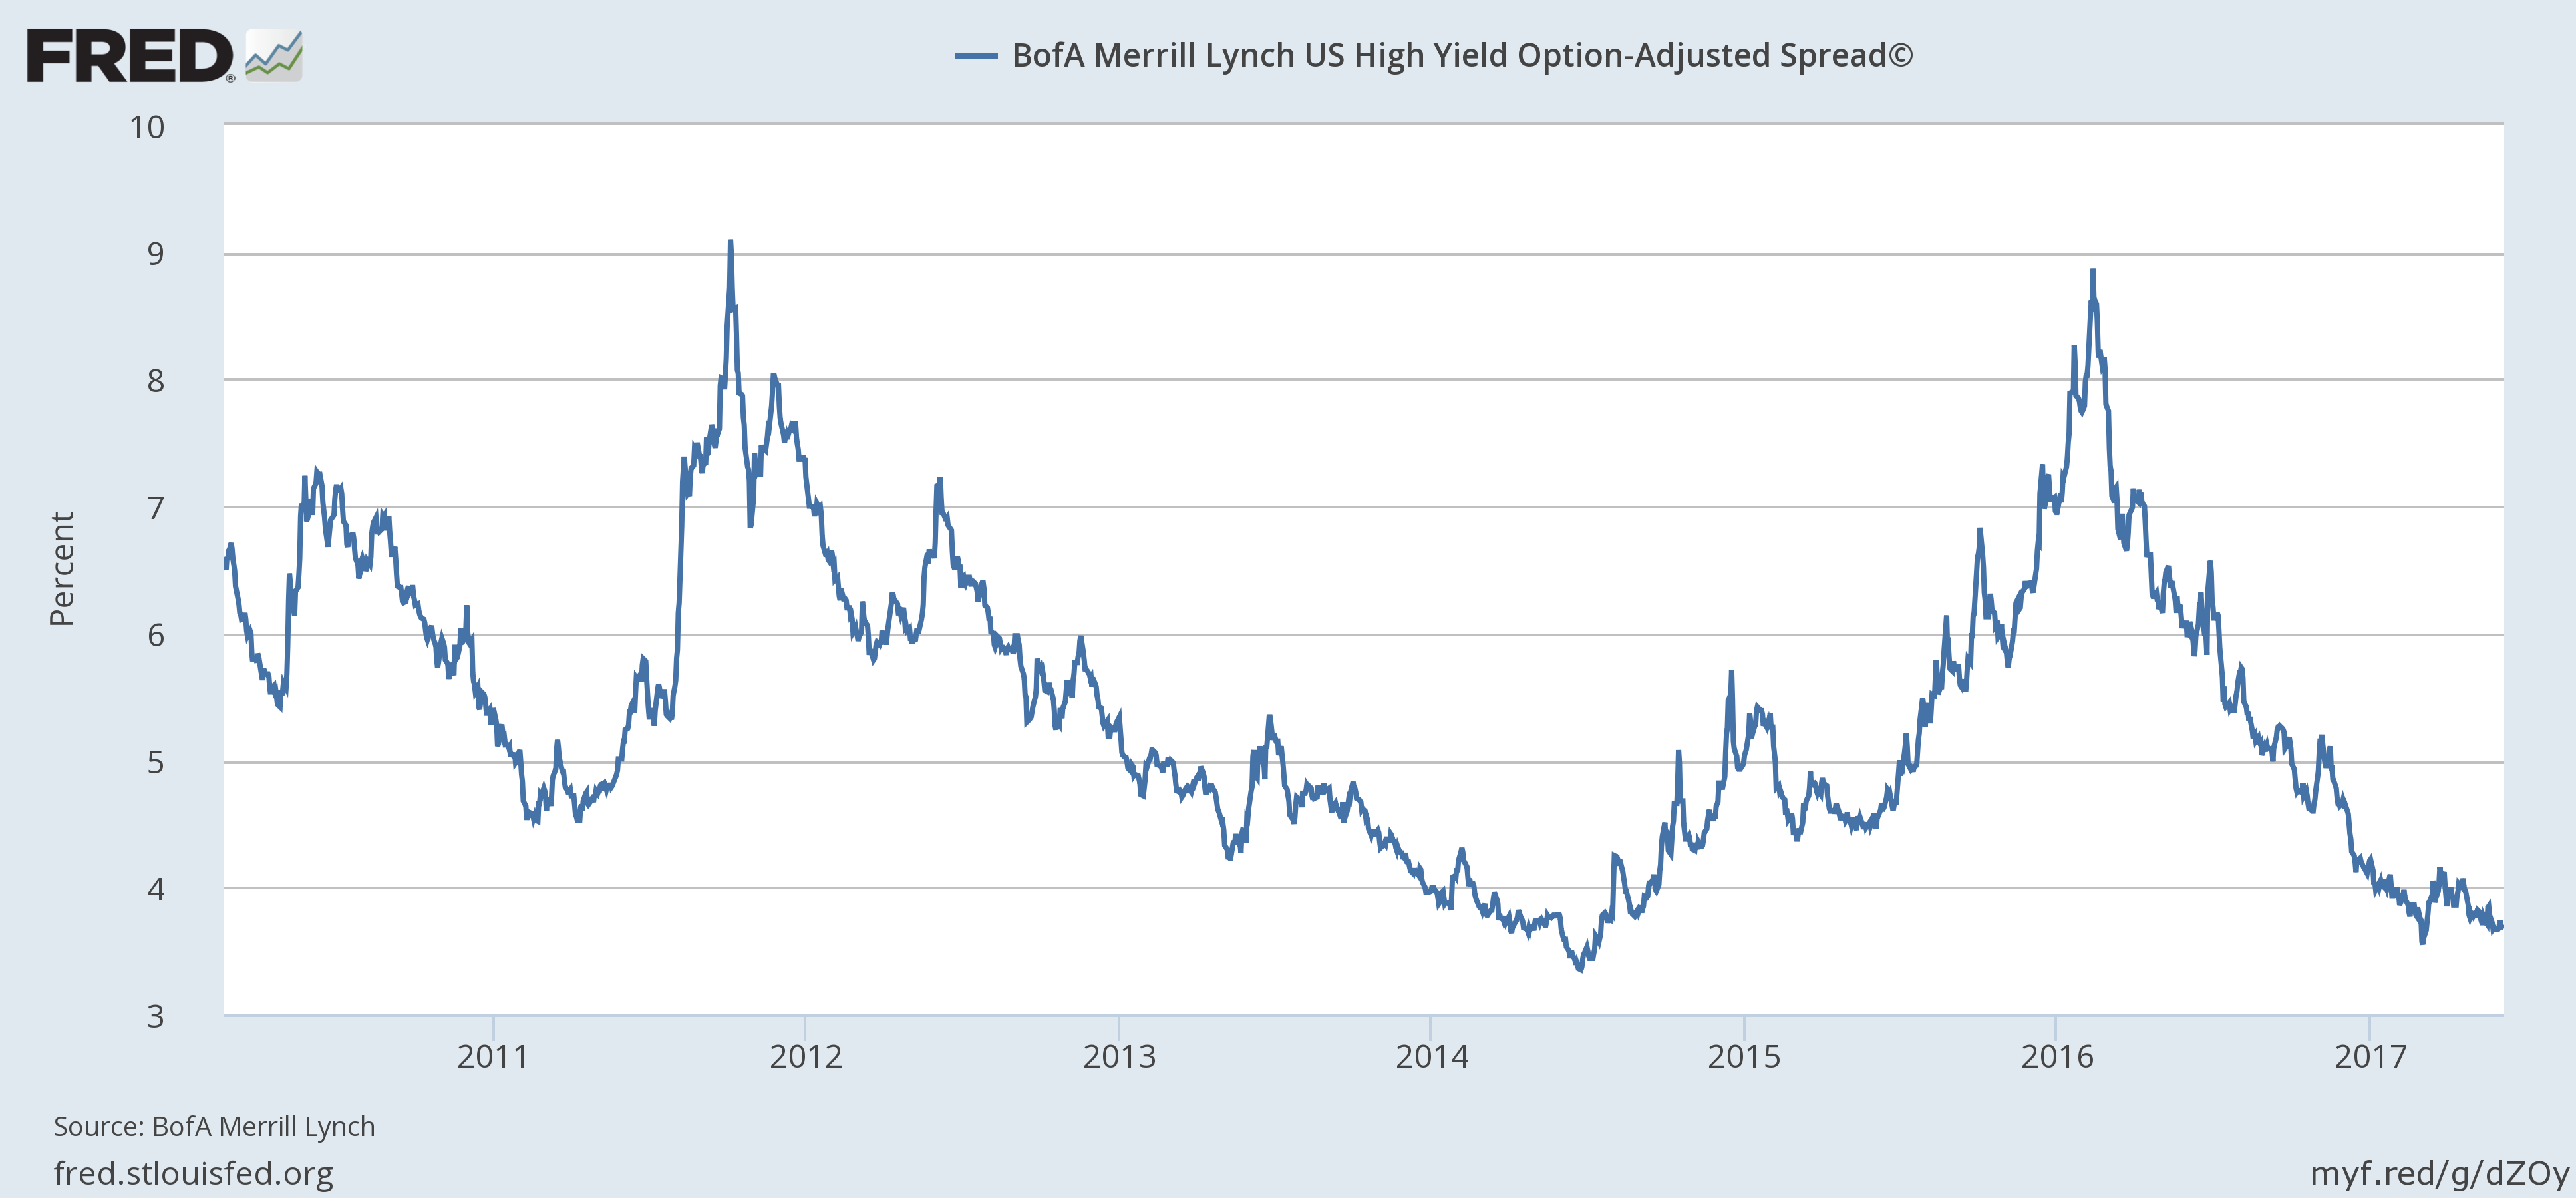
| Like the stock market the risk buyers in bonds continued to press on the accelerator as credit spreads continued to narrow, down 10 basis points. The appetite for risk appears ravenous and that won’t change until someone gets indigestion. |
U.S. High Yield Option, 2011 - 2017 |
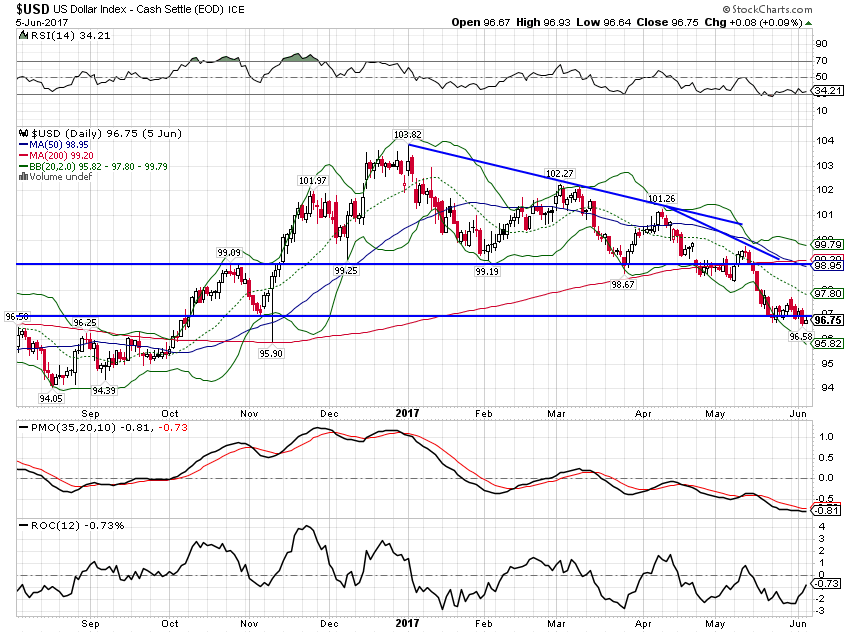
| The dollar continued lower as growth expectations outside the US, particularly in Europe, continue to pick up. Short term support is barely holding but the Euro has picked up a lot of fans recently so we may be due for countertrend rally in the buck. |
U.S. Dollar Index, September 2016 - June 2017(see more posts on U.S. Dollar Index, ) |
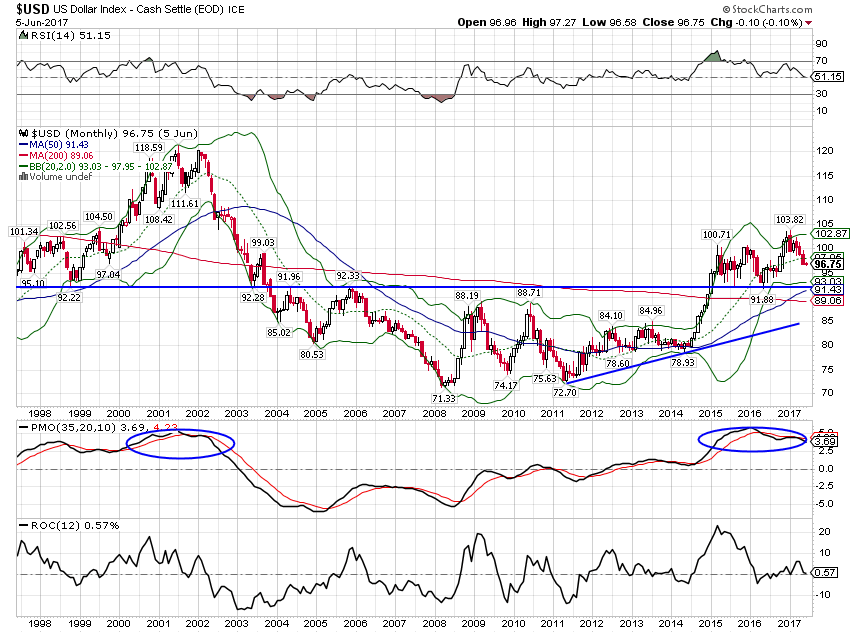
| Longer term charts still point to eventually lower levels. |
U.S. Dollar Index Monthly, 1998 - 2017(see more posts on U.S. Dollar Index, ) |
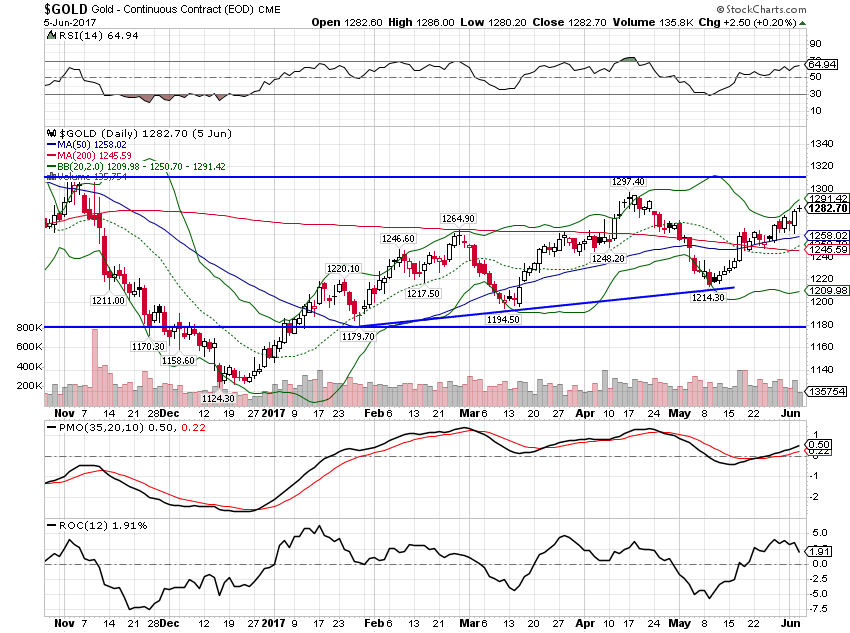
| A weaker dollar is a reflection of weaker growth expectations which makes gold more attractive as interest rates fall. |
Gold Continuous Contract, November 2016 - June 2017(see more posts on Gold, ) |
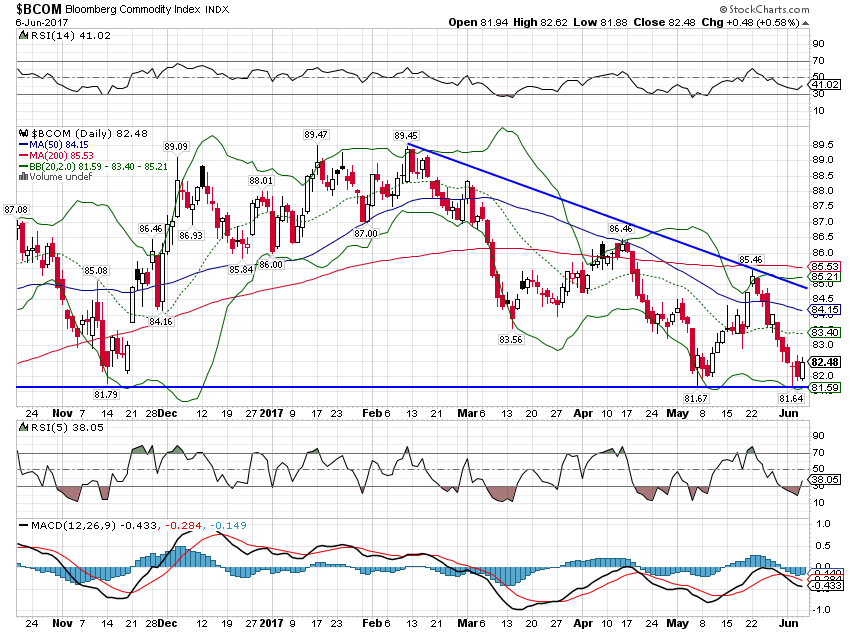
| The weaker dollar isn’t kind to all commodities though. The Bloomberg commodity index fell hard with growth expectations. |
Bloomberg Commodity Index, November 2016 - June 2017 |
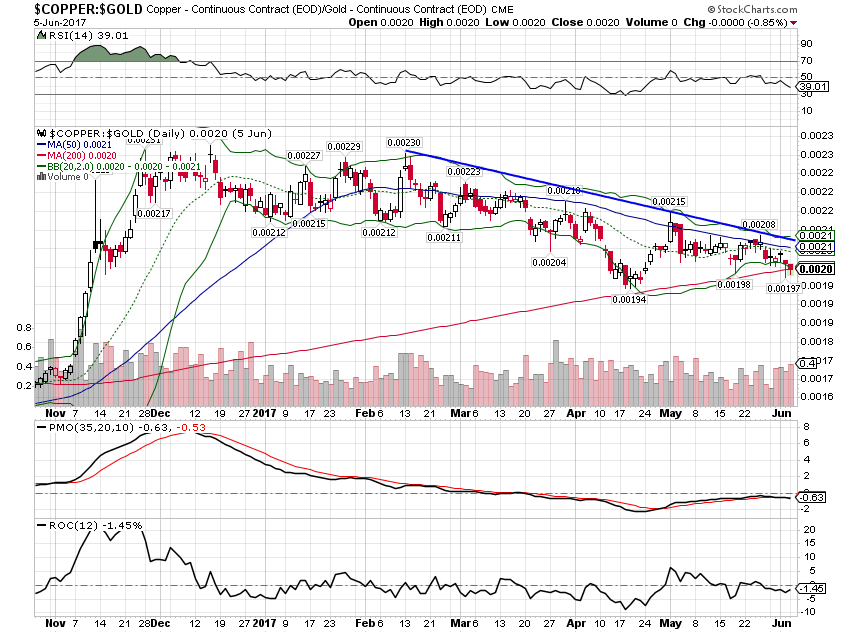
| Another confirmation of weaker growth expectations is the copper to gold ratio, also in a solid downtrend. |
Copper Continuous Contract Versus Gold Continuous Contract, November 2016 - June 2017 |
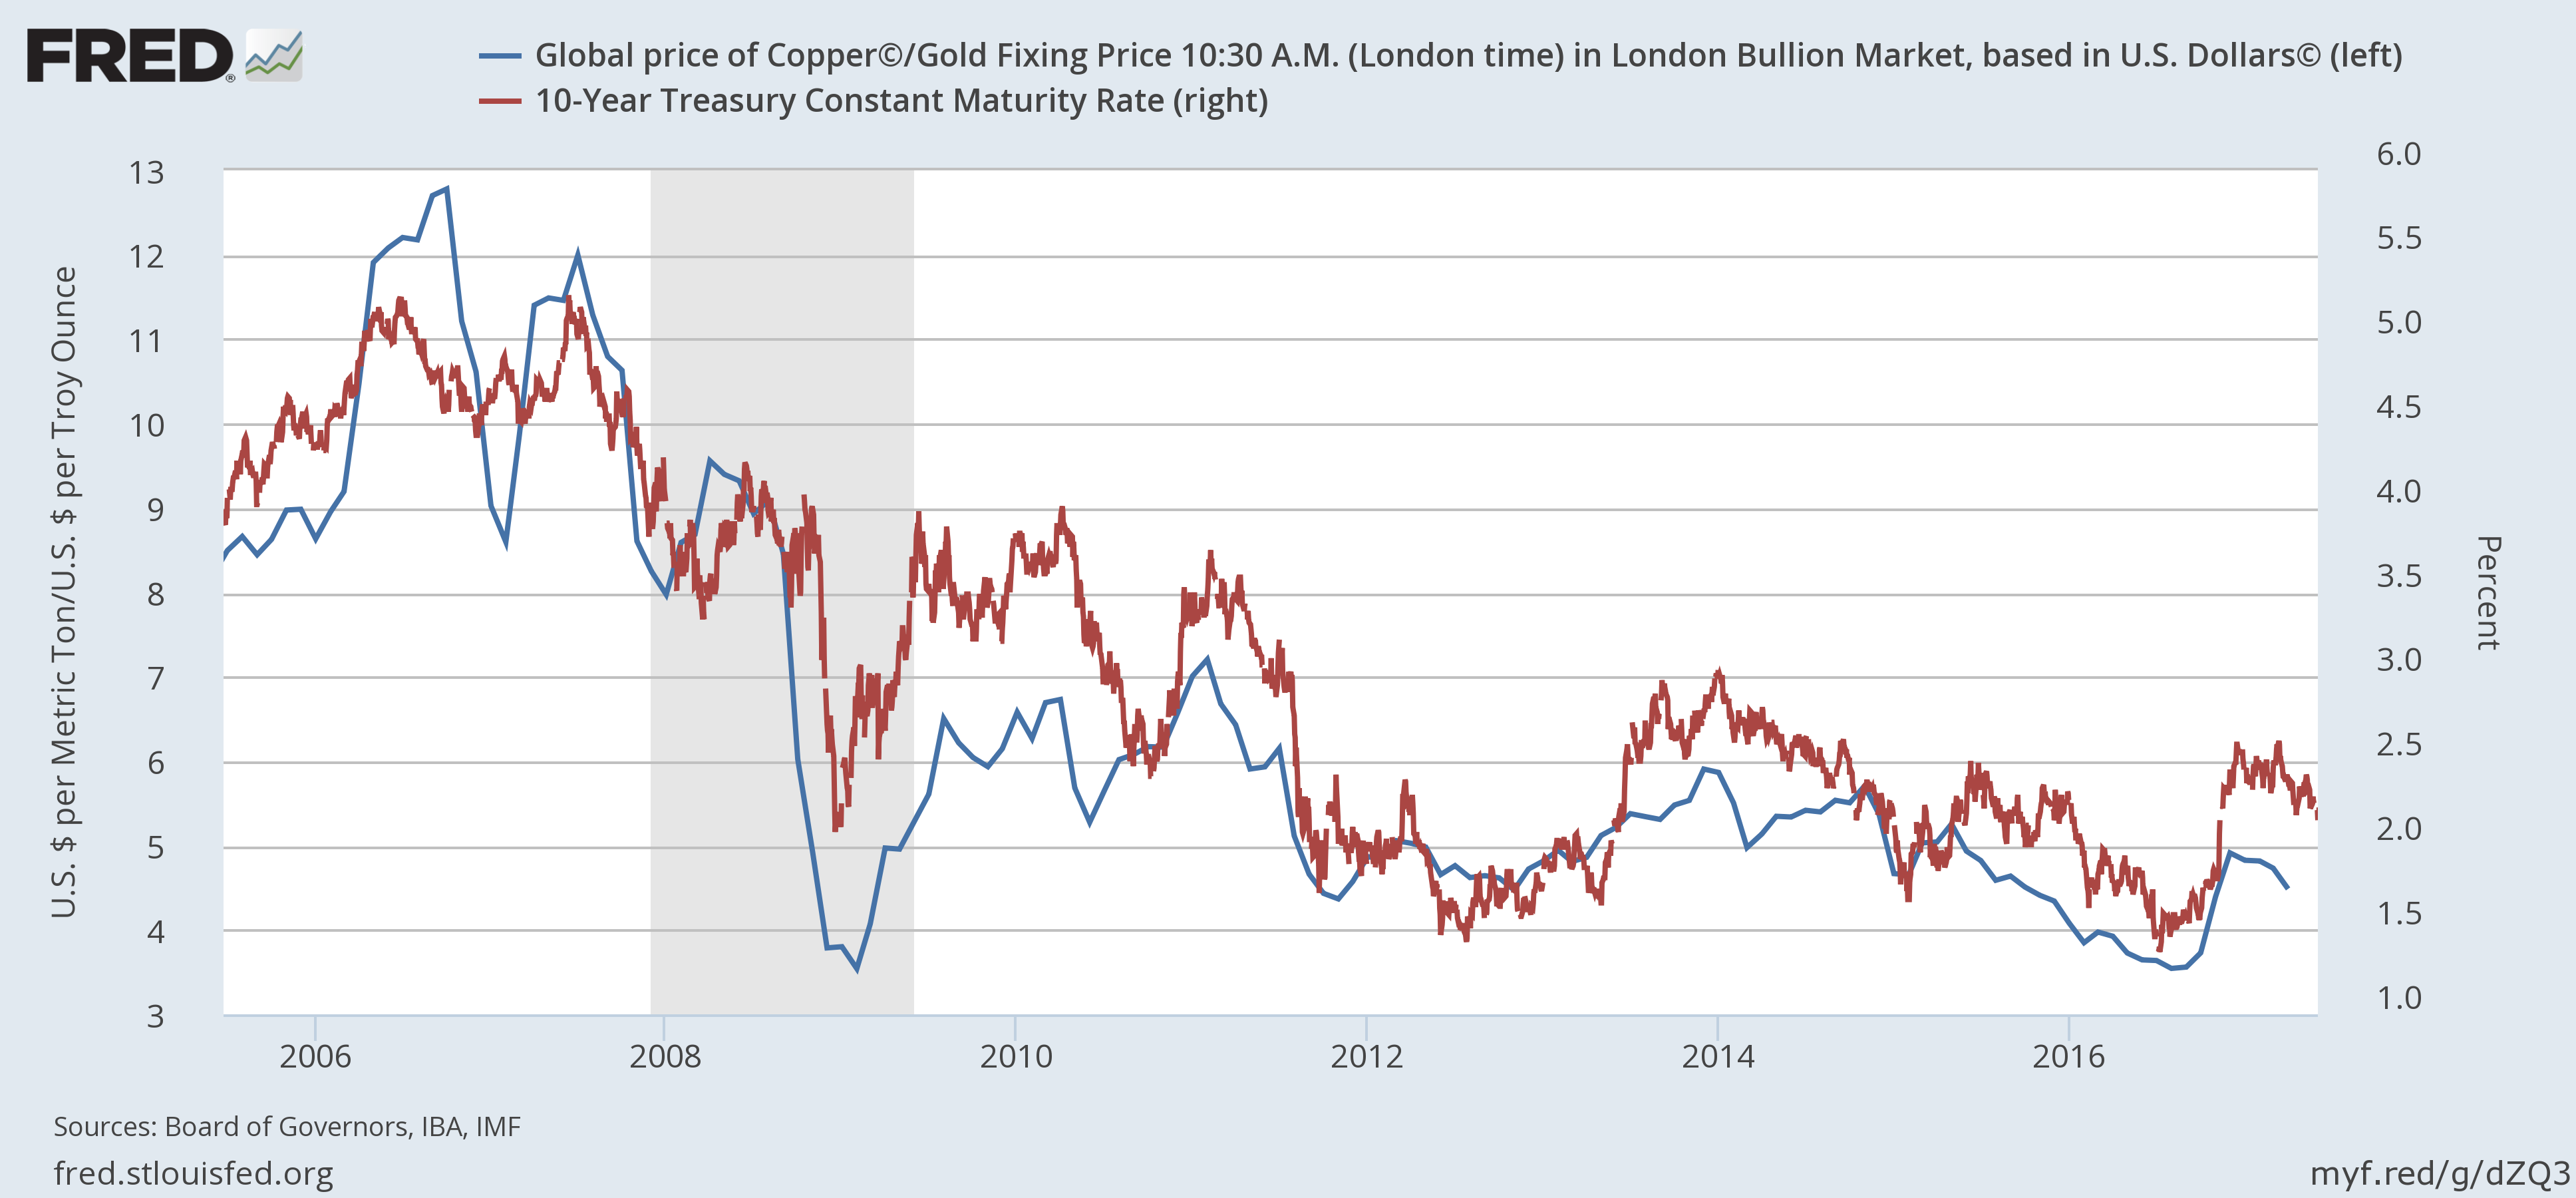
| The copper/gold ratio is also a good confirmation for the bond market. the 10 year yield tracks changes in the ratio pretty well.
For now our market indicators show no signs of economic stress although they are pointing to lower growth. The yield curve is still far from flat; the current spread between the 10 year and 2 year yield is about the same as it was in January of 2005. If it continues to flatten at the current rate it could be a couple more years before we even get to flat. And there is usually a lead time between flat or inverted and recession. That’s way too easy though so it probably won’t happen that way. Either the curve won’t ever get to flat before recession or the rate of flattening will accelerate – growth will fall fast. But I don’t have a crystal ball so I’ll just have to wait and see how this movie ends. There is another possibility as well. It could be that expectations for policy change have now gotten too negative just as they got too hopeful after the election. There is a possibility that tax reform actually does get done this year. I don’t think I’d put real high odds on it but it is possible and that would likely have a positive impact on growth over time. I have warned in the past though that the impact will not be as great as Mr. Trump and his supporters believe. And his other policies, particularly on trade, could offset a large portion of the positives from tax and regulatory reform. But even if that is true eventually, we will get a period where there is hope that growth will accelerate. We’ve seen plenty of those over the last few years, all of them eventually dashed, so we know how that would impact the markets. All of that is potentially in the future though. In the meantime, we’ll continue to take our clues from the markets and right now the message is pretty loud and clear – the economy is slowing again. Not recession is imminent slowing but slowing nonetheless. I suspect stock buyers may have to face that reality soon too; bond buyers have already embraced it. |
Global Price Of Copper And Gold Fixing Price Versus 10-Year Treasury Constant Maturity Rate, 2006 - 2017 |
Full story here Are you the author?
Previous post See more for Next postTags: Alhambra Research,Bi-Weekly Economic Review,Bonds,cfnai,commodities,consumption,Copper,credit spreads,currencies,dollar,Donald Trump,economic growth,economy,employment,Gold,incomes,inflation expectations,Interest rates,manufacturing,Markets,newslettersent,stocks,TIPS,U.S. Dollar Index,Yield Curve


