Marc Chandler
My articles My offerMy siteAbout meMy videosMy books
Follow on:LinkedINTwitterSeeking AlphaAmazon
| The first Great Graphic (created on Bloomberg) here shows the rolling 60-day correlation of the level of the S&P and the level of oil since the beginning of last year. In early 2016, the correlation was almost perfect, but steadily fell and spend a good part of the second half of the year negatively correlated. Late in the year, the correlation began recovering, and February reached almost 0.8. However, a month later it was into inverse territory. It is now -0.36. |
S&P 500 Index, May 2017(see more posts on S&P 500 Index, )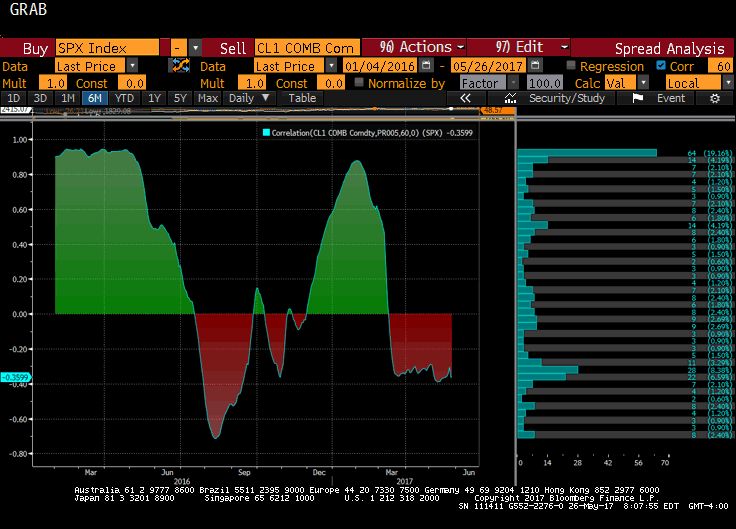 - Click to enlarge |
| The second chart here shows the correlation based on the percentage change of each time series. Ultimately investors are interested in the correlation of returns. In Q1 16, the correlation reached almost 0.60, fell by 2/3 to 0.20 before the end of Q2 16. It recovered in Q3 but was unable to surpass the earlier levels. By the time OPEC announced its decision to reduce output to encourage a draw down of inventories, the correlation was trending lower. It briefly dipped into negative territory in February before it recovered in March, but has been trending gently lower over the past two months and now is near 0.18. |
Crude Oil, May 2017(see more posts on Crude Oil, )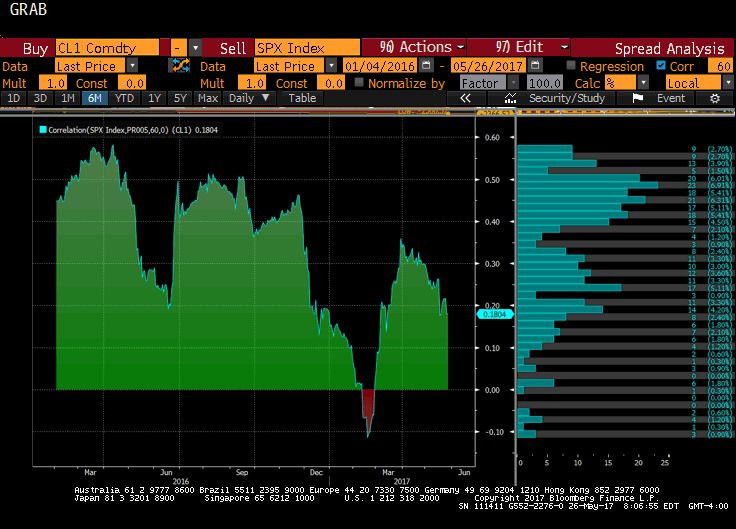 - Click to enlarge |
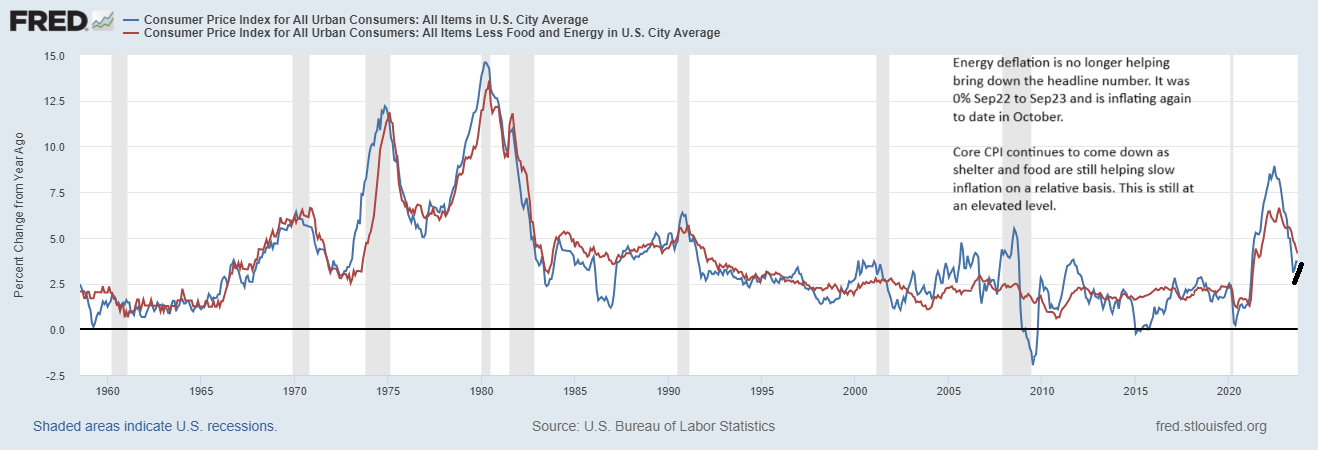
The fluctuation of oil prices is often cited as an important factor driving equities. Our work shows that this is not always the case and that the correlation between the price of oil and the S&P 500 continues to ease.
We looked the statistical relationship two different ways. We ran the correlation simply on the direction of oil and the direction of the S&P 500. Then we conducted the correlation on the percent change of each time series.
The takeaway is that based on current correlations, investors in the S&P 500 should not put much weight on the direction of oil. The correlation is not particularly stable, and it is low now. Of course, some sectors will be more sensitive than other sectors to the change in oil prices. However, knowing the change in oil prices will not give one much help in anticipating the S&P 500 index.
Full story here Are you the author?Tags: Correlations,Crude Oil,Great Graphic,newslettersent,OIL,S&P 500 Index,SPY