Authored by Chris Hamilton via Econimica,
| The change in nations Core populations (25-54yr/olds) have driven economic activity for the later half of the 20th century, first upward and now downward. The Core is the working population, the family forming population, the child bearing population, the first home buying, and the credit happy primary consumer. Even a small increase (or contraction) in their quantity drives economic activity magnitudes beyond what the numbers would indicate.
To highlight the linkage of Core populations to economic activity, the chart below shows the European 25-54yr/old population vs. the best indicator of economic activity, total energy consumption (data available starting from 1980). The implications are pretty straightforward. European economic activity (& resultant energy consumption) will contract for decades, at a minimum, with the declining Core population. The pie is shrinking and now it’s simply a fight for who gets bigger slices. Given this, consider Germany was well aware of it’s post WWII collapsing birth rate and the impact of this on economic growth as this shrinking population of young made it’s way into the Core. Consider Germany’s Core population peaked in 1995 and it’s domestic consumer base has been shrinking since, now down over 3.3 million potential consumers (about a 9% Core decline…remember a depression is a 10% decline in economic activity, which a 9% and growing decline in German consumers would have almost surely induced). |
European Population vs. Total Europe Energy Consumption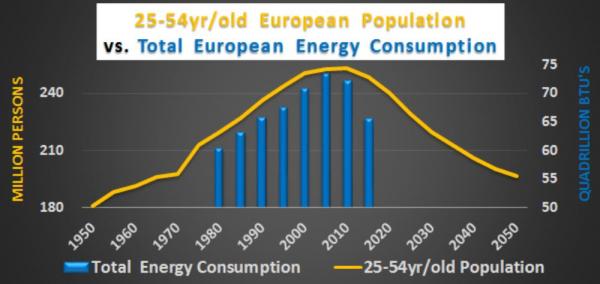 - Click to enlarge |
GERMANYThe chart below shows Germany’s Core population from 1950–>2040…but understand this is no guestimate through 2040. This is simply taking the existing 0-24yr/old population (plus anticipated immigration) and sliding them into the Core through 2040. Germany’s Core population is set to fall by over 30% or 10+ million by 2040 (far more than the 7 million Germans of all ages who died in WWII). |
Germany Population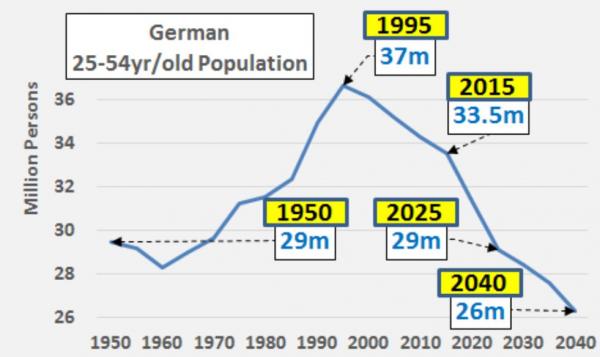 - Click to enlarge |
| But Germany had a plan. With the advent of the EU and Euro just as Germany’s Core began shrinking, Germany was able to avoid the pitfalls of a shrinking domestic consumer base, circumvent the strong German currency, and effectively quadruple it’s effective export market across Europe. German exports, as a % of GDP, have essentially doubled since the advent of the Euro (22% in ’95 to almost 50% in ’16). The chart below highlights Germany’s shrinking Core vs. rising GDP (primarily via exports) since 1995. |
Germany GDP vs. Core Population(see more posts on Germany Gross Domestic Product, )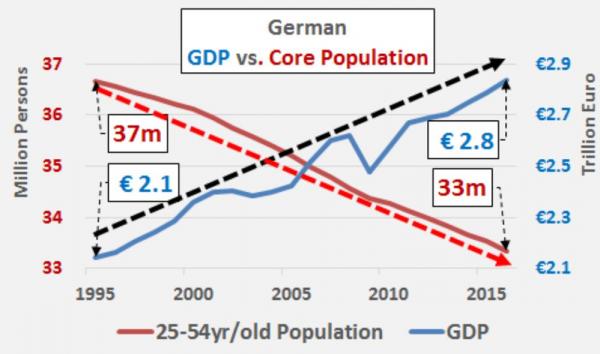 - Click to enlarge |
| And this had the desired effect of turning what was a rising German debt to GDP ratio during re-integration of E. Germany into a falling ratio (chart below).
So the German motivation for the EU and Euro are fairly plain as are the resultant economic transfusion from South to North. But for Germany to be a winner, there had to be a loser in this shrinking pie game. Hello PIGS (Portugal, Italy, Greece, Spain), you lost. As the old poker adage goes, when you don’t know who the sucker at the table is…it’s you. Particularly when you “win big” at first and it all seems so easy…but then it all turns. |
German Debt to GDP(see more posts on Germany Gross Domestic Product, )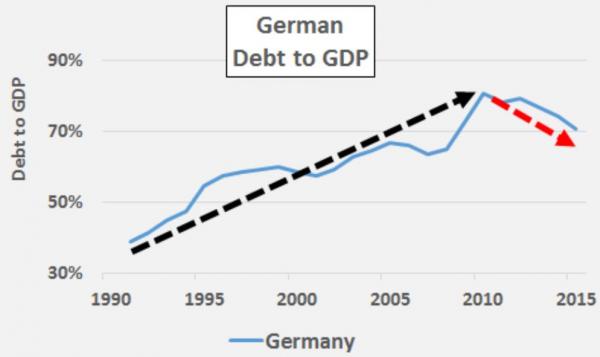 - Click to enlarge |
PIGSThe chart below shows the PIGS Core population peaking about 15 years later than in Germany but likewise clearly rolling over. By 2040, the PIGS Core population will be back at it’s 1960 levels…down from the 2010 peak by 17 million or about a 30% decline. |
PIGS Population 1950-2040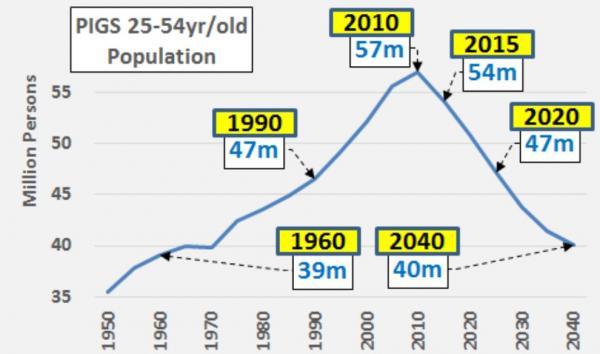 - Click to enlarge |
| But if we look at the PIGS combined GDP and Core population…we see a very different picture than in Germany. The chart below shows the PIGS GDP turned down ahead of the Core population peak. The rise in GDP in these nations was a credit bubble premised on cheap EU wide interest rates more appropriate for Germany. Exports as a % of GDP (which were higher than Germany’s in ’95) have risen less than half of Germany’s increase (rising as a % primarily due to declining PIGS GDP). Low German wage increases and high quality German goods helped displace PIGS domestic manufacturing base. |
PIGS GDP vs. Population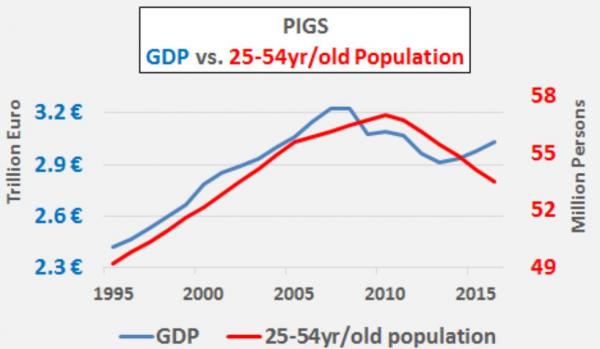 - Click to enlarge |
| To extend the game a bit longer (and multiply the harm), un-repayable government debt has been substituted to keep the PIGS consuming since 2007 (chart below). |
PIGS Debt to GDP 1990-2017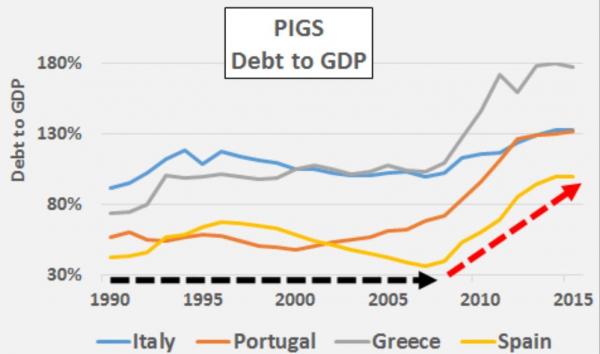 - Click to enlarge |
| How it played out…
The chart below shows the impact of the implementation of the EU and Euro on the different parties. Clearly the PIGS were fattened up on cheap credit. These nations became used to unsustainably fast growth and the good life, buying really nice German exports and undermining their own national brands. |
European GDP 1995-2007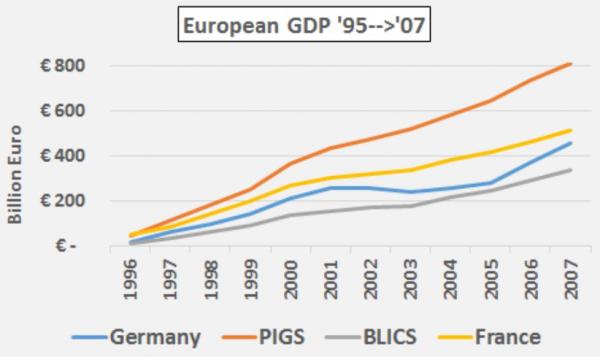 - Click to enlarge |
| But then the phony PIGS growth turned to real and deep contraction (chart below). However, the slowdown was quick and shallow for Germany and the BLICS. French GDP likewise turned upward after a shallow contraction but did so on a large increase in debt and continuing high levels of unemployment. Quite the opposite of the trends in Germany. |
European GDP 2007-2016 - Click to enlarge |
| The raw trade data confirms Germany’s gain against an ageing domestic population came at the expense of the PIGS. |
Germany vs. PIGS Exports 1995-2015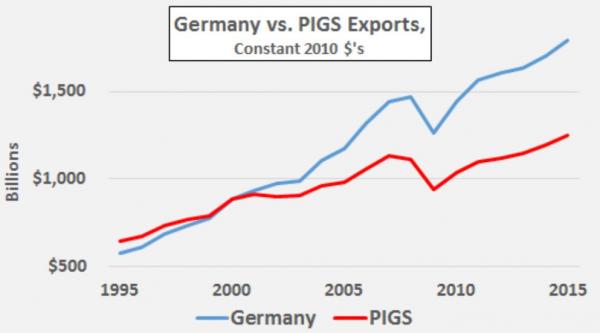 - Click to enlarge |
| BLICS
And just to square the circle, I need to talk a little about the BLICS (Belgium, Luxembourg, Ireland, Cayman Island, and Switzerland…yes, I understand Cayman Island is not in Europe, but bear with me as it is a British Overseas Territory). These nations with a total population of about 24 million have been disproportionate beneficiaries of the new EU system. These financier nations have been the biggest winners of all with huge amounts of money flowing through them (BLICS GDP below). |
BLICS Gross Domestic Products 1997-2017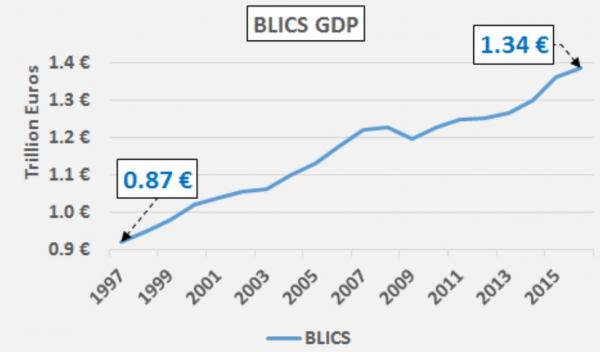 - Click to enlarge |
| But why would small to tiny financier nations be the greatest beneficiary of the new EU? Untold quantities of nearly free ECB money & distortions does wonders for those who can get their hands on it. In this respect, a peek at these nations US Treasury holdings is quite telling. These tiny nations are now five of the top 13 foreign holders of US Treasury’s (Ireland is #3, and Cayman Island #5, Switzerland #6, Luxembourg #7, and Belgium has slipped to #13). That these are America’s creditors is laughable really!
I’m just guessing but the timing and size of BLICS Treasury purchases sure looks like it was front running in conjunction with the ECB’s 2011 LTRO and subsequent 2014 TLTRO?!? The chart below shows the BLICS Treasury holdings back to 2001. “Financialization” writ large for nations that don’t produce much of anything. |
BLICS Treasury Holdings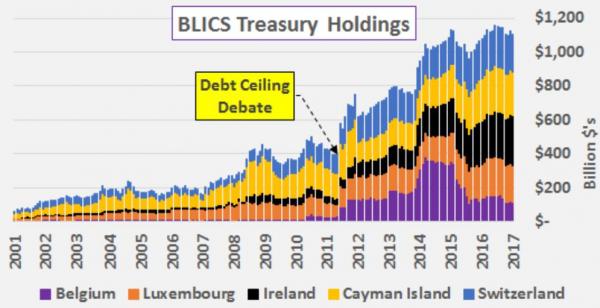 - Click to enlarge |
| In fact, since the July 2011 debt ceiling debate (debacle?!?) when Congress determined the US would never live within it’s means, it has been the BLICS that have done the heavy lifting to maintain the foreign Treasury bid while China (and cumulative BRICS) have been selling despite record dollar surplus’ (chart below). As an aside, from ’00 through July ’11, China recycled about 50% of it’s dollar trade surplus into Treasury’s…from July ‘ll China only continues to sell Treasury’s despite record trade surplus…but luckily the BLICS stepped up just as China and the BRICS bowed out. |
US Treasury Holdings 2011-2017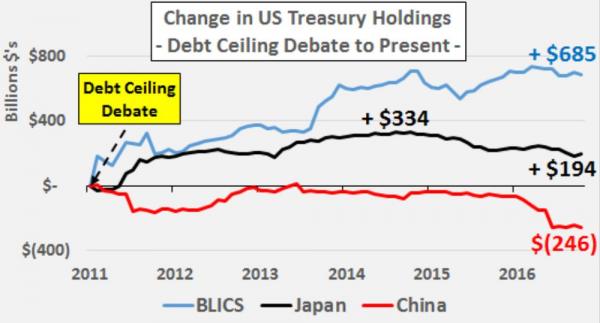 - Click to enlarge |
| The chart below highlights that the BLICS are now, as of January 2017, the largest holder of US Treasury debt overtaking the declining holdings of both Japan and China. |
US Treasury Holdings 2000-2017(see more posts on U.S. Treasury, )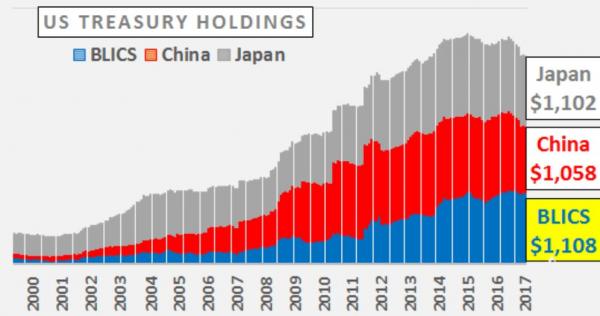 - Click to enlarge |
| Conclusion:
As Europe’s Core population collapses (and economic activity with it), the Euro and ECB seem to be serving a select few at the expense of the majority. The imbalances and distortions will only grow as the attempts to mask who the Euro and ECB truly serve continue. What little vitality exists is being transfused to prop up the few. Hope this has been thought provoking and make of this what you will. |
Full story here Are you the author?
Tags: Belgium,BRICs,China,Congress,creditors,Currency,economy,Economy of the European Union,Euro,European central bank,European Union,Eurozone,Germany,Germany Gross Domestic Product,Greece,Ireland,Italy,Japan,LTRO,newslettersent,Portugal,recession,Switzerland,U.S. Treasury,Unemployment