Systematic Trading Based on StatisticsTrading methods based on statistics represent an unusual approach for many investors. Evaluation of a security’s fundamental merits is not of concern, even though it can of course be done additionally. Rather, the only important criterion consists of typical price patterns determined by statistical examination of past trends. Systematic trading on the basis of statistical evidence will improve the odds of generating profits. Trading based on seasonality does in fact represent such a statistically substantiated trading approach. |
Ballooning S&P 500, Jan 2012 - 2017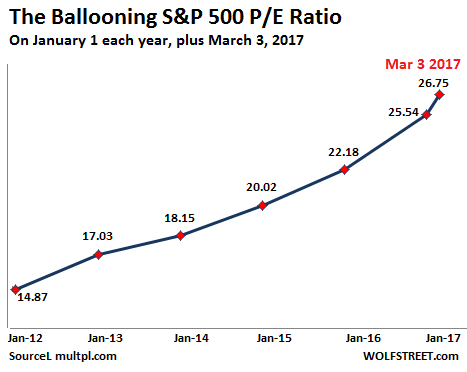 Fundamental considerations such as the valuation of stocks are not really relevant to the statistics-based trading approach discussed here. This is not to say that they are not important as such – one should certainly be aware of the fundamental backdrop. The point is only that strategies based on e.g. seasonality have a different focus. - Click to enlarge |
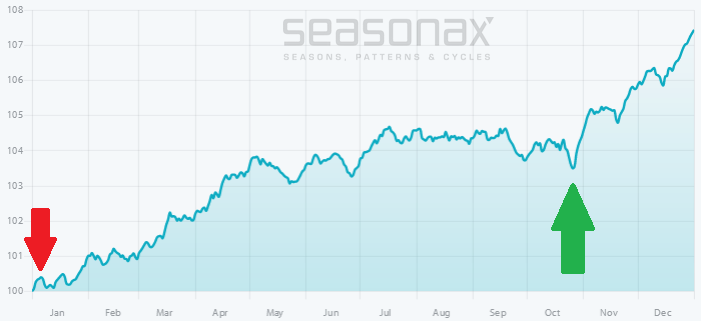
Seasonality Helps with Stock SelectionEverybody has probably heard about the end-of-year rally phenomenon by now. It affects the majority of stocks during the same time period, namely in the final weeks of the year. However, many people are probably unaware that individual stocks display unique seasonal patterns as well. Look at the following seasonal chart in this context. It shows the seasonal chart pattern of Novo Nordisk, a Danish health care company, over the past 15 years. As the chart shows, Novo Nordisk is subject to a particularly strong seasonal uptrend between the end of January and the beginning of March – the time period highlighted in blue. Thereafter, a slightly upwardly skewed sideways trend ensues that lasts until October, followed by an autumn rally. The phase highlighted in blue is particularly interesting, as large gains are generated in a very short period of time. This rally phase is a unique feature of Novo Nordisk – most other stocks do not display similar seasonal strength during this time period.
|
Novo Nordisk, Jan 2002 - 2017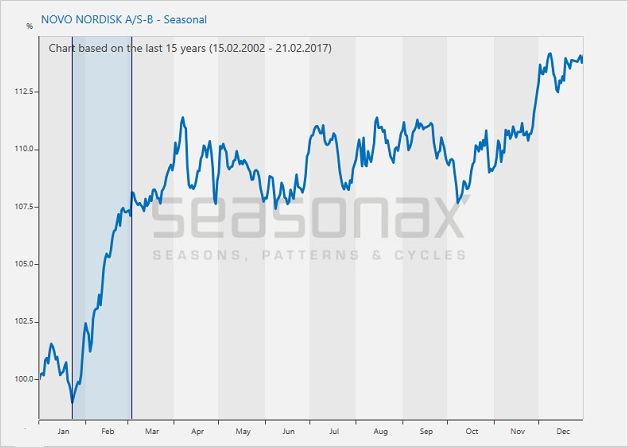 Novo Nordisk, seasonal chart pattern over the past 15 years. Novo Nordisk exhibits a unique seasonal price pattern. - Click to enlarge |
Following Right on the Heels of Novo Nordisk: AdidasIndividual seasonal patterns can be observed in other stocks as well. The next chart shows the typical seasonal pattern exhibited by Adidas, a well-known German sports equipment manufacturer. As can be seen, Adidas also surges strongly in the spring – the time period is once again highlighted in blue on the chart. As a closer look reveals though, Adidas starts to move up just as the seasonal rally in Novo Nordisk is petering out. This suggests that it would make sense to sell Novo Nordisk in early March and replace it with Adidas. In this way one can systematically improve the odds of generating profits, buttressed by strong statistical evidence. Once the period of unusual seasonal strength for Adidas ends, one moves on to the next stock selected by this method, then the next one, and so forth. |
Adidas AG - Seasonal, Jan 2002 - 2017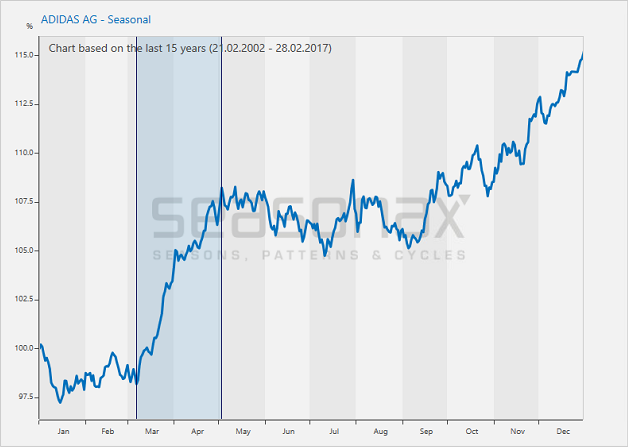 Adidas, seasonal chart pattern over the past 15 years. The stock price of Adidas typically rises in the spring and at the end of the year. - Click to enlarge |
Conclusion
I am strongly convinced that trading strategies based on seasonal trends in individual securities still offer plenty of unexploited potential to generate outperformance.
Charts by: Wolfstreet, Seasonax
Full story here Are you the author?
Tags: newslettersent,The Stock Market