Jeffrey P. Snider
My articles My offerMy siteAbout meMy videosMy books
Follow on:LinkedINTwitterSeeking Alpha
| US trade statistics dramatically improved in January 2017, though questions remain as to interpreting by how much. On the export side, US exports of goods rose 8.7% year-over-year (NSA). While that was the highest growth rate since 2012, there is part symmetry to account for some of it. Exports in the latter half of 2015 and for that first month of 2016 were contracting at double digit rates, the base effects of the deepest part of the “rising dollar” period. The volume of outbound trade therefore remains almost 3% less in January 2017 than January 2015, and nearly 8% less than January 2014. |
US Trade Export, NSA 1989-2016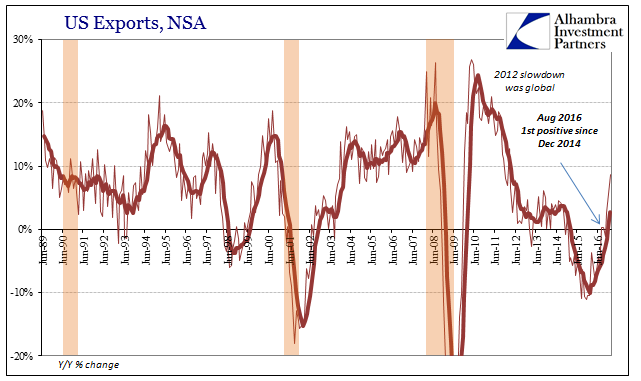 - Click to enlarge |
| Clearly, the export sector has improved, accounting for a good part of the manufacturing rebound that we find in other statistics. We don’t know yet by how much, a key question in determining, among other things, the validity of the basis for “reflation.” Some judgments can be ported from the import side, however, where things are a little clearer (if paradoxically in terms of doubts about the growth rate). |
US Trade Exports, NSA 2007-2017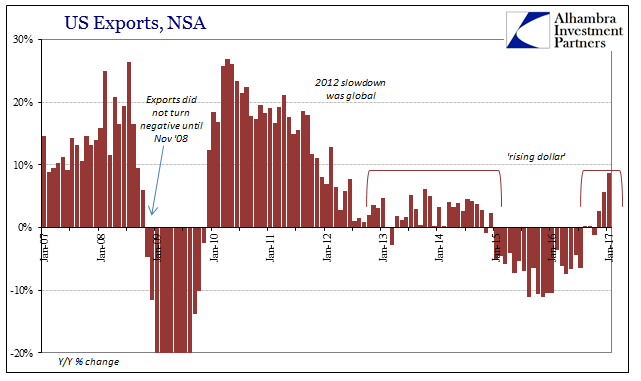 - Click to enlarge |
| US imports surged by more than 12% (NSA) in January. That, too, was the highest growth rate in many years, this time going all the way back to 2011. Unlike the outbound side, the level of inbound trade was heavily influenced by oil prices. The increase in dollar terms from January 2016 to January 2017 was $16.6 billion (including net adjustments), of which a third ($5.5 billion) was due to rising petroleum imports which surged by nearly 50%. Discounting the trade in oil, US Imports ex Petroleum rose by 6.5% year-over-year. |
US Trade Imports, NSA 1989-2016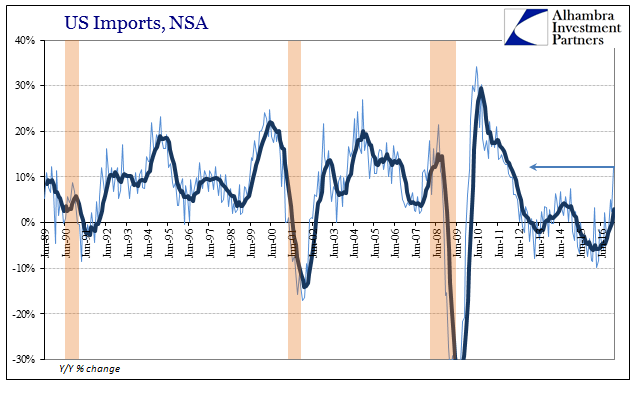 - Click to enlarge |
| Again, that is still improvement, but it is like 2014 rather than 2011. There is tremendous difference between those two possible bases for comparison. Already this economic “rebound”, such that it might be one, appears in many other places like 2014, when it is a type more like 2011 (without the monetary instability) that we would truly prefer. |
US Trade Imports ex Petroleum, SA 1989-2016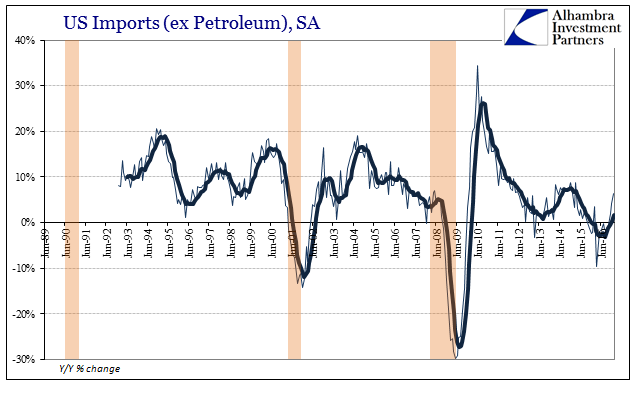 - Click to enlarge |
| The contribution to the trade deficit through oil imports is therefore in every way like import side inflation. And like domestic inflation measures, this boost due to WTI will quickly pass unless oil prices keep rising and rising rapidly. In my view, with crude exhibiting far more downside risks than upside, that isn’t likely to happen and therefore the import growth rate overall should settle back down firmly within the 2014 comparison (unfortunately). |
US Trade Imports Petroleum, SA 1989-2016 - Click to enlarge |
| There is one other source of possible noise for US imports, and that is the growth rate estimated for goods coming from China. As we well know, the Golden Week holiday has made for dramatically difficult comparisons between 2016 and 2017. The Chinese last month figured their side (exports out of China) grew sharply in January 2017 as compared to January 2016, with firms moving up activity ahead of the holiday week, and this updated data from the Census Bureau suggests the same. Imports into the US from Chinese origins rose 11.4% Y/Y (there’s actual residual seasonality here). |
US Trade SA 2014-2017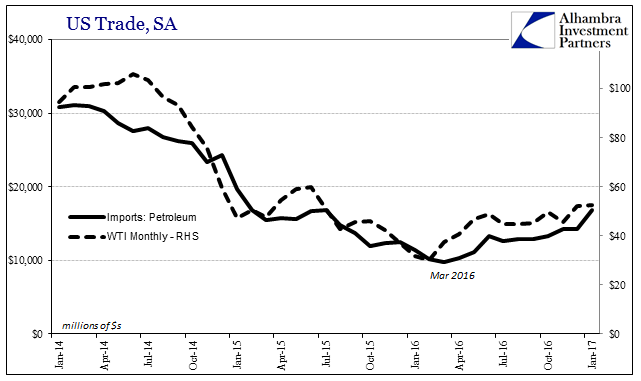 - Click to enlarge |
| Because the Golden Week was much earlier this year than last, it would suggest a different result for February (which Chinese statistics released today confirm). In my own back of the envelope calculations, US imports not including oil or Chinese calendar effects rose by about just 5% year-over-year, which is materially different than the 12% headline but very much in line with other economic accounts.
We know that the US and global economy is no longer contracting in terms of trade and manufacturing, but that doesn’t immediately propose a resumption of growth; especially since it has been about five years since conditions could have been plausibly associated with the word. In fact, it is in trade where we should expect to find the most intense rebound due to the nature of the extended downside – “dollar” disruption. So far, “better” has only meant the transition from negative numbers to positive numbers, and not from continuing depression to its merciful end. It will be several more months before we can say for sure, once we get past all the base, calendar, and inflation effects. That is especially true given the shot of intensity felt clearly around the world once oil rose and at least stayed around $50. Will that continue on and snowball positively occasionally enhanced by other factors, or might it fade as the world adjusts not to oil (and economy) being up 100% from the ultimate low but being still down more than 50% for almost three years ago? |
US Trade Imports from China, NSA 1989 - 2016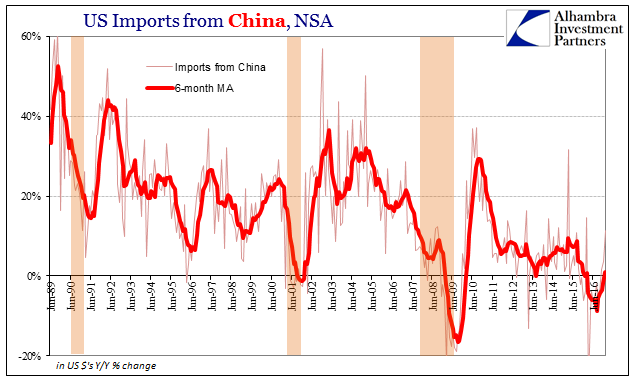 - Click to enlarge |
Tags: China,currencies,depression,dollar,economy,EuroDollar,exports,Federal Reserve/Monetary Policy,global trade,imports,Markets,newslettersent,OIL,oil prices,Trade,WTI