Joseph Y. Calhoun
My articles My siteAbout meMy videosMy books
Follow on:LinkedINTwitterSeeking AlphaAmazon
Economic Reports Scorecard
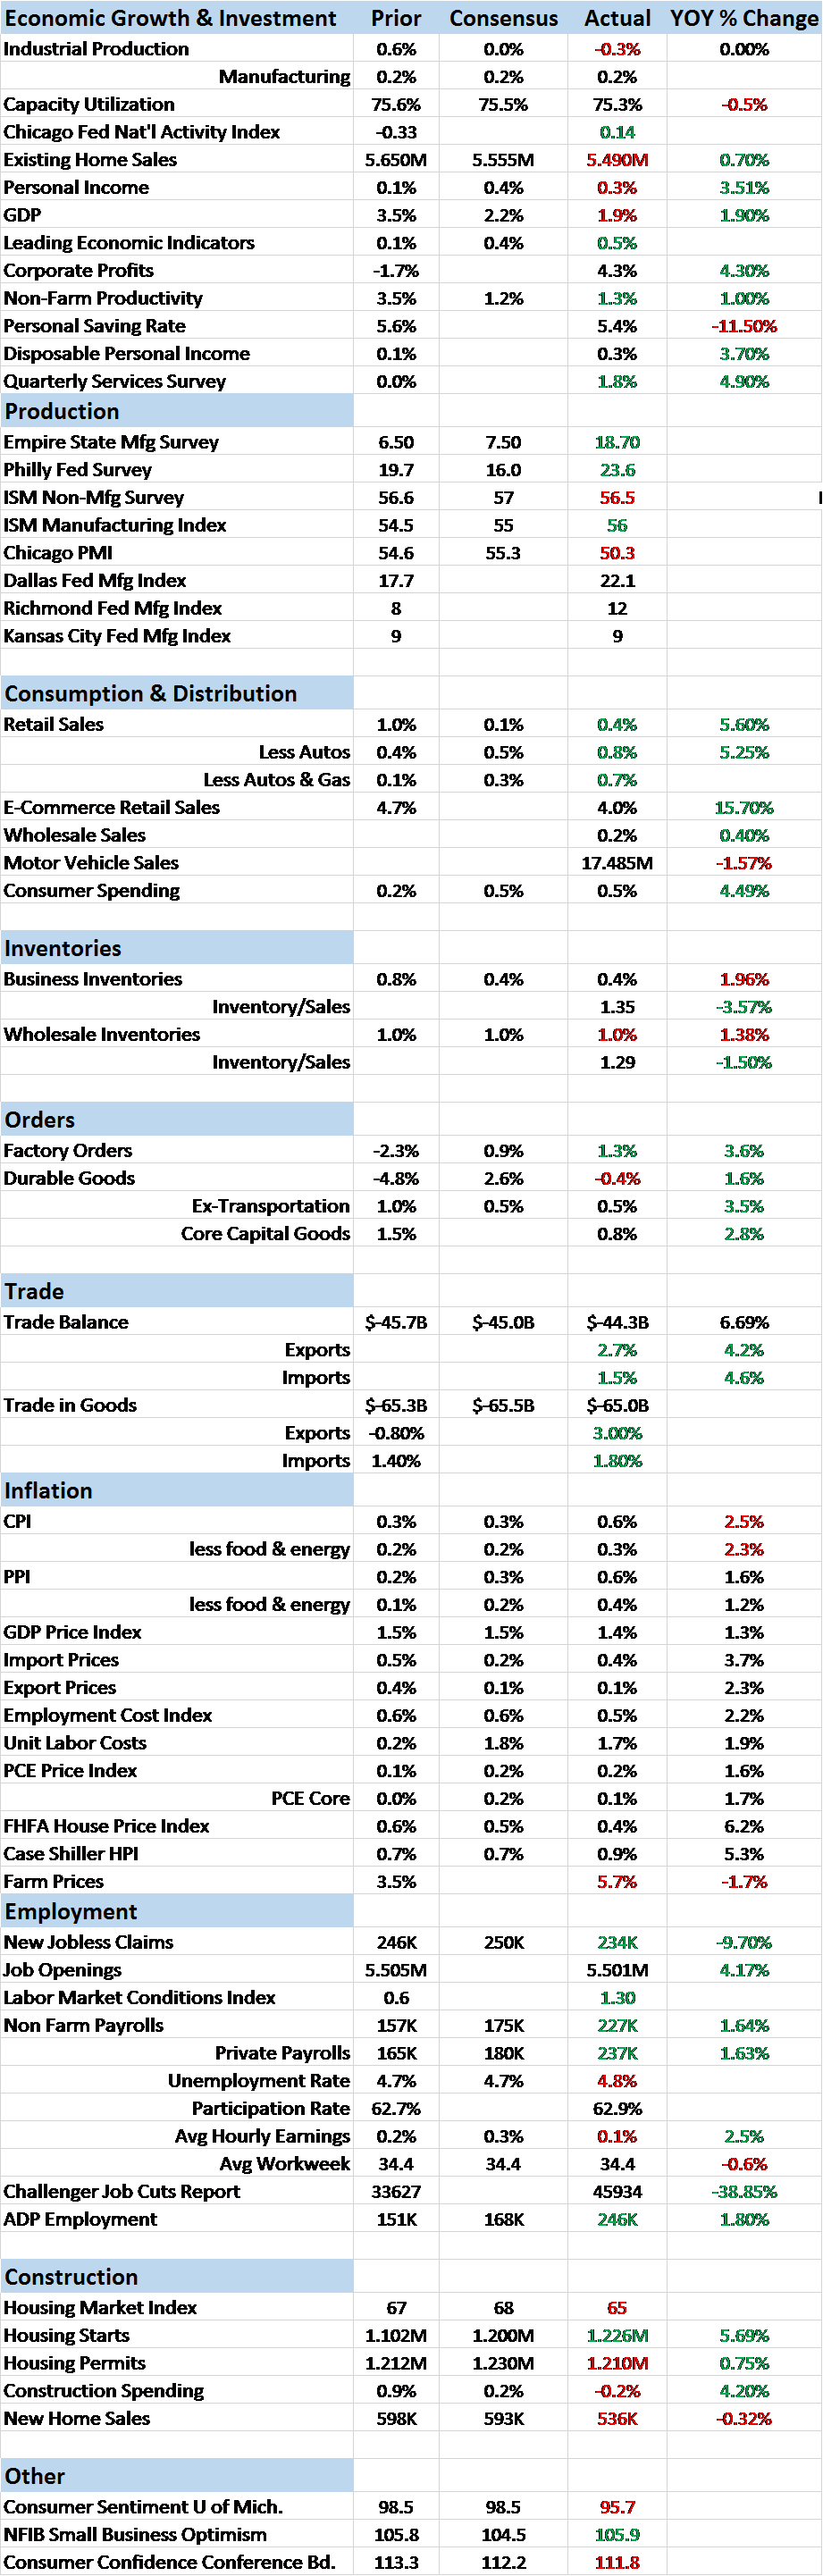
The economic data since my last update has improved somewhat. It isn’t across the board and it isn’t huge but it must be acknowledged. As usual though there are positives and negatives, just with a slight emphasis on positive right now. Interestingly, the bond market has not responded to these slightly more positive readings with nominal and real yields almost exactly where they were in the last update 3 weeks ago. In other words, there’s no reason – yet – to believe this is anything more than one of the number of blips higher we’ve seen over the last few years. I will say though that this one appears to be a little more global than some of the other ones so maybe it will have more legs.
To be specific, what appears to have picked up is consumption. And that would make sense given the change in consumer sentiment since the election. Consumer spending has accelerated to about 4.5% year over year and retail sales are running over 5% ahead of last year. Inventories at all levels are rising but inventory/sales ratios have fallen as sales have outpaced the inventory build. Unfortunately, pay is not keeping pace with spending and the savings rate has dropped as a result. The surge in spending is of course having an impact on factory orders/durable goods which are all in positive territory year over year now. It has shown up in prices, producer and consumer prices both coming in a little hot this month.
But before the Keynesians start taking their victory laps and assuming that with aggregate demand picking up we’re out of the woods, one might consider two areas that appear to have peaked – housing and autos. These are kind of the heavyweights of consumption and neither right now is moving higher. Existing and new home sales were both disappointments in their last reports. The just released Housing Market index showed that current sales are being maintained but traffic is now back in contraction after all of one month above the 50 level. New home sales are actually slightly less than they were two years ago.
Auto sales haven’t gone quite that long with no growth but they too appear to have peaked for the cycle. Sales today at 17.485MM are about the same as July 2015’s 17.521MM. It should be noted though that auto sales can plateau and stay at a high level for some time. In the last cycle, sales oscillated from 16 to 17 million for nearly 7 years before finally turning down for good going into the recession. The problem though is the lack of growth in an economy that has struggled just to get to a 2% growth rate.
One might also note that both autos and homes are interest rate sensitive and the Fed seems to want to hike rates a few times this year. Or at least that was the market interpretation of Ms. Yellen’s testimony to Congress this week. The consensus is around 3 hikes in 2017. I’ll take the under on that one and just note that lenders aren’t exactly swamped with mortgage applications right now and auto loan delinquencies are already rising. I suppose it is possible that the Trump administration and Congress could actually deliver an infrastructure package with real projects that can be started right away and make construction spending great again. Don’t laugh, it could happen.
As I said up top though this mini surge in activity does seem to have a global flavor to it so maybe that will make it more sustainable. Exports and imports have both turned positive year over year now and the export strength is centered in capital goods. I monitor economic data globally and there has been a definite upturn in data, especially in Europe. I’m not saying Europe has solved its structural, long term problems because it certainly hasn’t but it may be that we’re going to get a mini synchronized upturn. A lot of the improvement has been in sentiment type PMI data – as has the US by the way – but one can definitely see an upturn developing. Whether it can achieve escape velocity before the banking system implodes is a question I can’t answer.
On the big picture growth items though nothing has really changed. GDP growth slipped down to low to mid 1% range during the shale oil bust induced downturn of the last couple of years. Last quarter’s GDP was back up to 1.9% year over year. For it to get meaningfully beyond that for more than a quarter or two will require a positive change in the basics. That means better productivity growth and more work force growth (participation). We’re still striking out on the first one and the second one is going to be difficult to improve with baby boomer retirements and, well, Donald Trump. Could we get a few quarters above that 2% trend? A year? Sure we can and we may. But for now the bond market isn’t buying it and neither am I. There are a lot of factors involved in changing the productivity trend and the new administration has talked about addressing some of them with regulatory and tax reform. As I’ve said a number of times though I think those are harder to change than Mr. Trump and his supporters know. I’d be happy to be wrong about that but I’ve been watching politicians a long time and expecting them to do anything quickly and altruistically is just asking for disappointment.
| Let’s look at some of the market indicators. As I said, bond markets have barely budged since the last update. The 10 year note was trading at 2.5% when I wrote the last Bi-Weekly Economic Review (I know, I know; I need to get back on schedule but no movement doesn’t give me a lot to write about) and today as I write this it is yielding….2.5%. |
10 Year Treasury Yield July 2016 - February 2017 - Click to enlarge |
| The 10 year TIP was yielding 0.43% on January 25 and today it has moved up a whopping 2 basis points to 0.45% |
10 Year Treasury Inflation January 2012 - January 2017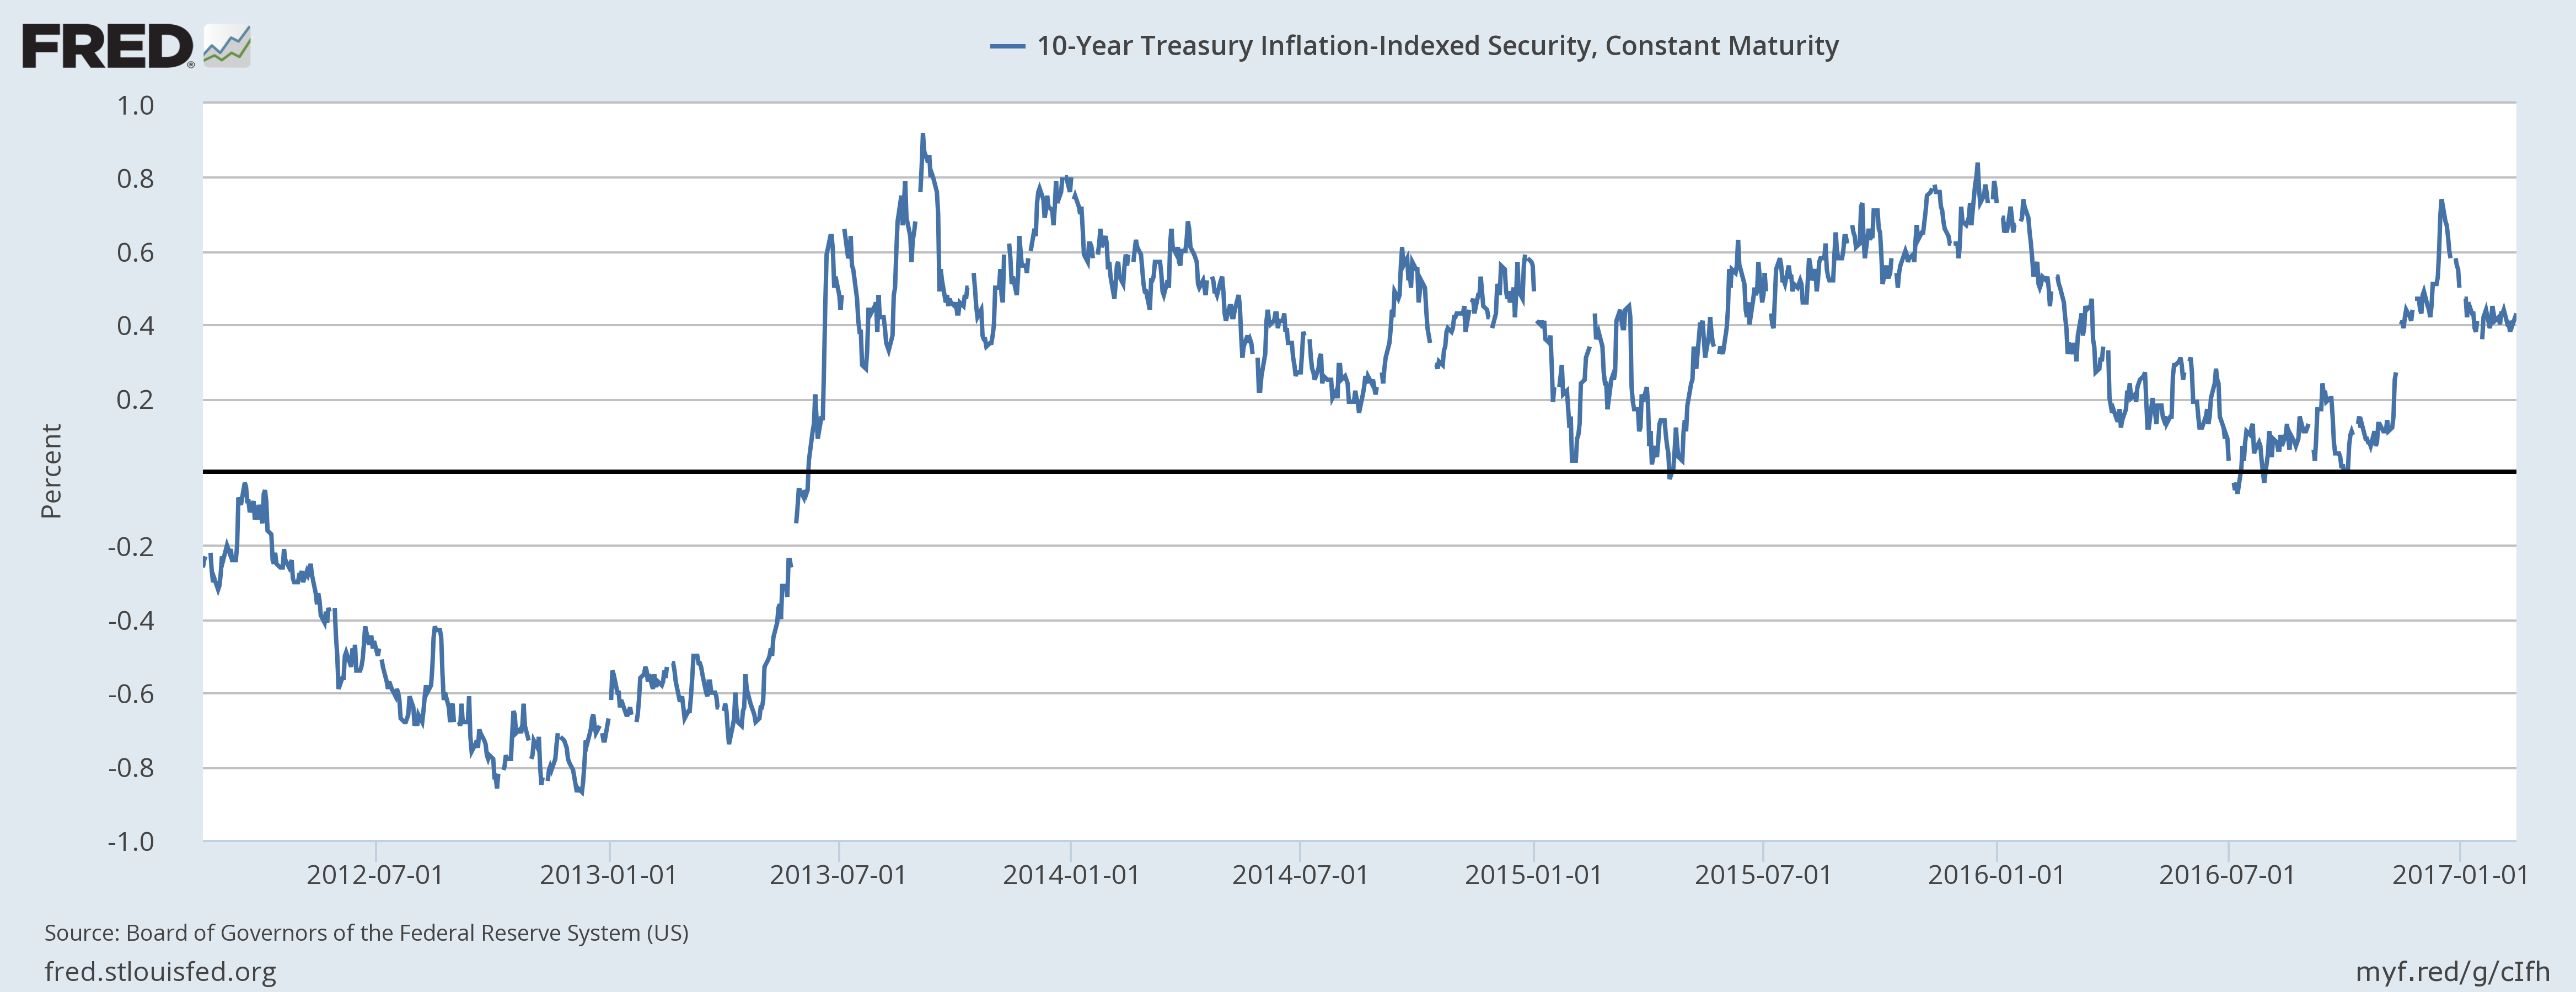 - Click to enlarge |
| And with little change in real growth or inflation expectations the yield curve has barely moved either: |
10 Year Treasury Constant Maturity January 2012 - January 2017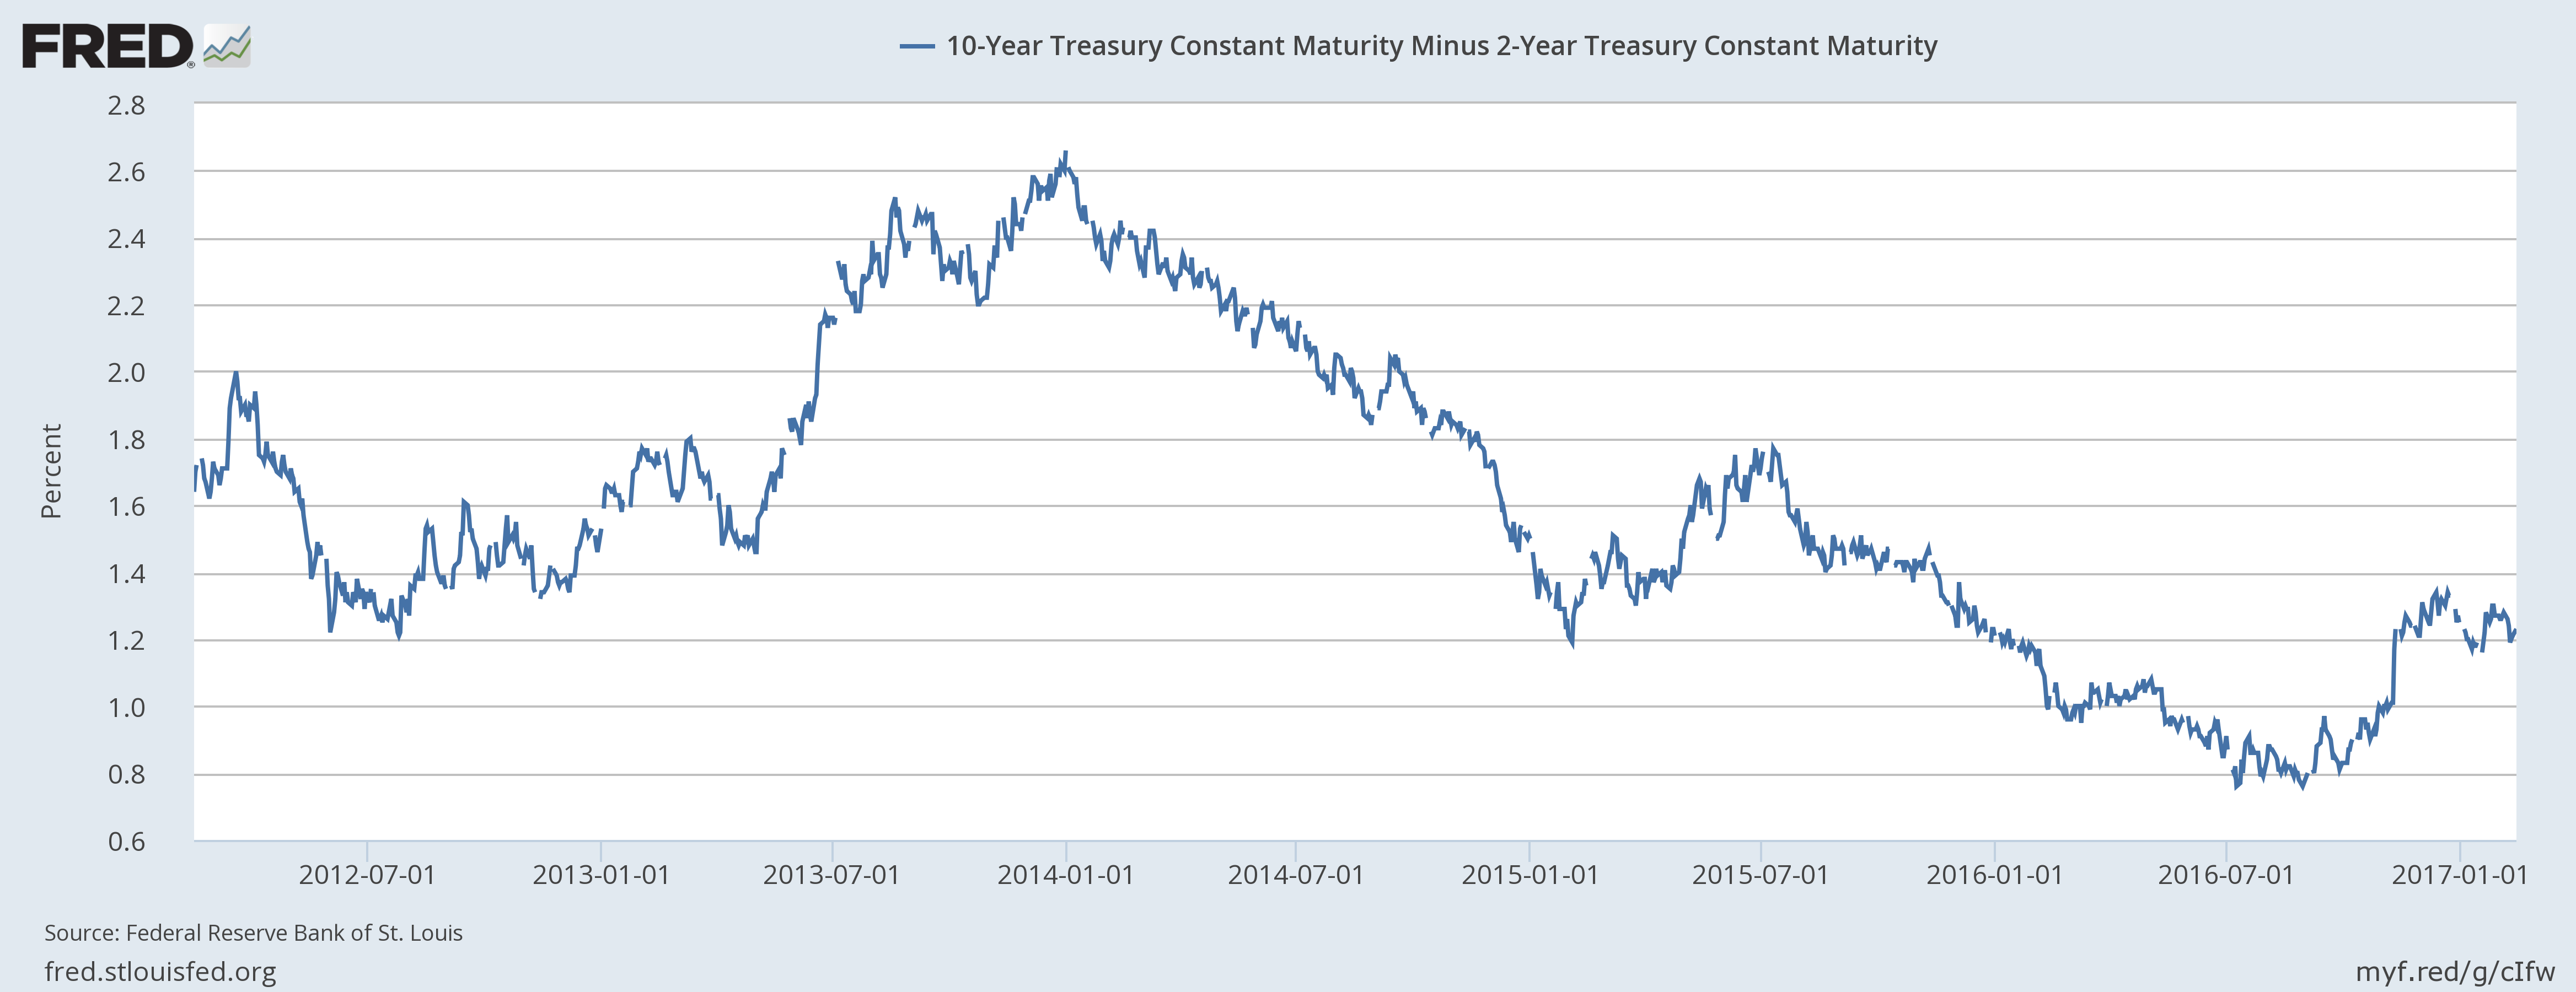 . |
| One area that did continue to improve was credit spreads. That makes sense as it is an indication of risk appetite which the stock market confirms is in ample supply: |
BOFA Merrill Lynch US High Yield Option Adjusted Spread January 2012 - January 2017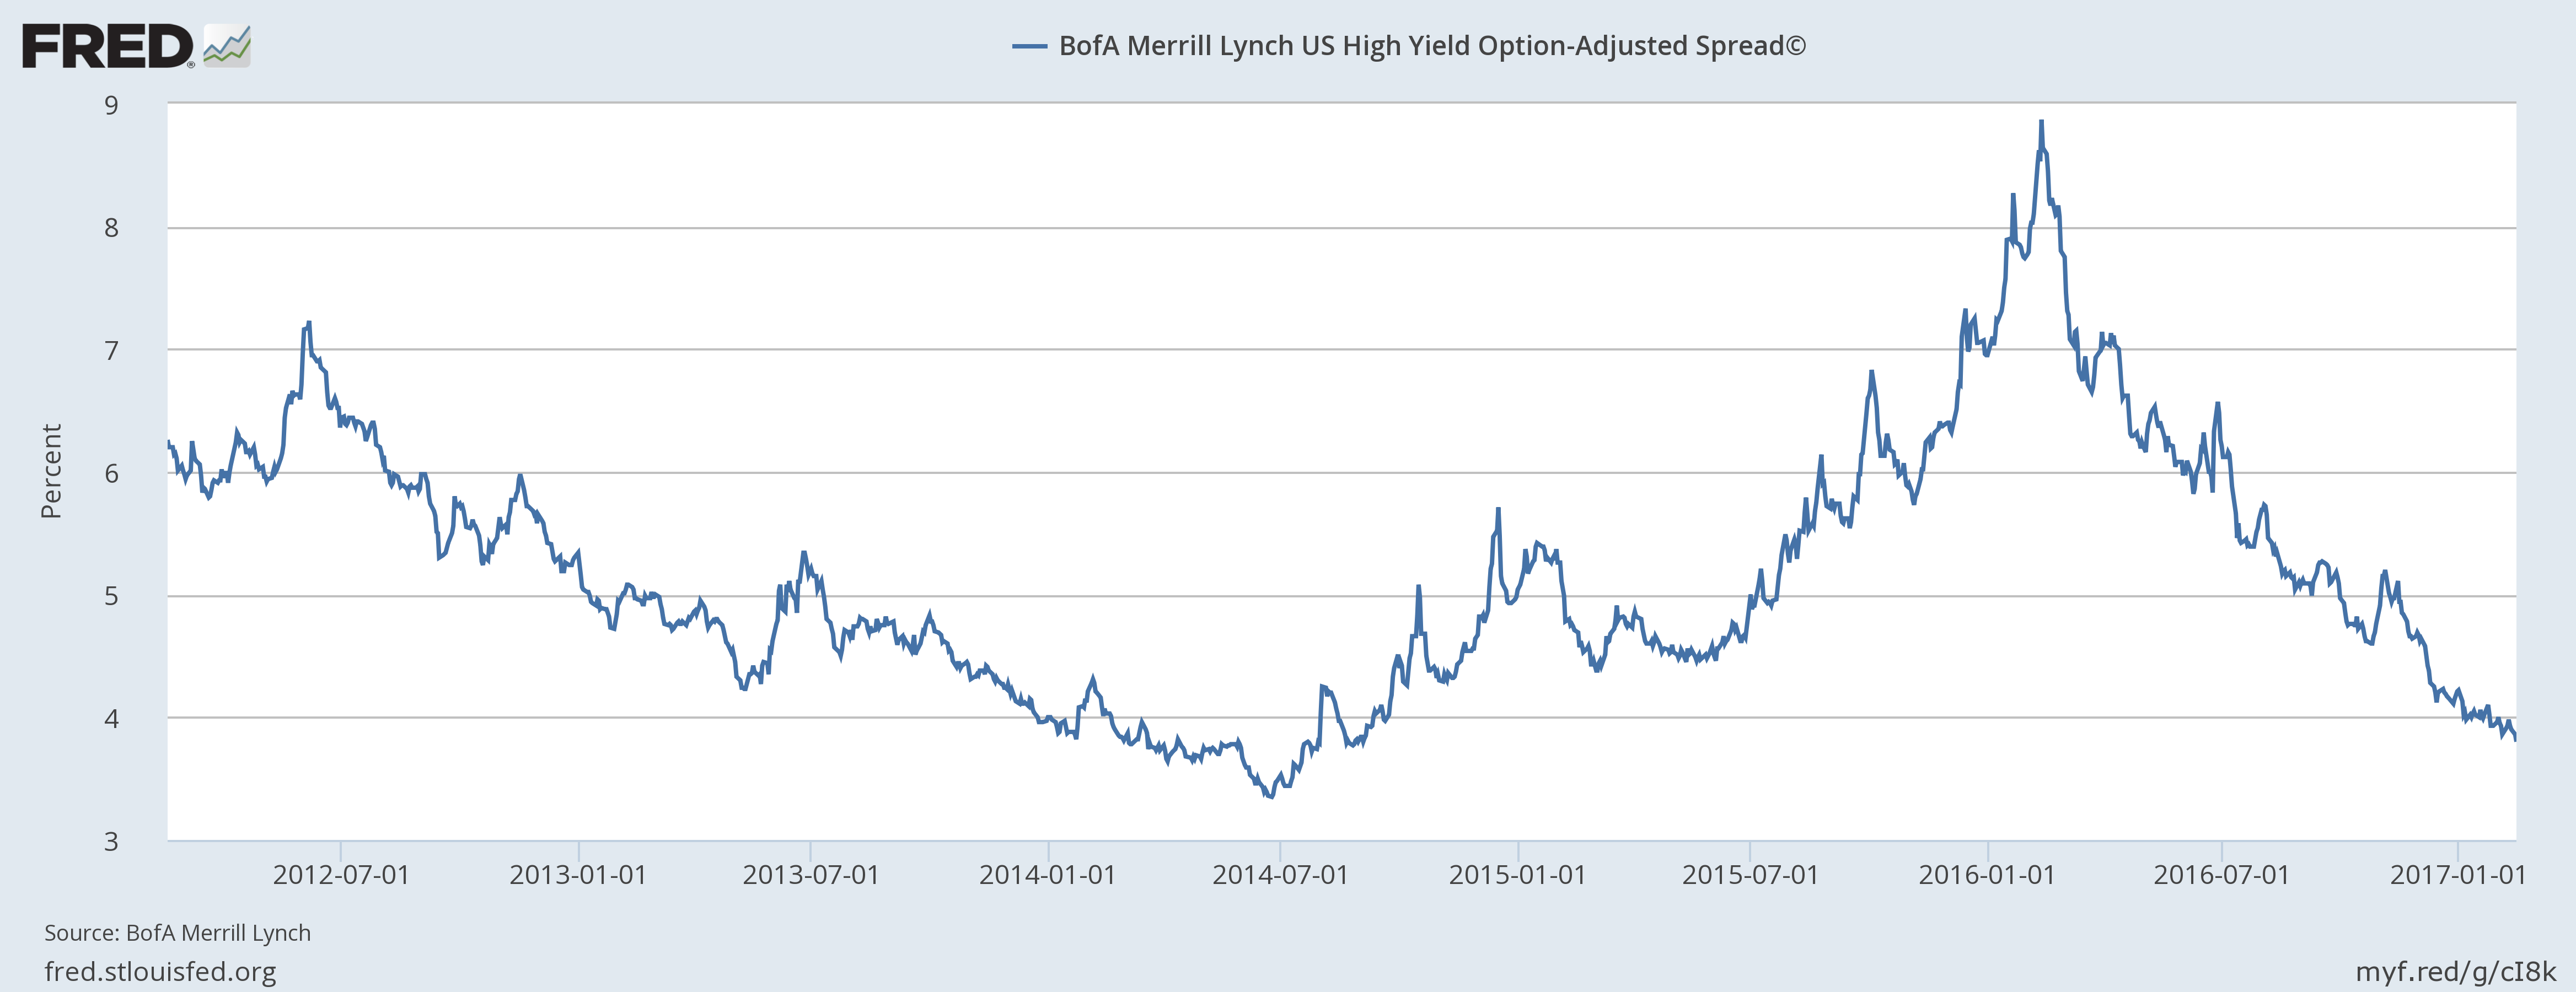 - Click to enlarge |
| The dollar continued to fall after the last update but has rebounded slightly recently. It is still slightly lower than the last report though. |
US Dollar Index July 2016 - February 2017 - Click to enlarge |
| And long term momentum still says it is peaking. The Trump administration’s dollar policy is, to be polite, confused. I’m not sure the President knows what he wants but I’ll stand by my earlier prediction that, like most populists, he will opt for a weaker currency. |
US Dollar Index Monthly 1998 - 2017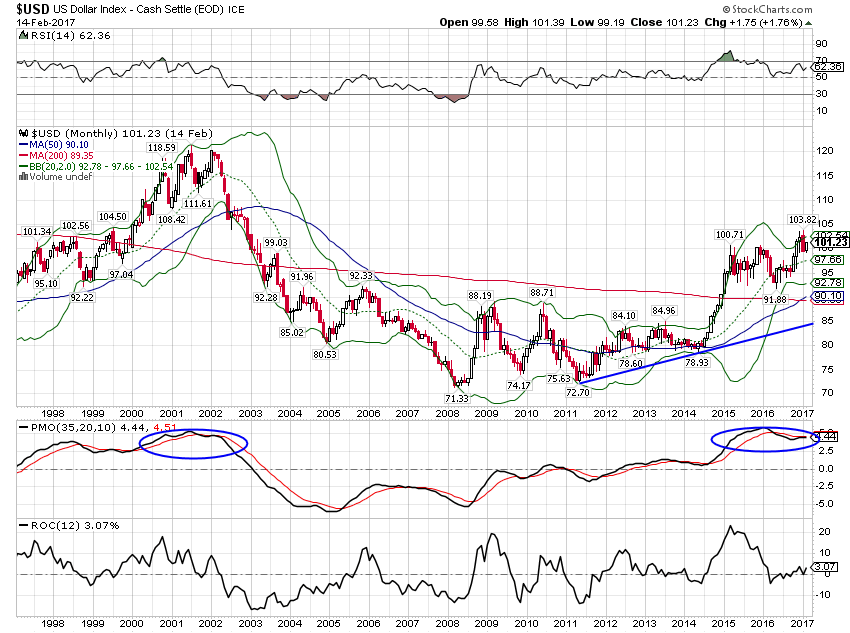 - Click to enlarge |
| Gold responded to the dollar and rallied since the last update: |
Gold Daily July 2016 - February 2017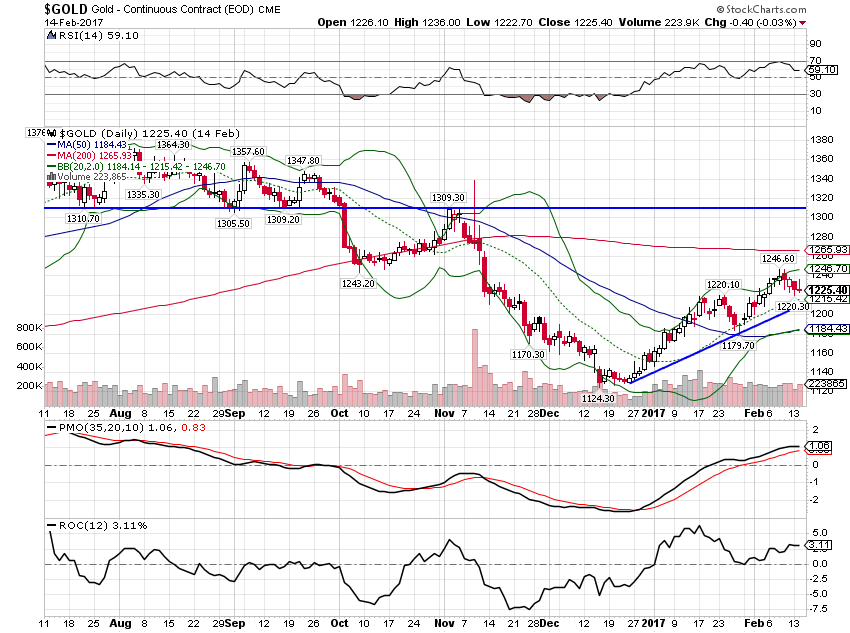 . |
| The long term trend is intact: |
Gold 2005 - 2017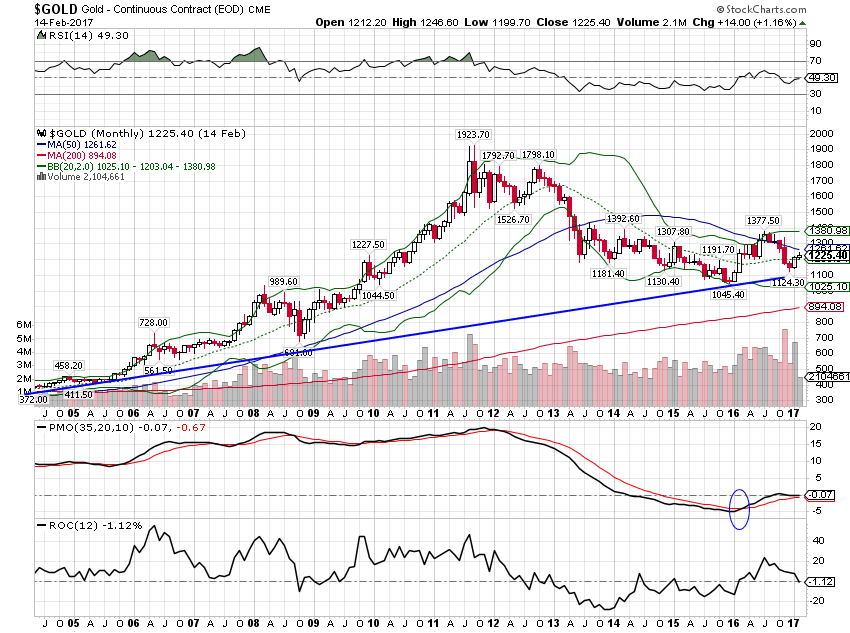 - Click to enlarge |
| About the only market that continues to expect a growth acceleration is the stock market which has gone kind of bananas lately. I’m not sure what stocks are discounting. The hereafter maybe. |
S&P 500 Large Cap Index July 2016 - February 2017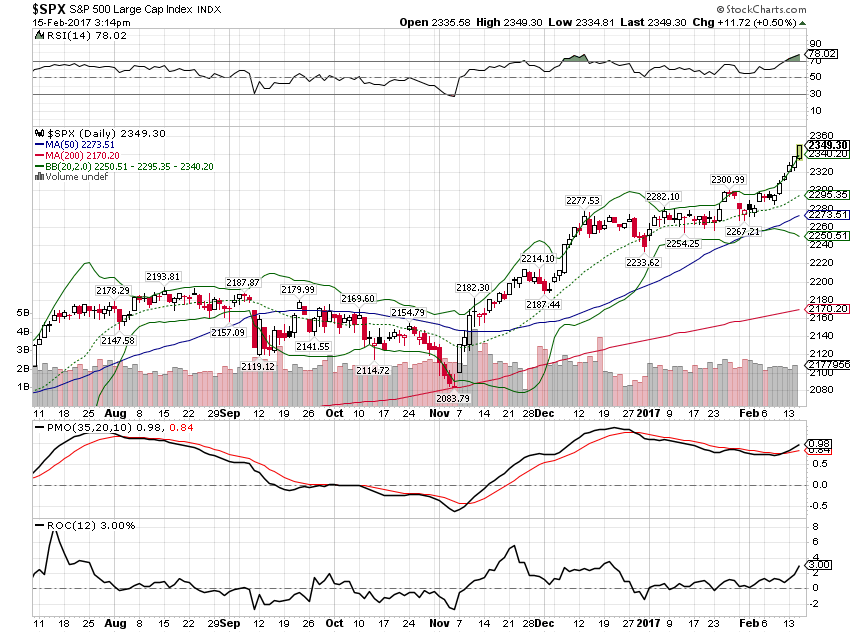 - Click to enlarge |
The economic data has improved mildly but nowhere near enough to justify the move in stocks. None of the bond markets we watch confirm anything like the growth being discounted by stocks. Neither do the currency markets or the gold market. And although I didn’t post a chart, neither do the general commodity markets. It may be that stocks have it right and all these other markets are wrong. If so, these markets will adjust to reflect the new growth path. But it hasn’t happened yet and I place a lot more emphasis – and put a lot more faith – on bond and currency markets.
I would also add that a lot of the move in stocks is based on expectations regarding the Trump administration’s tax plans. The market had pretty well stalled until the President’s comment that the administration’s “phenomenal” tax plan would be out in a few weeks and it has been straight up since. I am frankly at a loss to explain how anyone could buy based on that thin reed but apparently anything will suffice for the bulls in this, our latest irrationally exuberant market. All I can say is, caveat emptor.
Tags: Alhambra Research,Auto Sales,Bi-Weekly Economic Review,Bonds,commodities,consumption,credit spreads,Dollar Index,economic data,economic growth,economy,Gold,Housing,Janet Yellen,Markets,newslettersent,stocks,Yield Curve