


Pater Tenebrarum
My articles My siteAbout meMy videosMy books
Follow on:TwitterSeeking AlphaFacebook
Mini-Panic Over Inflation After Trump’s Election VictoryWe have witnessed truly astonishing short term market conniptions following the Donald Trump’s election victory. In this post we want to focus on one aspect that seems to be exercising people quite a bit at present, namely the recent surge in inflation expectations reflected in the markets. Will we have to get those WIN buttons out again? A 1970s “whip inflation now” button. The only thing that was actually needed to “whip inflation” was for the Federal Reserve to stop printing money in ever greater quantities (or to stop supporting rapid money creation by the commercial banking system). It started doing so about 2 years before Mr. Paul Volcker took the helm – true money supply growth began to slow down considerably. Volcker then exacerbated this slowdown and briefly even pushed broad true money supply growth into negative territory. By that time, the decline in price inflation had already gotten underway and the public’s inflationary psychology soon underwent a sea change – right on the eve of one of the strongest increases in manufacturing productivity in modern history. |
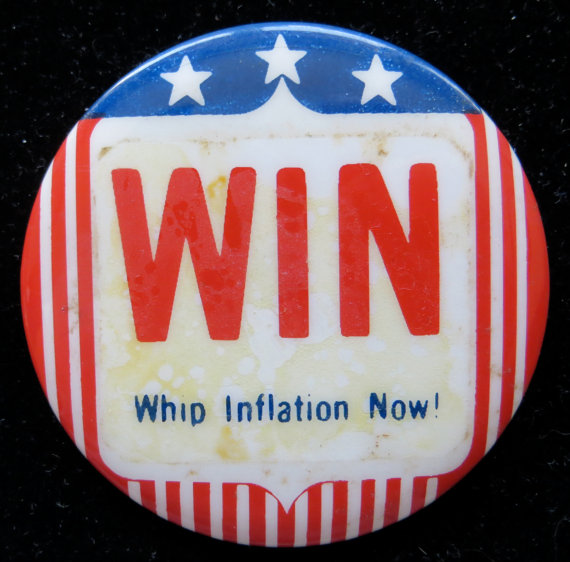 Whip Inflation Now! - Click to enlarge |
| As far as we understand it, the current narrative approximately consists of the following:
Because Trump unexpectedly helped the otherwise hapless Party of the Republican Fearful to actually achieve a clean sweep in the election, it is widely assumed that he will be able to push through most of his agenda. Of course election promises cannot always be fulfilled – even if the president is willing. The market action since the election reflects expectations that US government spending, budget deficits and public debt are likely to soar, presumably based on the idea that the proposed combination of large-scale infrastructure spending and tax cuts will squeeze the federal budget from two sides. Given Trump’s stance on international trade, there is likely also some trepidation regarding future import prices. Moreover, China is high on the list of Trump’s targets with respect to trade. A significant decline in China’s trade surplus with the US would put renewed pressure on its foreign exchange reserves. China remains the largest US creditor though, and has already turned into a seller of treasury securities. Although we believe the importance of this fact is overestimated, the prospect of China potentially increasing its selling of treasuries further may well be coloring market perceptions to some extent. |
Treasury Bon Yields Treasury bond yields were already in an uptrend prior to the election, which has accelerated rather noticeably since then - Click to enlarge |
| Most indicators of market-based inflation expectations were already in an uptrend well before the election. Similar to the trend in bond yields, this has now accelerated. Note that the term “inflation expectations” in this context strictly refers to expectations regarding the future rate of change in CPI. It does not refer to actual inflation, i.e., the expansion of the money supply.
Below are several charts illustrating the situation: |
Five Year Breakeven Inflation Rate The five year breakeven inflation rate has moved back to levels last seen in the summer of 2015. This may not seem particularly noteworthy at first glance, but the current level of 167 basis points is 80% higher than the low of 93 basis points recorded in February of this year - Click to enlarge |
| Along similar lines, the 5 year/ 5 year forward inflation rate (which reflects 5 year inflation expectations from a point in time 5 years in the future) has jumped quite a bit as well: |
Forward Inflation Expectation Rate The 5 year/ 5 year forward inflation expectation rate has also trended up since early 2016. The move circled in red represents the “Trump jump” - Click to enlarge |
| Another perspective is provided by the TIP/TLT ratio. This ratio compares the prices of ETFs tracking long term inflation-protected securities and “normal” long term treasuries. A rising ratio means that TIPs are outperforming treasuries in terms of price, which means the yield differential between these securities is widening as well (i.e., treasury yields are increasing relative to TIPs yields).
This is typically the result of rising inflation expectations, as TIPs are specifically designed to protect investors against an increase in future CPI growth rates. To be sure, the rise in the ratio is a fairly recent phenomenon as well – it was mired in a strong downtrend from early 2012 until July of this year (incidentally it has diverged from other indicators of inflation expectations in the process, by making a lower low in the summer in the wake of the Brexit referendum). |
Proxy for Inflation Expectations The ratio of TIP to TLT is a useful proxy for long term inflation expectations. It has recently increased sharply as well - Click to enlarge |
The Yield Curve and Recession ProbabilitiesIt remains of course uncertain whether the expected increase in price inflation on account of Trump’s policies will actually materialize. As noted above, much will depend on the extent to which he will be able and/or willing to implement his proposals. Let us hypothetically assume though that the Trump presidency will actually serve as a “trigger” for rising consumer price inflation. What remains to be considered in that case is whether the Fed will remain “behind the curve” or not. The Fed would certainly love to tighten policy, mainly in order to have some leeway to cut rates again when the next recession begins. Let us briefly look at the yield curve in this context, or rather a specific part of it, namely the difference between 10 year and 2 year treasury note yields. The standard view is that a steepening yield curve is “good for the economy”. This is actually not quite correct. Let us consider what a steepening yield curve actually means. Steepening can happen in two ways: one is that the central bank is cutting administered interest rates and short term rates decline faster than long term ones. Long term rates usually remain comparatively higher in this scenario, because long term inflation expectations tend to increase when the central bank loosens monetary policy. The other possibility is that inflation expectations rise for other reasons. In short, a steepening yield curve is primarily another proxy for an increase in long term inflation expectations. In a certain sense the notion that a steepening curve is “good for the economy” is not entirely wrong, as monetary pumping by the Fed will tend to set the boom portion of the boom-bust cycle into motion – albeit with a noticeable lag. Even though the economy tends to consume real wealth during boom periods driven by credit expansion, these periods are of course associated with an increase in economic activity and positive aggregate economic data. |
The Yield Curve is Steepening Rapidly The yield curve has begun to steepen rather noticeably after flattening quite a bit from its early 2011 post-crisis peak to the lows made this year - Click to enlarge |
| Obviously thougfh, large rate cuts are usually not implemented unless the Fed wants to counter a beginning recession. The empirical record shows that as a boom progresses, the yield curve will increasingly flatten, often until it inverts. Once the trend clearly reverses to steepening again, a recession signal is actually given.
So initially, the steepening of the yield curve is actually “bad” for the economy, at least from a mainstream perspective. Of course, in the wake of the distortions wrought by a boom, a reorganization of the economy’s production structure and the associated liquidation of malinvested capital is in reality not “bad”, but rather “badly needed”. It is the only way to restore the economy to a sound footing. This healing process will obviously involve a bust though. It takes time for the economy to become realigned with the proper balance between production, consumption and savings again that reflects reality rather than the Potemkin village of the artificial credit-induced boom. During bust periods, we will as a rule see a rapid steepening of the yield curve (a side note: this is particularly relevant in a central bank-administered fiat money system). Obviously, the above chart immediately raises an important question: should we not see an inversion of the yield curve prior to the reversion to the steepening trend that gives us the heads-up that a recession 8is not very far offf? This is actually an example that illustrates that one must always keep contingent circumstances in mind when interpreting historical economic data. We have actually discussed this question in a previous article (see “The Yield Curve and Recessions” for details). Japan’s experience suggests that once the central bank implements zero interest policy (ZIRP), yield curve inversions no longer occur prior to recessions (see also this chart). In fact, the last time Japan has seen an inverted yield curve was prior to the bubble peak of the Nikkei in late 1989. There have been six recessions in Japan since then – and five of them were not preceded by yield curve inversions. |
The Yield Curve and Recessions The Yield Curve and Recessions - Click to enlarge This long term chart of the 10 year minus 2 year treasury yield spread illustrates the point made above. During boom periods, the curve tends to flatten. Usually it will eventually invert and not too long thereafter begin to steepen again. This trend change toward steepening actually constitutes a recession warning – recessions usually tend to begin with a lag of 6 to 18 months following the reversal of the trend. The yield curve then continues to steepen throughout the official recession period and beyond (note that the double-dip recession under Volcker constitutes an exception to the rule, as it involved no such time lag. This was mainly due to the Fed maintaining a very tight policy stance even after the start of the recession) – click to enlarge. |
Conclusion
The recent reversal of the yield curve from flattening to steepening may well constitute a recession warning, even if it is not conclusive yet. Considering the weakness of the post GFC economic recovery, the poor performance of the manufacturing sector and the downturn in private investment we have discussed in these pages on previous occasions, this potential warning should definitely not be dismissed though.
What is likely to happen if the markets are correct in anticipating an upturn in consumer price inflation and an economic downturn strikes concurrently? In that case we think one should definitely expect the Fed to remain “behind the curve” and negative real interest to persist as a result. After all, the current economic orthodoxy once again appears to consider stagflation an impossibility.
This is to say that a rise in consumer price inflation during an economic downturn would likely be regarded as a strictly temporary phenomenon, giving the central bank a reason to maintain loose monetary policy. As a side note: we are never trying to suggest “better plans” for the central planners at agencies like the Fed. We are merely trying to forecast their likely reactions to certain developments based on what we know about their views and actions to date.
This would essentially be the worst possible outcome for the economy and the financial markets. One factor that may indicate that it won’t happen just yet is the broad consensus that has rapidly formed regarding the inflation outlook (see Mish’s discussion of this point here). Still, we believe for a number of reasons that the probability of a return of stagflation has indeed increased in recent years. It is a topic we are definitely going to revisit.
Charts by: StockCharts, St. Louis Federal Reserve Research
Full story here Are you the author?
Tags: Chart Update,newslettersent,On Economy


