Marc Chandler
My articles My offerMy siteAbout meMy videosMy books
Follow on:LinkedINTwitterSeeking AlphaAmazon
George Dorgan
My articles My siteAbout meMy videosMy books
Follow on:LinkedINTwitterSeeking Alpha
CFA SocietyEconomicBlogs
Summary:
Net migration of Mexicans into the US has fallen for a decade.
The surge in Mexican migration into the US followed on the heels of NAFTA.
Although Trump has bounced in the polls, and some see this as negative for the peso, rising US interest rates and the slide in oil price are more important drivers.
| There has been much discussion in the US presidential campaign about immigration, especially from Mexico. Trump has proposed a wall for the 2000 mile border. Different types of fences are on about a third of the border as it stands today.
However, as this Great Graphic, from Pew Research shows, Mexican immigrants may have been a problem previously, but for the past decade (2005-2014) more Mexicans have left the US than entered (hat tip to Philip Bump). In 1995-2000, there were a little more than two and a quarter million Mexicans that migrated to the US. In the 2005-2014 period 160k net have returned to Mexico. What happened in the second half of the 1990s? One word: NAFTA. The apparent immigration problem may have really be a function of US trade policy. Recall that under NAFTA, Mexico had to remove much of their supports and subsidies for agricultural products. This was particularly hard on Mexico’s corn growers. In turn, it appears that many Mexicans that came to the US in the second half of the 1990s came from the corn growing region. At the same time, it is true that some of the traffic on the US-Mexican border is not from Mexico, but from other countries in Central America. These include El Salvador, Guatemala, and Honduras. However, these are small countries and the numbers are small. In 2014, the last year of complete data, the largest number of migrants are from (gross flow not net) India (147.5k) and China (132k). Not be confused with the facts on immigration, a number of market participants continue to see the US presidential election as a factor that is influencing the vagaries of the Mexican peso. The recent slide in the peso (the US dollar has risen from ~MXN18.26 in the middle of last week to MXN19.20) has coincided with the pullback in oil prices, higher yields, and a little firmer Trump poll numbers. Nate Silver’s Fivethirtyeight.com indicates that based on current polls, the odds of Clinton becoming the next US President is about 69%. A month ago, it was around 88%. The US dollar appears to be finding support around the previous resistance at MXN19.00. |
Net migration from Mexico 2009 to 2014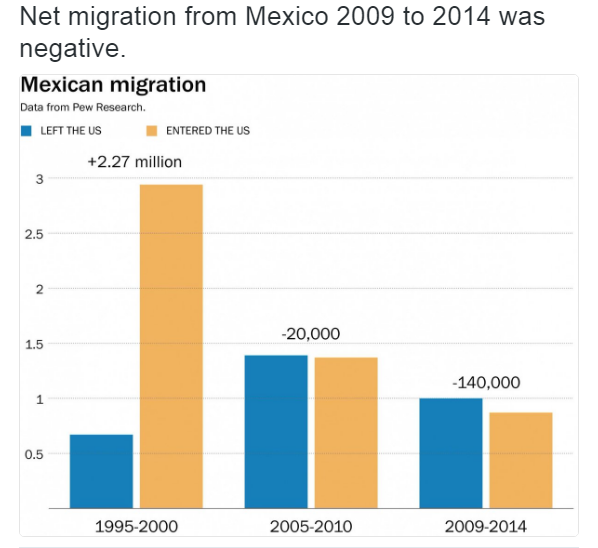 Net migration from Mexico 2009 to 2014 - click to enlarge. - Click to enlarge |
Full story here Are you the author?
Tags: Great Graphic,Mexico,MXN,newslettersent