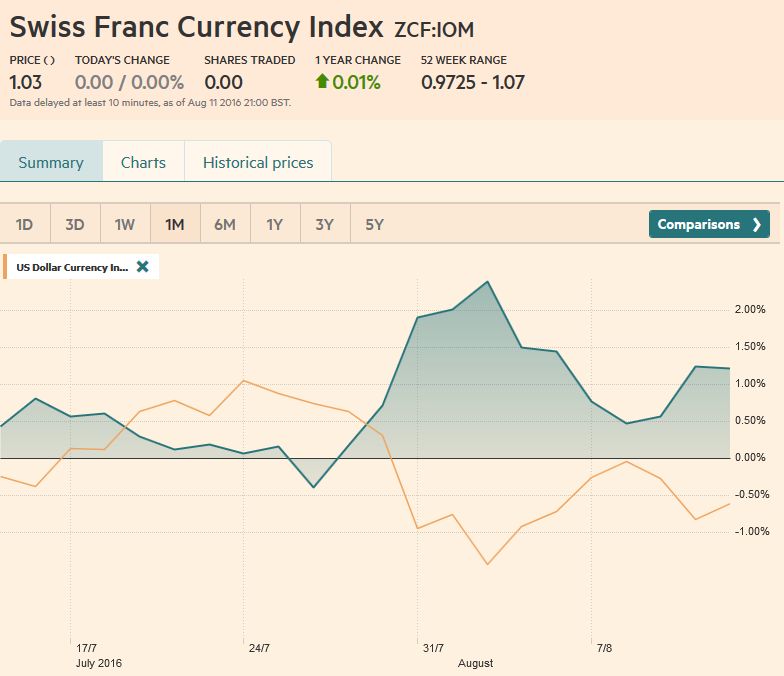
Swiss Franc Currency IndexThe CHF index experienced its first good week since many weeks, when we compare it against the dollar index. It is up 1.25%, while the USD index lags with -0.50%.
|
|
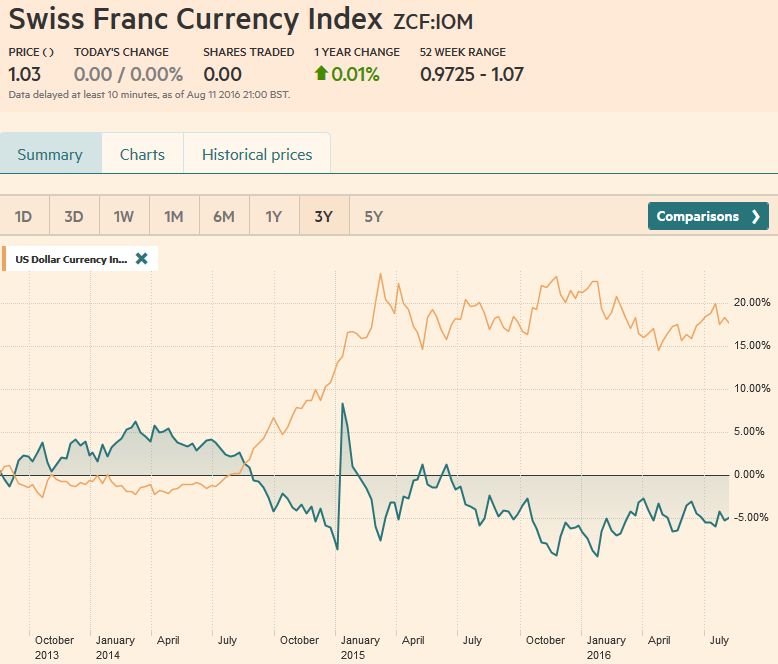
Swiss Franc Currency Index (3 years)The Swiss Franc index is the trade-weighted currency performance (see the currency basket)On a three years interval, the Swiss Franc had a weak performance. The dollar index was far stronger. The dollar makes up 33% of the SNB portfolio and 25% of Swiss exports (incl. countries like China or Arab countries that use the dollar for exchanges). Contrary to popular believe, the CHF index gained only 1.73% in 2015. It lost 9.52% in 2014, when the dollar (and yuan) strongly improved.
|
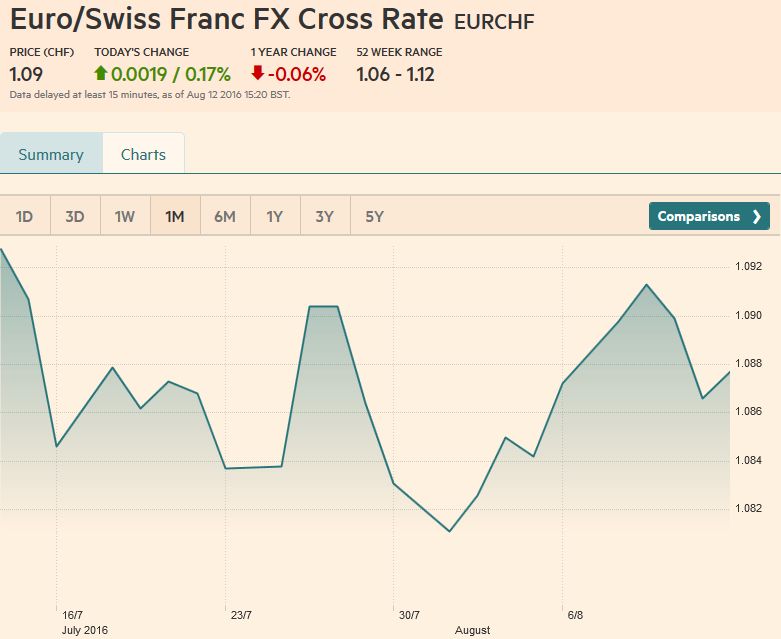
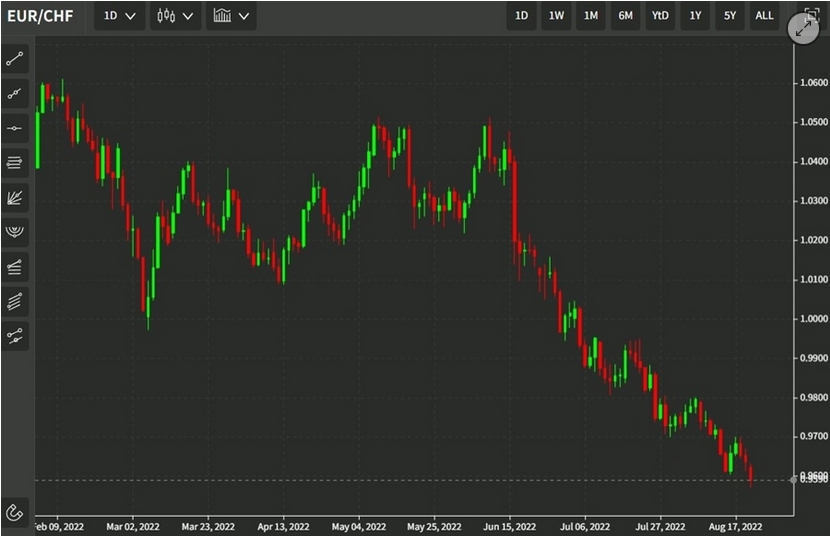
EUR/CHFOver the week, the EUR/CHF fell. We are not so constructive any more because of the big divergence between German GDP growth and the rest of the euro-zone. A stronger German economy is positive for CHF, because of the tight trade connection between Germany and Switzerland (more here).
|
FX Rates August 8 to August 12, 2016 |
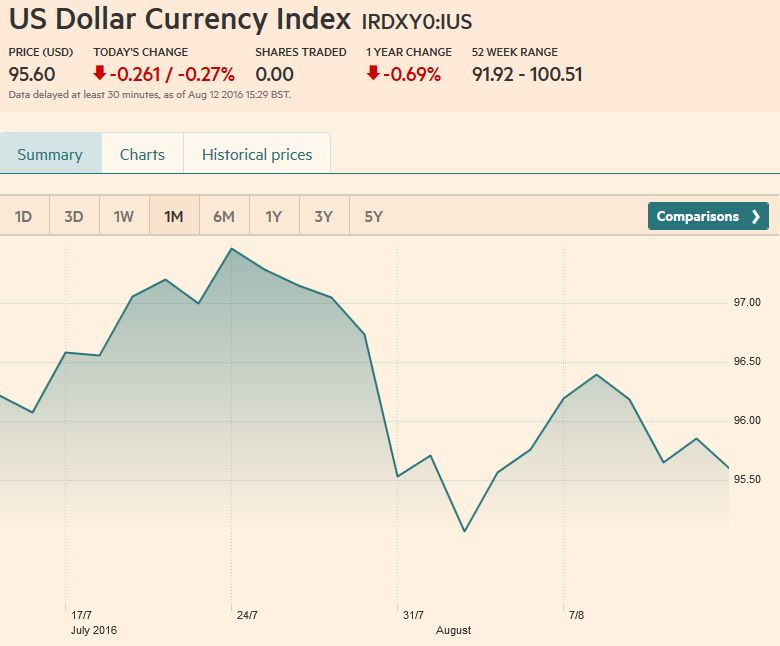
US DollarThe dollar’s push lower that we anticipate until later in the month gained momentum following the disappointing US retail sales report before the weekend. The dollar’s technical tone has deteriorated, while the economic data is unlikely to be sufficient to reverse sentiment.
The Dollar Index managed to recouped about half of the retail sales induced fall. A break of the 95.00, the low from the start of the month, would be a bearish sign, signaling a potentially quick move to 94.50, but there is potential toward 94.00. A the gapcreated by the UK referendum results found around 93.60-93.70 may also attract prices. Note that the trendline drawn off the May and June lows comes in near 94.20 by the end of next week.
|
FX Rates August 8 to August 12, 2016 |
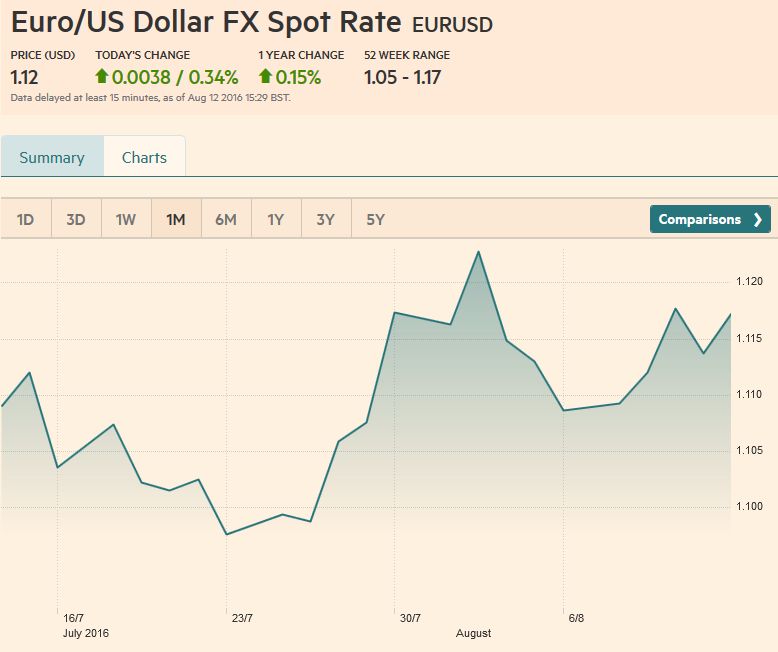
EUR/USDThe euro has been streaky, and this has frustrated many participants. Consider that last week it rose in four of the five sessions. The week before it fell in four of five sessions. The week before that it rose in four of the five sessions. The saw tooth pattern may end next week as the technical considerations suggest the risk is on the upside.
The euro finished last week with an outside day, but the close was weak, toward the middle of the range. The technical indicators mildly support constructive. The euro is approaching the downtrend line drawn from the May and June highs. It is found near $1.1260 at the start of the new week, which also corresponds with the 50% retracement of the down move since early-May. The 61.8% retracement is near $1.1350. Initial support is seen near $1.1130.
|
|
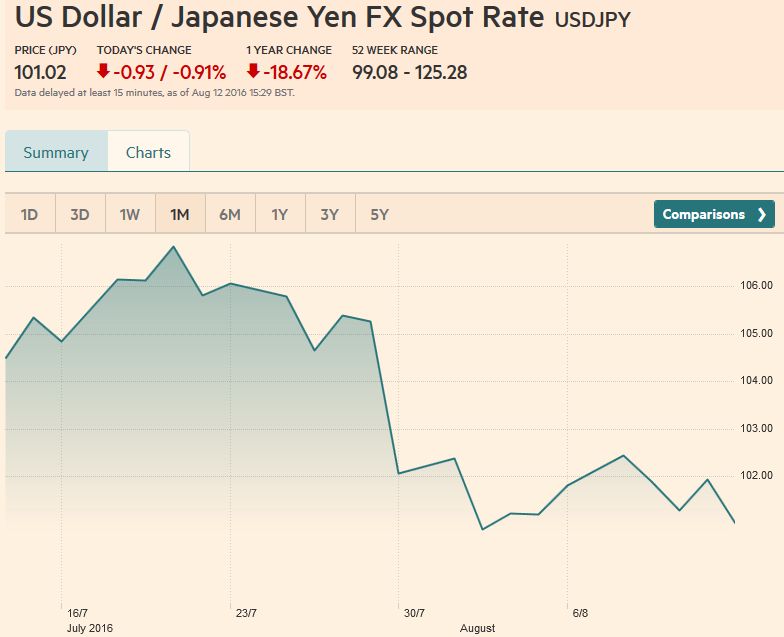
USD/JPYThe dollar also posted an outside day against the Japanese yen and the close was similarly uninspiring, toward the middle of the session’s range. It was turned back as it approached the upper end of its relatively narrow range, (~JPY102.50). On the downside, initial support is seen in the JPY100.65 area, but JPY100 is more important, especially psychologically. Among the technical indicators we look at, the slow stochastics may be warning of limited downside potential for the dollar.
|
|
GBP/USD
|
|
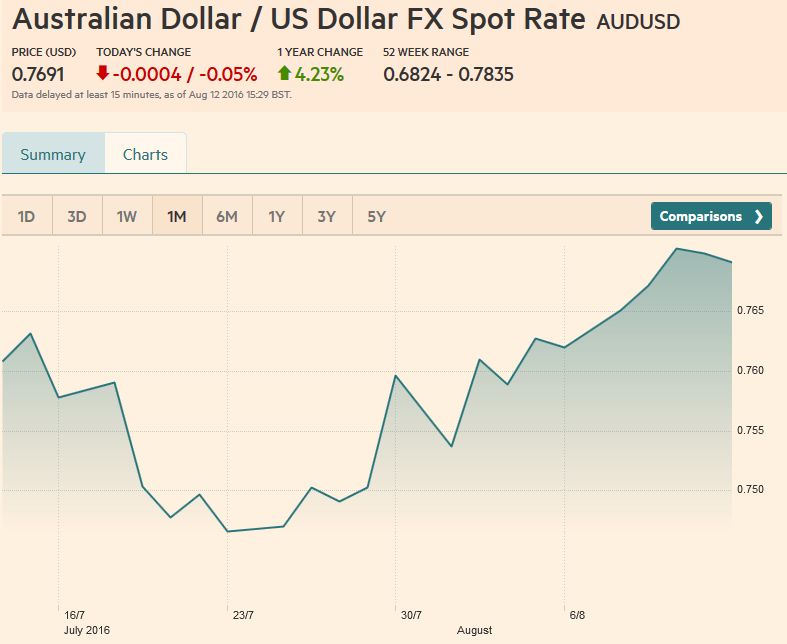
AUD/USDThe Australian dollar finished the week with two successive losses.
|
|
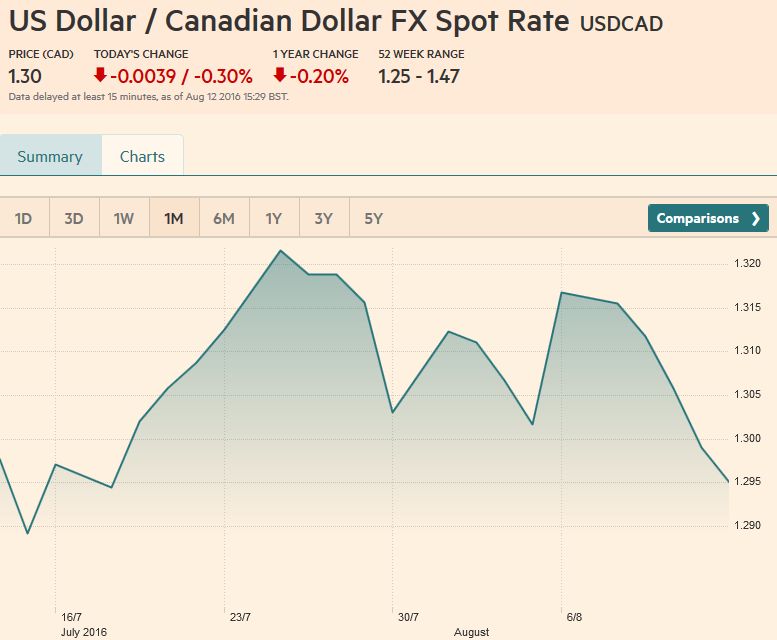
USD/CAD and NOKThe Canadian dollar was the second strongest major currency last week, rising about 1.7% against the greenback. The Norwegian krone outperformed it; rising 3.6% on the week. Nokkie was helped by unexpectedly strong inflation figures and the recovery in oil prices. The rise in oil prices and the recognition that the diverging US-Canadian July employment figures will not elicit a policy response buoyed the Canadian dollar. A trendline drawn off the early-May low and late-June low comes in near CAD 1.2885 at the start of next week, and is the immediate target. The US dollar fulfilled the 38.2% retracement of the gains off the early-May that was found near CAD1.2950. The 50% retracement is near CAD1.2860. The five-day moving average has crossed below the 20-day average, while the technical indicators point to additional greenback losses in the period ahead.
|
|
Crude Oil
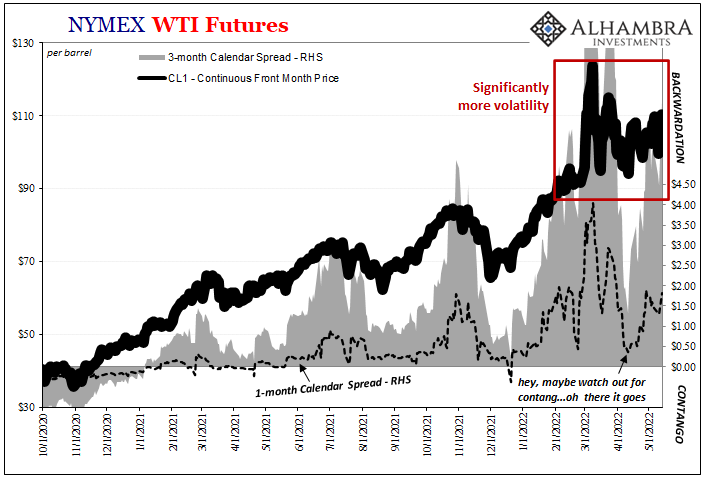
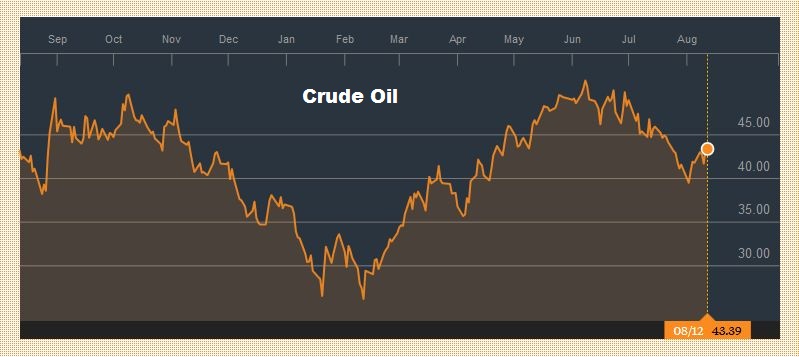
We are skeptical that an output freeze, let alone a cut in output, can be agreed to until Iranian output is closer to what it was before the embargo. This may take the rest of the year if not a bit longer. Open interest in the light sweet oil futures for October has surpassed September, so turn our analysis to it. It posted its largest weekly advance in four months (~6%). The technical indicators are constructive; more constructive in our opinion than fundamental factors. The MACD and RSI are trending higher, and the five-day average has crossed above the 20-day average for the first time since late-June. The October futures contract approached the 38.2% retracement
|
 Click to enlarge. Source Bloomberg.com |
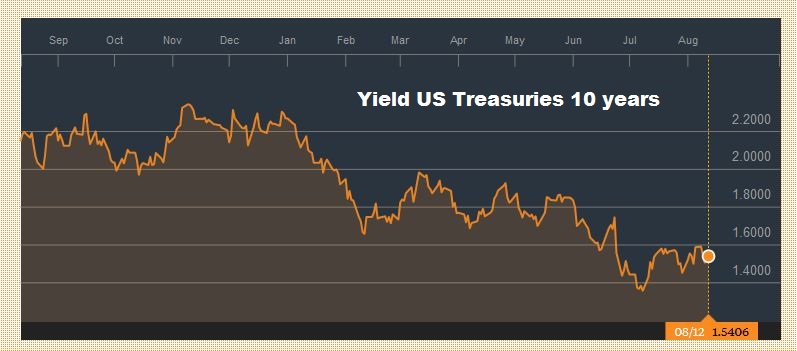
US TreasuriesUS 10-year yields began the week at the upper end of the recent range by 1.60%. It finished last week below 1.50% after the disappointing retail sales. A push below 1.45% would be an ominous technical development; warning of the risk of a return toward 1.30%. The September note futures runs into resistance in the 133-04 area. A move above here could target 134-00 to 134-07. Only a break of 131-16 would sour the technical tone.
|
 Click to enlarge. Source Bloomberg.com |
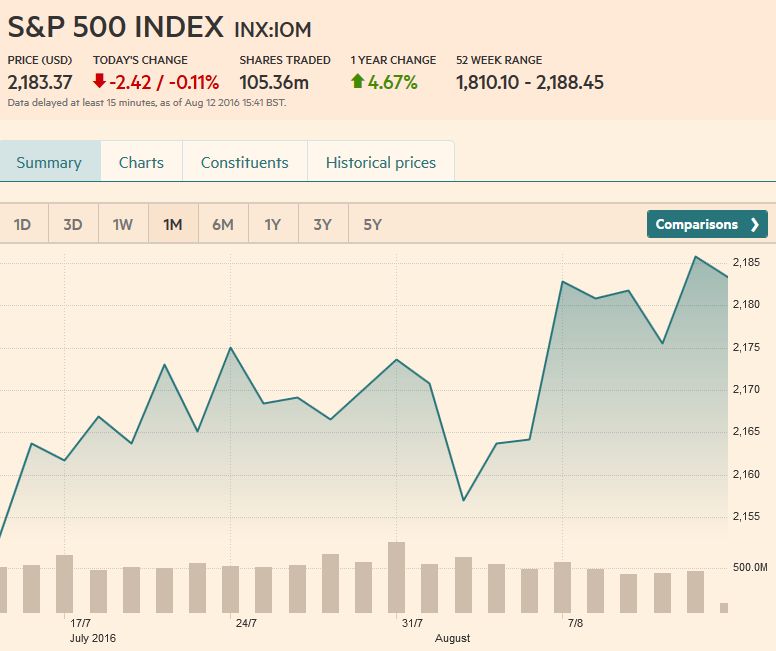
S&P 500The S&P 500 traded in narrow ranges last week (~2172-2188).
|
Charts and CHF data added by George Dorgan and the snbchf team, Text Posted by Marc Chandler on Marc to Markets,
Are you the author? Previous post See more for Next postTags: Canadian Dollar,Crude Oil,Dollar Index,EUR/CHF,EUR/USD,MACDs Moving Average,newslettersent,Swiss Franc Index,U.S. Treasuries,USD/CHF,USD/JPY


