Keith Weiner
My articles My offerMy siteAbout meMy videosMy books
Follow on:LinkedINTwitterSeeking AlphaFacebookAmazonGoogle +
See the introduction and the video for the terms gold basis, co-basis, backwardation and contango.
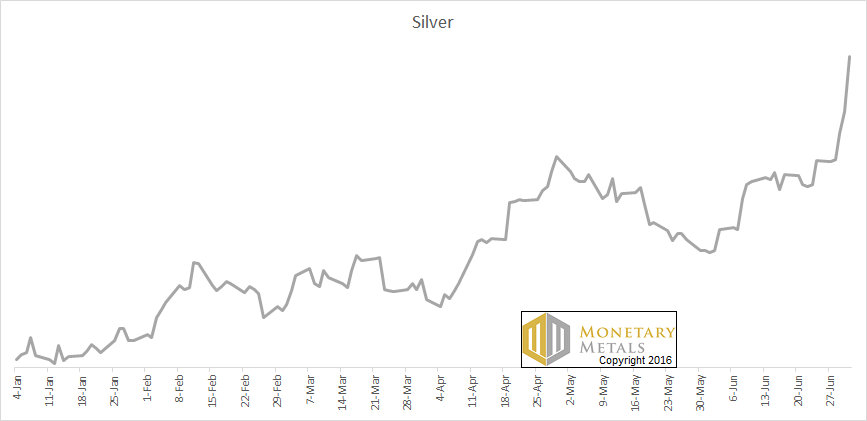
Going Parabolic
From Wednesday through Friday, the price of silver spiked massively. It ended the week about $2 higher than the previous week. The last time we recall silver price action like this was about 3 years ago, in August 2013.
That one week, the price rose about $2.50. Before that was a week in August 2012, with a price gain of about $2.70. Previously, January 2012, +$2.50. Earlier was Oct 2011, +$4. The biggest was in April 2011, +$4.20.
|
 Keith Weiner's weekly look on Gold. Gold and silver prices, Gold-Silver Price Ratio, Gold basis and co-basis and the dollar price, Silver basis and co-basis and the dollar price. - Click to enlarge |
Looking beyond this week, the whole of year 2016 looks like a parabola to us.
Silver price parabolaThe price of gold moved up, but it was not unusual at all. +$26. Especially in the context of the British referendum to leave the EU, it is easy to project onto others one’s own distrust of profligate governments, massive public debts, an opaque banking system, and central banks who are desperately and visibly trying to debase their currencies. However, we would suggest taking a step back and looking at this more calmly. The price moved up. If we set aside the natural tendency towards recency bias, this price move is not so exceptional. Indeed, we have several examples of moves this large or greater. None of those presaged the End of the Monetary World as We Know It. Actually, they presaged further price declines. We have seen headlines on Friday about the “goldwagon to $10,000”, “$360 silver”, and other hyperbolic assertions. It’s never good for your wealth to go into the casino to place your bets based on this kind of information. |
 Keith Weiner's weekly look on Gold. Gold and silver prices, Gold-Silver Price Ratio, Gold basis and co-basis and the dollar price, Silver basis and co-basis and the dollar price. - Click to enlarge |
Fundamental DevelopmentsLet’s look at the only the only true picture of the supply and demand fundamentals for silver, and of course gold too. But first, here is the graph of the metals’ prices.
|
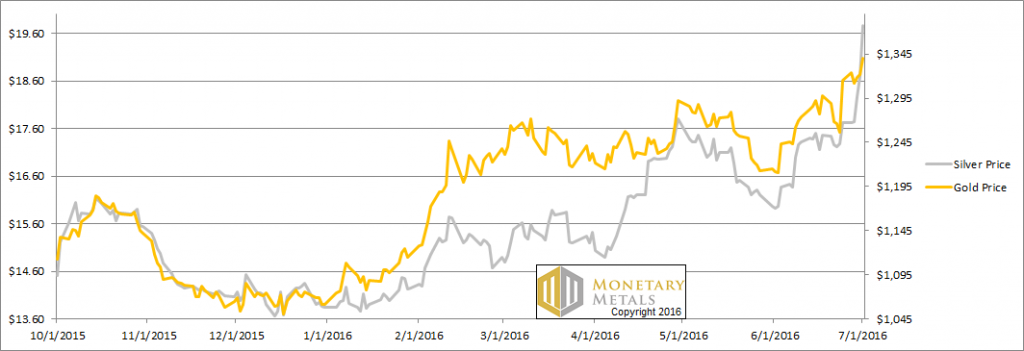 Keith Weiner's weekly look on Gold. Gold and silver prices, Gold-Silver Price Ratio, Gold basis and co-basis and the dollar price, Silver basis and co-basis and the dollar price. - Click to enlarge |
Gold-silver ratioNext, this is a graph of the gold price measured in silver, otherwise known as the gold to silver ratio. The ratio had a mini-collapse this week. |
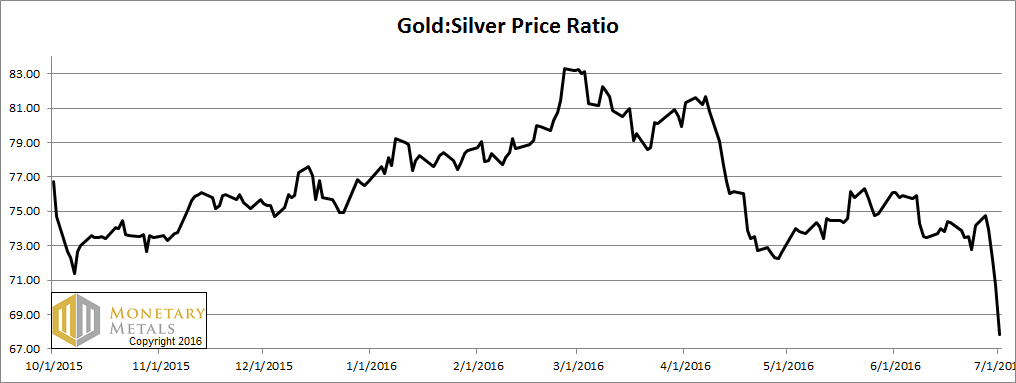 Keith Weiner's weekly look on Gold. Gold and silver prices, Gold-Silver Price Ratio, Gold basis and co-basis and the dollar price, Silver basis and co-basis and the dollar price. - Click to enlarge |
Gold basis and co-basis and the dollar priceHere is the gold graph. Look at that. The price of the dollar dropped (i.e. the price of gold, measured in dollars, rose) almost half a milligram. At the same time, the abundance of gold (i.e. the basis, the blue line) fell from 1.4% to 1.1%. 1.1% is still a high yield for a two month carry trade. But it’s less than it was. Other months did not move so greatly. What could cause the basis of the near month to fall as it nears First Notice Day, the deadline for speculators without the cash to stand for delivery to exit the contract? These speculators, every one of them, must sell. There is downward pressure on the August gold contract, and upward pressure on the October gold contract. It’s no surprise that our calculated fundamental price of gold is up. But not that much, $50. The market price is up $26, so it’s still far above the fundamentals. But this week, about $205.
|
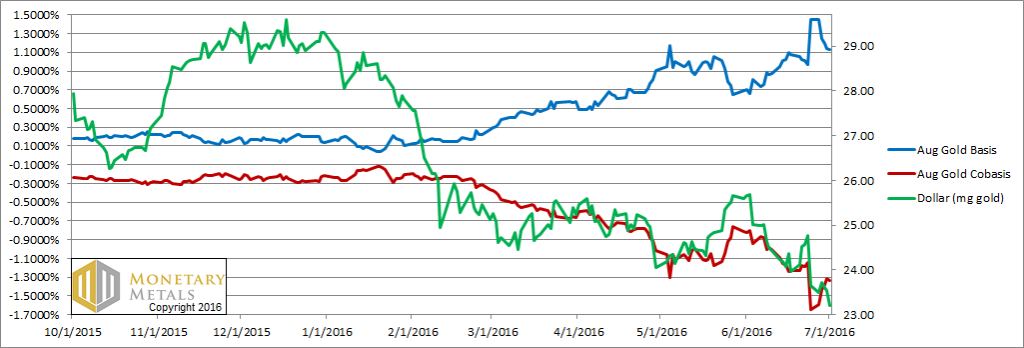 Keith Weiner's weekly look on Gold. Gold and silver prices, Gold-Silver Price Ratio, Gold basis and co-basis and the dollar price, Silver basis and co-basis and the dollar price. - Click to enlarge |
Silver basis and co-basis and the dollar priceNow let’s turn to silver. In silver, as the price of the dollar rose / dollar price of silver, the abundance rose. The fundamental price is up, about $1.35. However, the market price gained about $2, increasing the fundamental-market spread another 65 cents, to just under $3. |
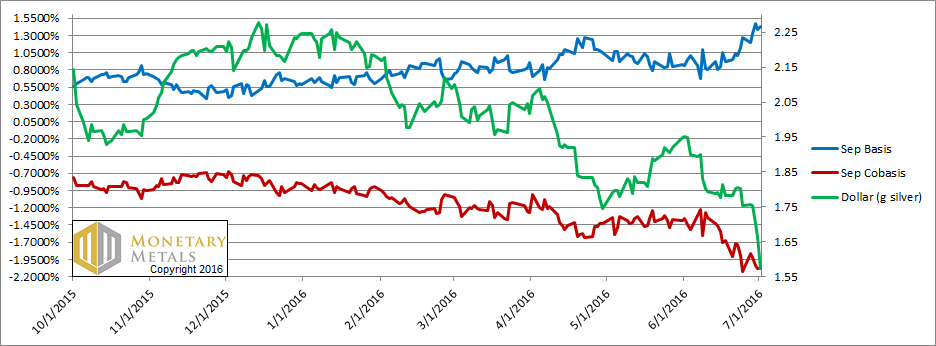 Keith Weiner's weekly look on Gold. Gold and silver prices, Gold-Silver Price Ratio, Gold basis and co-basis and the dollar price, Silver basis and co-basis and the dollar price. - Click to enlarge |
Charts by: Monetary Metals
Full story here Are you the author?
Tags: dollar price,Gold Backwardation,gold basis,Gold co-basis,Gold Contango,gold price,gold silver ratio,Gold-Cobasis,newslettersent,Precious Metals,silver basis,Silver co-basis,silver price