Keith Weiner
My articles My offerMy siteAbout meMy videosMy books
Follow on:LinkedINTwitterSeeking AlphaFacebookAmazonGoogle +
Keith Weiner's weekly look on Gold. Gold and silver prices, Gold-Silver Price Ratio, Gold basis and co-basis and the dollar price, Silver basis and co-basis and the dollar price. - Click to enlarge
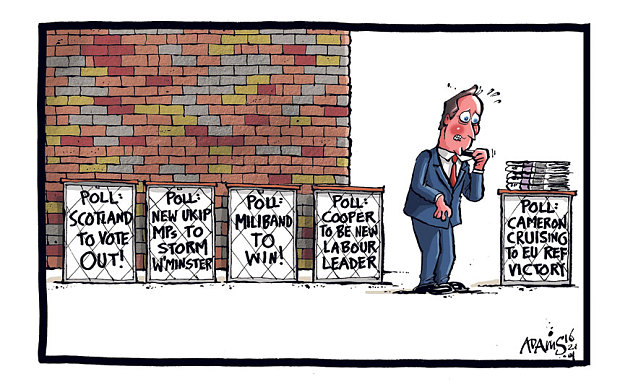
Markets Blindsided by Brexit
The big news this week was that the British voted to exit the European Union. This was not the outcome expected by pundits, or the polls.
“Risk on” assets were relentlessly bid up prior to the vote. For example, S&P 500 index futures had closed the previous Friday, June 17, at 2059. This Thursday, prior to the vote, they were up 60.5 or 2.9%, to 2119.50.
The British pound began its run up a day earlier than the S&P, closing at $1.42 on Thursday, June 16. This Thursday it was up to a high of $1.50. The same pattern occurred in crude oil (West Texas), up over $4 from the June 16 low to the June 23rd high, and in other assets.
After the vote, it was a giant blowout. By Thursday evening (Arizona time), the pound had hit a low of $1.32, a drop of about 18 cents or almost 12%. As of Friday’s close, the S&P was down 3.6% but continued to decline after hours with futures ending down -4.16%.
To hear mainstream gold commentators tell it, gold and silver went up whereas (nearly) everything else went down. That is not how we see it. At all.
The pound, euro, and other currencies are dollar derivatives. Therefore, we think it’s appropriate to price them in terms of the underlying thing from which they are derived. The dollar. The currencies went down in dollar terms, as did stocks.
However, for the same reason that the dollar cannot be properly priced in pounds or euros, gold cannot be priced in the dollar. For the same reason that if you fall off a cliff the height of the cliff top cannot be measured in terms of distance above your head, a meter stick cannot be measured in terms of a rubber band.
The dollar must be priced in gold. The dollar is not precisely a gold derivative. However, it is valuable only because, and only for so long as, gold makes a bid on it.
So we look at it like this. Other currencies and risk assets fell in dollar terms. And the dollar fell in gold terms. The dollar hit its high on that same date (June 16), of 24.36 milligrams of gold. It made a low on Thursday June 23, of 22.89mg, down -1.47mg.
The world’s reserve currency fell 6% in a week. Since everything else went down in terms of that currency, in reality they fell even more.
As always when the dollar falls, most people see only the rise in the price of gold. And gold commentators reiterate their call for gold to go up even more. They say that, now, people are starting to wake up (as if the low price of the metal was due to somnolence), and when they do gold will skyrocket.
We concede that, this time, there is more reason to think that the world of paper may have a big decline (and hence the mirror image, the price of gold, will rise). But as always, we want to see if this price move was real or if it was just leveraged speculators taking on even more leverage and going closer to all-in.
Fundamental Developments
Prices of gold and silverSo let’s look at the only true picture of the supply and demand fundamentals. First, here’s the graph of the metals’ prices. |
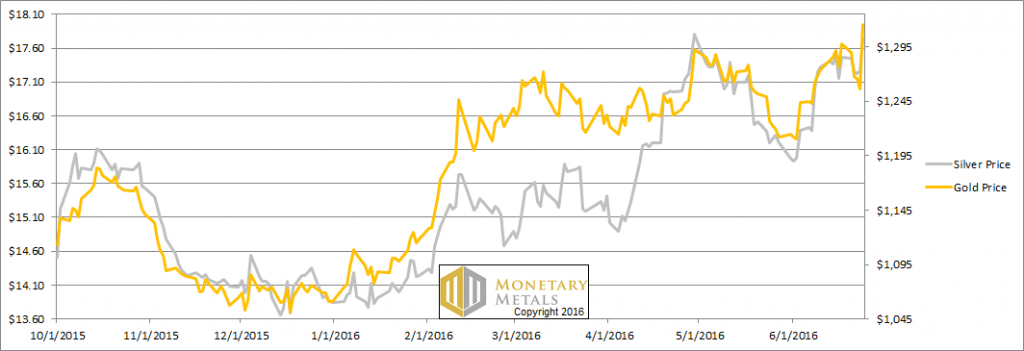 Keith Weiner's weekly look on Gold. Gold and silver prices, Gold-Silver Price Ratio, Gold basis and co-basis and the dollar price, Silver basis and co-basis and the dollar price. - Click to enlarge |
Gold-silver ratioNext, this is a graph of the gold price measured in silver, otherwise known as the gold to silver ratio. The ratio was down a hair this week. |
 Keith Weiner's weekly look on Gold. Gold and silver prices, Gold-Silver Price Ratio, Gold basis and co-basis and the dollar price, Silver basis and co-basis and the dollar price. - Click to enlarge |
Gold basis and co-basis and the dollar priceHere is the gold graph. If you wanted to make a case that the price of gold was going to go higher, a picture of gold abundance (i.e. the basis, the blue line) spiking up would be discouraging. The scarcity (i.e. the co-basis, the red line), already deep into negative territory, fell further in a sharp drop from -1.2% to -1.6%. One can now make an annualized carry of +1.5% to buy gold metal and sell an August future, which will deliver in two months. Where else can you make that kind of return? For comparison, the LIBOR rate for two-month maturity is 0.52%. There can be no question that the marginal buyer of gold is the warehouseman. With such an outsized profit to carry it, surely these folks are keeping busy and off the streets. Why is there such a profit to be made carrying gold? Because current speculators are leveraging up even further, and/or new speculators are entering the game, adding their fresh leveraged bets to the table. After all, gold should go up in an event like Britain leaving the euro zone. As we hinted above, there is a case to be made that gold is a better asset to hold than UK gilts, German Bunds, or US treasuries. It’s the same case that could have been made in 2001 when the price of gold was low, in 2011, when the price was high, last fall when the price was lower or Thursday when the price spiked to $1359. However, you can’t trade based on the background story. Maybe some people will change their preferences. Meanwhile, the debtors are under a rising burden for each dollar of debt due to falling interest rates, not to mention a rising number of dollars of debt as well. About 18 months ago, the Swiss National Bank had been struggling to maintain a peg to the euro, set at 1.2 francs. While the SNB had been blustering that it had unlimited resources to squander, it finally had to let go when it hit its stop-loss. When that happened, the interest rate in Switzerland plunged. Keith wrote a paper arguing that the Swiss franc will collapse. Negative interest is not just a disincentive to hold paper currency (though it is, of course). It is not merely that gold becomes more attractive than negative-yielding paper (though it does, of course). More importantly, negative interest is a powerful incentive to destroy capital. If you could borrow at -1% per annum, then you have a license to lose capital at a rate of 0.5%. Would you want to extend credit like this? We note that the Swiss yield curve has sunk further beneath the surface of zero, since that article in January 2015. The 20-year bond is now drowning, and the 30-year is practically zero. 18 months ago, the 10-year was about -0.25%. Now it is below -0.53%. At some point, this will begin driving people to gold. Not to make a bet on its price, using leverage, and ultimately to make more dollars. But to own, as a way of avoiding falling rates and rising counterparty risk. However, it doesn’t look like we’re at that point just yet. Indeed, despite the rise in the market price, we see a drop in our calculated fundamental price. It’s now a bit under $1,100, or about $230 below the market. As we often say, we do NOT recommend naked shorting a monetary metal. It is always possible that some central bank will do something even more crazy and the price could go +$250 in an instant. Additionally, chartists may be drawn to bet on the gold price because they see momentum. We can tell you that the metal is overpriced, or conversely the dollar is underpriced. By a sizable amount. |
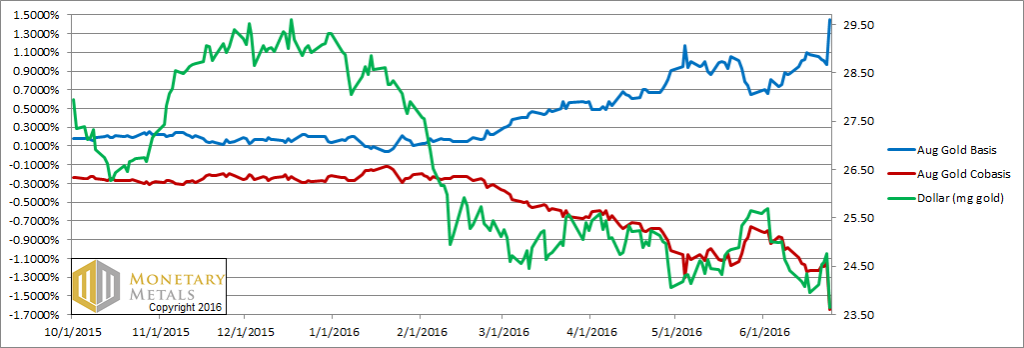 Keith Weiner's weekly look on Gold. Gold and silver prices, Gold-Silver Price Ratio, Gold basis and co-basis and the dollar price, Silver basis and co-basis and the dollar price. - Click to enlarge
|
Silver basis and co-basis and the dollar priceNow let’s turn to silver. It’s a similar picture in silver. The fundamental price didn’t move much, while the market price is up about 27 cents. The price of the metal is about $2.60 over what we calculate is its fundamental. Interestingly, this puts the fundamental ratio below the market, under 72. We shall see if this state persists. |
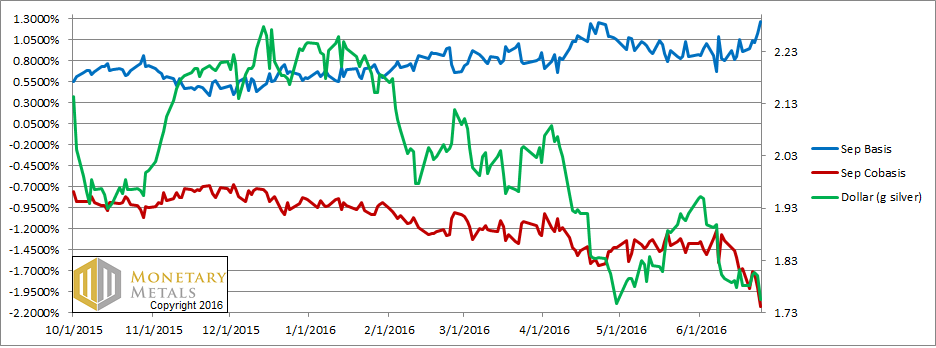 Keith Weiner's weekly look on Gold. Gold and silver prices, Gold-Silver Price Ratio, Gold basis and co-basis and the dollar price, Silver basis and co-basis and the dollar price. - Click to enlarge
|
Charts by: Monetary Metals
Full story here Are you the author?
Tags: dollar price,gold basis,Gold co-basis,gold price,gold ratio,gold silver ratio,Gold-Cobasis,newslettersent,Precious Metals,silver basis,Silver co-basis,silver price,silver ratio